

Indikator Sosial Ekonomi Mei 2013 - Badan Pusat Statistik
Indikator Sosial Ekonomi Mei 2013 - Badan Pusat Statistik
Indikator Sosial Ekonomi Mei 2013 - Badan Pusat Statistik

You also want an ePaper? Increase the reach of your titles
YUMPU automatically turns print PDFs into web optimized ePapers that Google loves.
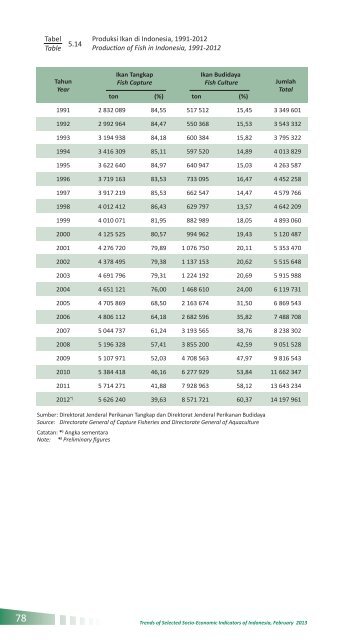
TabelTable 5.14Produksi Ikan di Indonesia, 1991-2012Production of Fish in Indonesia, 1991-2012TahunYearIkan TangkapFish CaptureIkan BudidayaFish Cultureton (%) ton (%)JumlahTotal1991 2 832 089 84,55 517 512 15,45 3 349 6011992 2 992 964 84,47 550 368 15,53 3 543 3321993 3 194 938 84,18 600 384 15,82 3 795 3221994 3 416 309 85,11 597 520 14,89 4 013 8291995 3 622 640 84,97 640 947 15,03 4 263 5871996 3 719 163 83,53 733 095 16,47 4 452 2581997 3 917 219 85,53 662 547 14,47 4 579 7661998 4 012 412 86,43 629 797 13,57 4 642 2091999 4 010 071 81,95 882 989 18,05 4 893 0602000 4 125 525 80,57 994 962 19,43 5 120 4872001 4 276 720 79,89 1 076 750 20,11 5 353 4702002 4 378 495 79,38 1 137 153 20,62 5 515 6482003 4 691 796 79,31 1 224 192 20,69 5 915 9882004 4 651 121 76,00 1 468 610 24,00 6 119 7312005 4 705 869 68,50 2 163 674 31,50 6 869 5432006 4 806 112 64,18 2 682 596 35,82 7 488 7082007 5 044 737 61,24 3 193 565 38,76 8 238 3022008 5 196 328 57,41 3 855 200 42,59 9 051 5282009 5 107 971 52,03 4 708 563 47,97 9 816 5432010 5 384 418 46,16 6 277 929 53,84 11 662 3472011 5 714 271 41,88 7 928 963 58,12 13 643 2342012 *) 5 626 240 39,63 8 571 721 60,37 14 197 961Sumber: Direktorat Jenderal Perikanan Tangkap dan Direktorat Jenderal Perikanan BudidayaSource: Directorate General of Capture Fisheries and Directorate General of AquacultureCatatan: * ) Angka sementaraNote: * ) Preliminary figures78Trends of Selected Socio-Economic Indicators of Indonesia, February <strong>2013</strong>


