Indikator Sosial Ekonomi Mei 2013 - Badan Pusat Statistik
Indikator Sosial Ekonomi Mei 2013 - Badan Pusat Statistik
Indikator Sosial Ekonomi Mei 2013 - Badan Pusat Statistik
You also want an ePaper? Increase the reach of your titles
YUMPU automatically turns print PDFs into web optimized ePapers that Google loves.
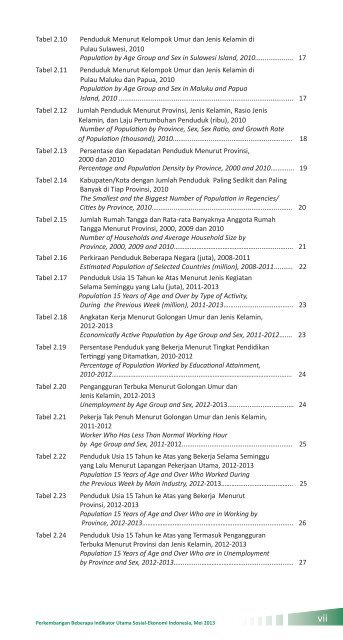
Tabel 2.10Tabel 2.11Tabel 2.12Tabel 2.13Tabel 2.14Penduduk Menurut Kelompok Umur dan Jenis Kelamin diPulau Sulawesi, 2010Population by Age Group and Sex in Sulawesi Island, 2010.................... 17Penduduk Menurut Kelompok Umur dan Jenis Kelamin diPulau Maluku dan Papua, 2010Population by Age Group and Sex in Maluku and PapuaIsland, 2010 ............................................................................................ 17Jumlah Penduduk Menurut Provinsi, Jenis Kelamin, Rasio JenisKelamin, dan Laju Pertumbuhan Penduduk (ribu), 2010Number of Population by Province, Sex, Sex Ratio, and Growth Rateof Population (thousand), 2010............................................................... 18Persentase dan Kepadatan Penduduk Menurut Provinsi,2000 dan 2010Percentage and Population Density by Province, 2000 and 2010……....... 19Kabupaten/Kota dengan Jumlah Penduduk Paling Sedikit dan PalingBanyak di Tiap Provinsi, 2010The Smallest and the Biggest Number of Population in Regencies/Cities by Province, 2010…….......................................................…......….. 20Tabel 2.15 Jumlah Rumah Tangga dan Rata-rata Banyaknya Anggota RumahTangga Menurut Provinsi, 2000, 2009 dan 2010Number of Households and Average Household Size byProvince, 2000, 2009 and 2010….……………………………………..............….... 21Tabel 2.16 Perkiraan Penduduk Beberapa Negara (juta), 2008-2011Estimated Population of Selected Countries (million), 2008-2011.......... 22Tabel 2.17 Penduduk Usia 15 Tahun ke Atas Menurut Jenis KegiatanSelama Seminggu yang Lalu (juta), 2011-<strong>2013</strong>Population 15 Years of Age and Over by Type of Activity,During the Previous Week (million), 2011-<strong>2013</strong>……......................…….... 23Tabel 2.18Tabel 2.19Tabel 2.20Tabel 2.21Tabel 2.22Tabel 2.23Tabel 2.24Angkatan Kerja Menurut Golongan Umur dan Jenis Kelamin,2012-<strong>2013</strong>Economically Active Population by Age Group and Sex, 2011-2012….... 23Persentase Penduduk yang Bekerja Menurut Tingkat PendidikanTertinggi yang Ditamatkan, 2010-2012Percentage of Population Worked by Educational Attainment,2010-2012…………….................……….............…………….…………………......…... 24Pengangguran Terbuka Menurut Golongan Umur danJenis Kelamin, 2012-<strong>2013</strong>Unemployment by Age Group and Sex, 2012-<strong>2013</strong>.................................... 24Pekerja Tak Penuh Menurut Golongan Umur dan Jenis Kelamin,2011-2012Worker Who Has Less Than Normal Working Hourby Age Group and Sex, 2011-2012............................................................ 25Penduduk Usia 15 Tahun ke Atas yang Bekerja Selama Semingguyang Lalu Menurut Lapangan Pekerjaan Utama, 2012-<strong>2013</strong>Population 15 Years of Age and Over Who Worked Duringthe Previous Week by Main Industry, 2012-<strong>2013</strong>……….........………......…….. 25Penduduk Usia 15 Tahun ke Atas yang Bekerja MenurutProvinsi, 2012-<strong>2013</strong>Population 15 Years of Age and Over Who are in Working byProvince, 2012-<strong>2013</strong>………………..…..............……………................................. 26Penduduk Usia 15 Tahun ke Atas yang Termasuk PengangguranTerbuka Menurut Provinsi dan Jenis Kelamin, 2012-<strong>2013</strong>Population 15 Years of Age and Over Who are in Unemploymentby Province and Sex, 2012-<strong>2013</strong>...............……………………............................ 27Perkembangan Beberapa <strong>Indikator</strong> Utama <strong>Sosial</strong>-<strong>Ekonomi</strong> Indonesia, <strong>Mei</strong> <strong>2013</strong>vii


