TabelTable 9.10Rata-rata Harga Gabah di Tingkat Petani Menurut Kelompok Kualitas(rupiah/kg), Januari 2011-April <strong>2013</strong>Average Price of Paddy at Farmer Level by Quality Group (rupiahs/kg),January 2011-April <strong>2013</strong>2011Tahun, BulanYear, MonthGKGKualitas Gabah/Paddy QualityGKPRendahLow QualityHPPJanuari/January 4 144,80 3 878,16 2 930,93 2 640Februari/February 3 987,38 3 314,19 2 569,84 2 640Maret/March 3 742,33 3 018,39 2 677,27 2 640April/April 3 663,81 3 193,50 2 787,17 2 640<strong>Mei</strong>/May 3 577,62 3 285,78 2 838,48 2 640Juni/June 3 859,65 3 364,67 2 973,73 2 640Juli/July 3 990,07 3 589,98 3 203,54 2 640Agustus/August 3 988,54 3 731,67 3 495,11 2 640September/September 4 190,09 3 760,41 3 574,78 2 640Oktober/October 4 291,77 3 920,45 3 546,41 2 640November/November 4 371,45 3 929,28 3 639,07 2 640Desember/December 4 550,31 4 082,44 3 690,12 2 6402012Januari/January 4 776,92 4 406,32 3 804,19 2 640Februari/February 4 667,85 4 156,31 3 549,24 2 640Maret/March 4 269,25 3 621,41 3 157,24 3 300April/April 4 276,90 3 725,51 3 312,89 3 300<strong>Mei</strong>/May 4 256,96 3 834,91 3 420,78 3 300Juni/June 4 345,36 3 860,73 3 434,74 3 300Juli/July 4 424,16 3 885,29 3 581,89 3 300Agustus/August 4 377,74 3 862,13 3 574,28 3 300September/September 4 405,39 3 911,14 3 604,34 3 300Oktober/October 4 467,78 3 930,35 3 667,57 3 300November/November 4 585,88 4 048,23 3 815,32 3 300Desember/December 4 773,62 4 130,79 3 780,99 3 300<strong>2013</strong>Januari/January 4 812,16 4 333,19 3 744,51 3 300Februari/February 4 724,86 4 265,58 3 475,13 3 300Maret/March 4 437,56 3 783,15 3 378,06 3 300April/April 4 232,08 3 669,04 3 274,95 3 300Sumber: - Data 2011 dari Berita Resmi <strong>Statistik</strong>, BPS- <strong>Statistik</strong> Harga Produsen Gabah di Indonesia, BPSSource: - 2011 from Official Statistics News, BPS-Statistics Indonesia- Producer Price Statistics of Paddy in Indonesia, BPS-Statistics IndonesiaCatatan/Note: GKG = Gabah Kering Giling/Dried Unhusked RiceGKP = Gabah Kering Panen/Dried Harvested RiceHPP = Harga Pembelian Pemerintah /Government Purchasing PricePerkembangan Beberapa <strong>Indikator</strong> Utama <strong>Sosial</strong>-<strong>Ekonomi</strong> Indonesia, Februari <strong>2013</strong>131
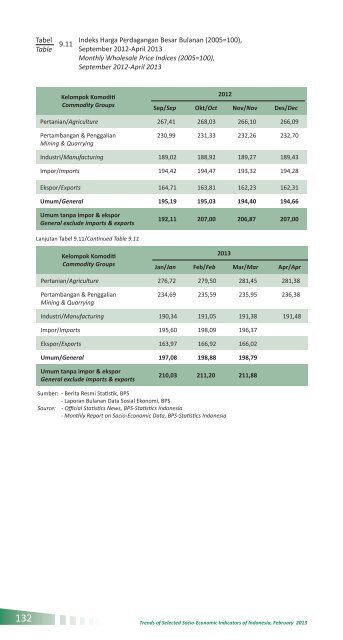
TabelTable 9.11Indeks Harga Perdagangan Besar Bulanan (2005=100),September 2012-April <strong>2013</strong>Monthly Wholesale Price Indices (2005=100),September 2012-April <strong>2013</strong>Kelompok KomoditiCommodity Groups2012Sep/Sep Okt/Oct Nov/Nov Des/DecPertanian/Agriculture 267,41 268,03 266,10 266,09Pertambangan & PenggalianMining & Quarrying230,99 231,33 232,26 232,70Industri/Manufacturing 189,02 188,92 189,27 189,43Impor/Imports 194,42 194,47 193,32 194,28Ekspor/Exports 164,71 163,81 162,23 162,31Umum/General 195,19 195,03 194,40 194,66Umum tanpa impor & eksporGeneral exclude imports & exports192,11 207,00 206,87 207,00Lanjutan Tabel 9.11/Continued Table 9.11Kelompok KomoditiCommodity Groups<strong>2013</strong>Jan/Jan Feb/Feb Mar/Mar Apr/AprPertanian/Agriculture 276,72 279,50 281,45 281,38Pertambangan & PenggalianMining & Quarrying234,69 235,59 235,95 236,38Industri/Manufacturing 190,34 191,05 191,38 191,48Impor/Imports 195,60 198,09 196,37Ekspor/Exports 163,97 166,92 166,02Umum/General 197,08 198,88 198,79Umum tanpa impor & eksporGeneral exclude imports & exports210,03 211,20 211,88Sumber: - Berita Resmi <strong>Statistik</strong>, BPS- Laporan Bulanan Data <strong>Sosial</strong> <strong>Ekonomi</strong>, BPSSource: - Official Statistics News, BPS-Statistics Indonesia- Monthly Report on Socio-Economic Data, BPS-Statistics Indonesia132Trends of Selected Socio-Economic Indicators of Indonesia, February <strong>2013</strong>