

Indikator Sosial Ekonomi Mei 2013 - Badan Pusat Statistik
Indikator Sosial Ekonomi Mei 2013 - Badan Pusat Statistik
Indikator Sosial Ekonomi Mei 2013 - Badan Pusat Statistik

Create successful ePaper yourself
Turn your PDF publications into a flip-book with our unique Google optimized e-Paper software.
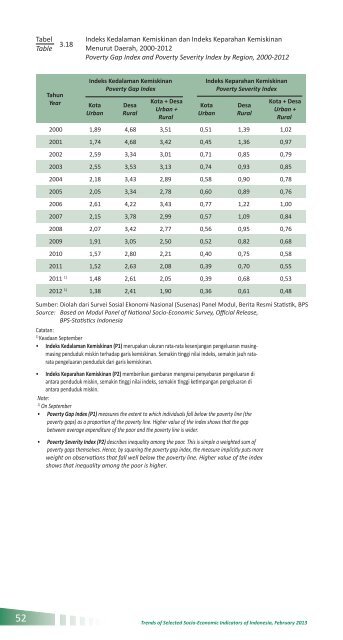
TabelTable 3.18Indeks Kedalaman Kemiskinan dan Indeks Keparahan KemiskinanMenurut Daerah, 2000-2012Poverty Gap Index and Poverty Severity Index by Region, 2000-2012TahunYearIndeks Kedalaman KemiskinanPoverty Gap IndexKotaUrbanDesaRuralKota + DesaUrban +RuralIndeks Keparahan KemiskinanPoverty Severity IndexKotaUrbanDesaRuralKota + DesaUrban +Rural2000 1,89 4,68 3,51 0,51 1,39 1,022001 1,74 4,68 3,42 0,45 1,36 0,972002 2,59 3,34 3,01 0,71 0,85 0,792003 2,55 3,53 3,13 0,74 0,93 0,852004 2,18 3,43 2,89 0,58 0,90 0,782005 2,05 3,34 2,78 0,60 0,89 0,762006 2,61 4,22 3,43 0,77 1,22 1,002007 2,15 3,78 2,99 0,57 1,09 0,842008 2,07 3,42 2,77 0,56 0,95 0,762009 1,91 3,05 2,50 0,52 0,82 0,682010 1,57 2,80 2,21 0,40 0,75 0,582011 1,52 2,63 2,08 0,39 0,70 0,552011 1) 1,48 2,61 2,05 0,39 0,68 0,532012 1) 1,38 2,41 1,90 0,36 0,61 0,48Sumber: Diolah dari Survei <strong>Sosial</strong> <strong>Ekonomi</strong> Nasional (Susenas) Panel Modul, Berita Resmi <strong>Statistik</strong>, BPSSource: Based on Modul Panel of National Socio-Economic Survey, Official Release,BPS-Statistics IndonesiaCatatan:1)Keadaan September• Indeks Kedalaman Kemiskinan (P1) merupakan ukuran rata-rata kesenjangan pengeluaran masingmasingpenduduk miskin terhadap garis kemiskinan. Semakin tinggi nilai indeks, semakin jauh rataratapengeluaran penduduk dari garis kemiskinan.• Indeks Keparahan Kemiskinan (P2) memberikan gambaran mengenai penyebaran pengeluaran diantara penduduk miskin, semakin tinggi nilai indeks, semakin tinggi ketimpangan pengeluaran diantara penduduk miskin.Note:1)On September• Poverty Gap Index (P1) measures the extent to which individuals fall below the poverty line (thepoverty gaps) as a proportion of the poverty line. Higher value of the index shows that the gapbetween average expenditure of the poor and the poverty line is wider.• Poverty Severity Index (P2) describes inequality among the poor. This is simple a weighted sum ofpoverty gaps themselves. Hence, by squaring the poverty gap index, the measure implicitly puts moreweight on observations that fall well below the poverty line. Higher value of the indexshows that inequality among the poor is higher.52Trends of Selected Socio-Economic Indicators of Indonesia, February <strong>2013</strong>


