5. Test per proporzioni: confronto tra campioni e ... - statistica.it
5. Test per proporzioni: confronto tra campioni e ... - statistica.it
5. Test per proporzioni: confronto tra campioni e ... - statistica.it

You also want an ePaper? Increase the reach of your titles
YUMPU automatically turns print PDFs into web optimized ePapers that Google loves.
+<br />
=<br />
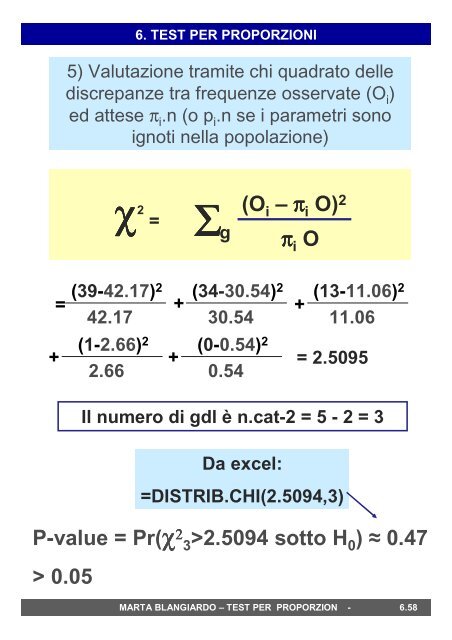
6. TEST PER PROPORZIONI<br />
5) Valutazione <strong>tra</strong>m<strong>it</strong>e chi quadrato delle<br />
discrepanze <strong>tra</strong> frequenze osservate (O i )<br />
ed attese π i .n (o p i .n se i parametri sono<br />
ignoti nella popolazione)<br />
(39-42.17) 2<br />
42.17<br />
(1-2.66) 2<br />
2.66<br />
χ 2<br />
= Σ (O i – π i O) 2<br />
+<br />
g<br />
(34-30.54) 2<br />
30.54<br />
(0-0.54) 2<br />
π i O<br />
MARTA BLANGIARDO – TEST PER PROPORZION - 6.58<br />
+<br />
(13-11.06) 2<br />
11.06<br />
+ = 2.5095<br />
0.54<br />
P-value = Pr(χ 2 3>2.5094 sotto H 0) ≈ 0.47<br />
> 0.05<br />
Il numero di gdl è n.cat-2 = 5 - 2 = 3<br />
Da excel:<br />
=DISTRIB.CHI(2.5094,3)