Incentivazione degli impianti fotovoltaici Relazione delle attività - Gse
Incentivazione degli impianti fotovoltaici Relazione delle attività - Gse
Incentivazione degli impianti fotovoltaici Relazione delle attività - Gse

You also want an ePaper? Increase the reach of your titles
YUMPU automatically turns print PDFs into web optimized ePapers that Google loves.
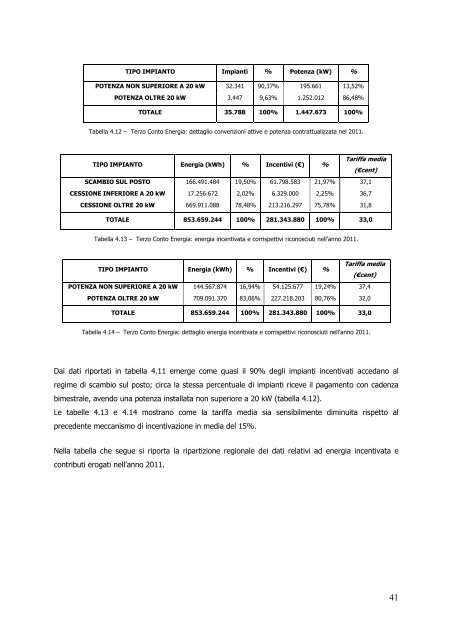
TIPO IMPIANTO Impianti % Potenza (kW) %<br />
POTENZA NON SUPERIORE A 20 kW 32.341 90,37% 195.661 13,52%<br />
POTENZA OLTRE 20 kW 3.447 9,63% 1.252.012 86,48%<br />
TOTALE 35.788 100% 1.447.673 100%<br />
Tabella 4.12 – Terzo Conto Energia: dettaglio convenzioni attive e potenza contrattualizzata nel 2011.<br />
TIPO IMPIANTO Energia (kWh) % Incentivi (€) %<br />
Tariffa media<br />
(€cent)<br />
SCAMBIO SUL POSTO 166.491.484 19,50% 61.798.583 21,97% 37,1<br />
CESSIONE INFERIORE A 20 kW 17.256.672 2,02% 6.329.000 2,25% 36,7<br />
CESSIONE OLTRE 20 kW 669.911.088 78,48% 213.216.297 75,78% 31,8<br />
TOTALE 853.659.244 100% 281.343.880 100% 33,0<br />
Tabella 4.13 – Terzo Conto Energia: energia incentivata e corrispettivi riconosciuti nell’anno 2011.<br />
TIPO IMPIANTO Energia (kWh) % Incentivi (€) %<br />
Tariffa media<br />
(€cent)<br />
POTENZA NON SUPERIORE A 20 kW 144.567.874 16,94% 54.125.677 19,24% 37,4<br />
POTENZA OLTRE 20 kW 709.091.370 83,06% 227.218.203 80,76% 32,0<br />
TOTALE 853.659.244 100% 281.343.880 100% 33,0<br />
Tabella 4.14 – Terzo Conto Energia: dettaglio energia incentivata e corrispettivi riconosciuti nell’anno 2011.<br />
Dai dati riportati in tabella 4.11 emerge come quasi il 90% <strong>degli</strong> <strong>impianti</strong> incentivati accedano al<br />
regime di scambio sul posto; circa la stessa percentuale di <strong>impianti</strong> riceve il pagamento con cadenza<br />
bimestrale, avendo una potenza installata non superiore a 20 kW (tabella 4.12).<br />
Le tabelle 4.13 e 4.14 mostrano come la tariffa media sia sensibilmente diminuita rispetto al<br />
precedente meccanismo di incentivazione in media del 15%.<br />
Nella tabella che segue si riporta la ripartizione regionale dei dati relativi ad energia incentivata e<br />
contributi erogati nell’anno 2011.<br />
41