Eliminazione del rischio da cromo esavalente nei refrattari esausti ...
Eliminazione del rischio da cromo esavalente nei refrattari esausti ...
Eliminazione del rischio da cromo esavalente nei refrattari esausti ...

You also want an ePaper? Increase the reach of your titles
YUMPU automatically turns print PDFs into web optimized ePapers that Google loves.
11-12/2004 Memorie<br />
6<br />
METALLURGIA FISICA<br />
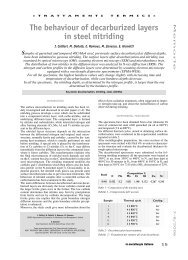
Fig 9 – Ni-B phase diagrams. Experimental points (circles giving<br />
the peritectoidic temperature and triangles giving the liquidus<br />
temperature) have been obtained from DSC analysis. Full lines:<br />
equilibrium phase diagram from literature; <strong>da</strong>shed lines:<br />
estimated metastable phase diagram.<br />
Fig. 9 – Diagrammi di fase Ni-B. I punti sperimentali (i cerchi<br />
rappresentano la temperatura peritettoidica e i triangoli la<br />
temperatura di liquidus) sono stati ottenuti <strong>da</strong>ll'analisi DSC.<br />
Linee continue: diagramma di fase di equilibrio <strong>da</strong>lla letteratura;<br />
linee tratteggiate: diagramma di fase metastabile stimato.<br />
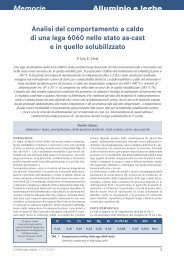
Fig. 10 – Calculated Al-Ce equilibrium (full lines) and metastable<br />
(<strong>da</strong>shed lines) phase diagram. The symbols represent<br />
experimental input <strong>da</strong>ta.<br />
Fig. 10 – Diagramma di fase Al-Ce calcolato (linee continue) e<br />
metastabile (linee tratteggiate). I simboli rappresentano i <strong>da</strong>ti<br />
sperimentali forniti in input.<br />
has been obtained from a few degrees up to about 150 K.<br />
The degree of undercooling (∆T) depends strongly on the<br />
occurrence of heterogeneous nucleation events in each experiment,<br />
so there is no correlation between ∆T and cooling<br />
rate, sample mass or alloy composition. On solidification in<br />
undercooling, a new metastable phase (Ni 23 B 6 ) was produced.<br />
The thermal analysis curves of samples of various compositions<br />
provided a metastable Ni-B phase diagram (figure<br />
9). The stable phase diagram, obtained from a recent<br />
CALPHAD assessment [29], is also reported for comparison.<br />
Dashed lines in figure 9 represent the calculated meta-<br />
la metallurgia italiana<br />
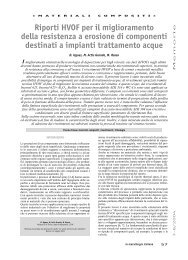
Fig. 11 – Section of metastable Al-Ni-Ce phase diagram<br />
calculated at 450 K, including fcc-Al and liquid (amorphous)<br />
phases. Dotted line gives an example of a tie-line connecting Al<br />
and residual amorphous phase in metastable equilibrium after<br />
primary crystallisation in an Al Ni Ce amorphous alloy<br />
87 10 3<br />
(square).<br />
Fig. 11 - Sezione <strong>del</strong> diagramma di fase metastabile Al-Ni-Ce<br />
calcolata a 450 K includendo le fasi fcc-Al e liqui<strong>da</strong> (amorfa). La<br />
linea punteggiata fornisce un esempio di equilibrio tra la fase<br />
alluminio e la fase amorfa residua in equilibrio metastabile dopo<br />
la cristallizzazione primaria in una lega amorfa Al Ni Ce 87 10 3<br />
(quadrato).<br />
stable Ni-B phase diagram, obtained including the Ni 23 B 6<br />
phase and suspending the Ni 3 B compound. The metastable<br />
Ni 23 B 6 phase decomposes on heating with a peritectoid reaction<br />
into Ni and a phase richer in B, possibly Ni 2 B. The eutectic<br />
between these phases occurs a few degrees above the<br />
first transformation. From the trend of the liquidus, the metastable<br />
eutectic between Ni and Ni 2 B can be located approximately<br />
at 20 at% B.<br />
NANOCRYSTALLINE ALLOYS IN Al-Ce [30]<br />
AND Al-Ni-Ce [31]<br />
Improved mechanical properties have been recently evidenced<br />
in different Al-RE and Al-Ni-RE (RE=rare earth) alloy<br />
systems when a nano-scale microstructure is obtained [32].<br />
Such a microstructure may be obtained by suitable annealing<br />
of amorphous alloys. In order to illustrate the thermodynamic<br />
and kinetic aspects which promote the formation<br />
of nanocrystals by primary crystallisation in amorphous<br />
alloys, a thermodynamic assessment of stable and metastable<br />
phases has been carried out for Al-Ce and Al-Ni-Ce systems.<br />
A thermodynamic assessments of the Al-Ce system using<br />
experimental <strong>da</strong>ta of stable and metastable phases has been<br />
carried out and, on the basis of the Gibbs energies obtained<br />
for all phases, the driving forces for nucleation has been calculated<br />
as a function of temperature and composition [30].<br />
Heats of crystallization of the amorphous phase and experimentally<br />
obtained specific heats of the liquid were used for<br />
the description of the metastable states [33]. The assessed<br />
Al-Ce phase diagrams is shown in figure 10. The liquidus<br />
points are generally well reproduced and the eutectic composition<br />
was calculated at 97 Al at%. Assuming that the formation<br />
of the intermetallic compounds can be kinetically<br />
by-passed, a metastable phase diagram between the solid so-