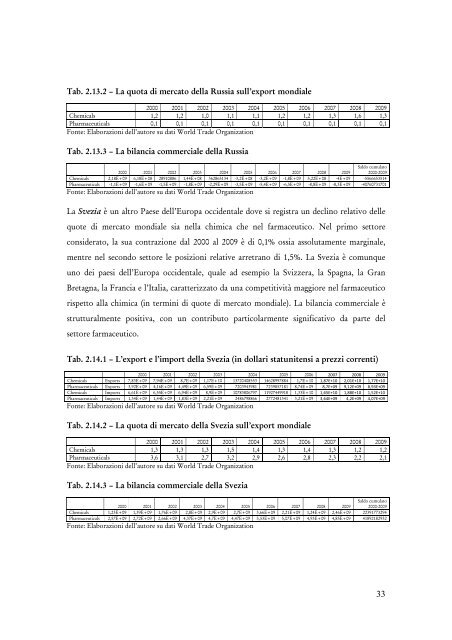
L’India è un paese che sta regis<strong>tra</strong>ndo una crescita rilevante sia nel settore chimico che <strong>in</strong> quello farmaceutico. Partendo da posizioni, <strong>in</strong> term<strong>in</strong>i di quote di mercato mondiale, piuttosto marg<strong>in</strong>ali (solo lo 0,7% nella <strong>chimica</strong> e l’1% nel farmaceutico nel 2000), nove anni dopo tali valori sono saliti all’1,3% <strong>in</strong> en<strong>tra</strong>mbi i settori. Di fatto, per la <strong>chimica</strong> significa il raddoppio della quota mondiale anche se, <strong>in</strong> assoluto, il peso relativo resta marg<strong>in</strong>ale. <strong>La</strong> bilancia commerciale <strong>in</strong>diana resta <strong>in</strong> disavanzo, sebbene il contributo negativo venga essenzialmente dalla <strong>chimica</strong>, mentre il farmaceutico resta <strong>in</strong> attivo. Tab. 2.12.1 – L’export e l’import dell’India (<strong>in</strong> dollari statunitensi a prezzi correnti) 2000 2001 2002 2003 2004 2005 2006 2007 2008 2009 Chemicals Exports 4,34E+09 4,69E+09 5,51E+09 6,65E+09 8775430000 11389000000 1,42E+10 1,69E+10 2,08E+10 1,81E+10 Pharmaceuticals Exports 1,14E+09 1,3E+09 1,58E+09 1,92E+09 2218245000 2713000000 3,44E+09 4,59E+09 5,95E+09 5,74E+09 Chemicals Imports 4,81E+09 4,94E+09 5,51E+09 6,99E+09 9405609860 13859000000 1,62E+10 2,19E+10 3,45E+10 2,66E+10 Pharmaceuticals Imports 3,75E+08 4,02E+08 5,42E+08 6,33E+08 689469901 970000000 1,18E+09 1,7E+09 1,91E+09 2,01E+09 Fonte: Elaborazioni dell’autore su dati World Trade Organization Tab. 2.12.2 – <strong>La</strong> quota di mercato dell’India sull’export mondiale 2000 2001 2002 2003 2004 2005 2006 2007 2008 2009 Chemicals 0,7 0,8 0,8 0,8 0,9 1,0 1,1 1,1 1,2 1,3 Pharmaceuticals 1,0 1,0 0,9 0,9 0,9 1,0 1,1 1,2 1,4 1,3 Fonte: Elaborazioni dell’autore su dati World Trade Organization Tab. 2.12.3 – <strong>La</strong> bilancia commerciale dell’India 32 2000 2001 2002 2003 2004 2005 2006 2007 2008 2009 Saldo cumulato 2000-2009 Chemicals -4,8E+08 -2,5E+08 -764294 -3,3E+08 -6,3E+08 -2,5E+09 -2E+09 -5,1E+09 -1,4E+10 -8,5E+09 -33427632318 Pharmaceuticals 7,65E+08 9,01E+08 1,04E+09 1,28E+09 1,53E+09 1,74E+09 2,26E+09 2,89E+09 4,04E+09 3,74E+09 20181781374 Fonte: Elaborazioni dell’autore su dati World Trade Organization <strong>La</strong> Russia è un paese che, fondamentalmente, resta marg<strong>in</strong>ale nel commercio della <strong>chimica</strong> e, <strong>in</strong> particolare, del farmaceutico. <strong>La</strong> sua quota di mercato a livello mondiale cresce, nel primo settore, nel periodo analizzato di solo lo 0,1, mentre nel farmaceutico resta <strong>in</strong>variata. <strong>La</strong> bilancia commerciale è strutturalmente negativa, <strong>in</strong> particolare nel settore farmaceutico, mentre <strong>in</strong> quello chimico tale disavanzo è fondamentalmente limitato e si manifesta a partire dal 2005. Di fatto, quasi il 90% del disavanzo cumulato nella bilancia commerciale dipende dal settore farmaceutico. Tab. 2.13.1 – L’export e l’import della Russia (<strong>in</strong> dollari statunitensi a prezzi correnti) Pharmaceuticals Exports 1,5E+08 1,14E+08 1,29E+08 2,27E+08 234426630 234304221 2,76E+08 3,34E+08 3,59E+08 4,28E+08 Chemicals Imports 4,93E+09 6,28E+09 6,86E+09 8,31E+09 10162723181 13579351876 1,83E+10 2,1E+10 2,7E+10 2,24E+10 Pharmaceuticals Imports 1,23E+09 1,71E+09 1,65E+09 2,01E+09 2523813880 3733594889 5,67E+09 6,82E+09 9,2E+09 8,7E+09 Fonte: Elaborazioni dell’autore su dati World Trade Organization
Tab. 2.13.2 – <strong>La</strong> quota di mercato della Russia sull’export mondiale 2000 2001 2002 2003 2004 2005 2006 2007 2008 2009 Chemicals 1,2 1,2 1,0 1,1 1,1 1,2 1,2 1,3 1,6 1,3 Pharmaceuticals 0,1 0,1 0,1 0,1 0,1 0,1 0,1 0,1 0,1 0,1 Fonte: Elaborazioni dell’autore su dati World Trade Organization Tab. 2.13.3 – <strong>La</strong> bilancia commerciale della Russia 2000 2001 2002 2003 2004 2005 2006 2007 2008 2009 Saldo cumulato 2000-2009 Chemicals 2,18E+09 6,18E+08 28910886 1,44E+08 362865134 -3,2E+08 -3,2E+09 -1,8E+09 5,22E+08 -4E+09 -5566653514 Pharmaceuticals -1,1E+09 -1,6E+09 -1,5E+09 -1,8E+09 -2,29E+09 -3,5E+09 -5,4E+09 -6,5E+09 -8,8E+09 -8,3E+09 -40760731701 Fonte: Elaborazioni dell’autore su dati World Trade Organization <strong>La</strong> Svezia è un altro Paese dell’Europa occidentale dove si regis<strong>tra</strong> un decl<strong>in</strong>o relativo delle quote di mercato mondiale sia nella <strong>chimica</strong> che nel farmaceutico. Nel primo settore considerato, la sua con<strong>tra</strong>zione dal 2000 al 2009 è di 0,1% ossia assolutamente marg<strong>in</strong>ale, mentre nel secondo settore le posizioni relative arre<strong>tra</strong>no di 1,5%. <strong>La</strong> Svezia è comunque uno dei paesi dell’Europa occidentale, quale ad esempio la Svizzera, la Spagna, la Gran Bretagna, la Francia e l’Italia, caratterizzato da una competitività maggiore nel farmaceutico rispetto alla <strong>chimica</strong> (<strong>in</strong> term<strong>in</strong>i di quote di mercato mondiale). <strong>La</strong> bilancia commerciale è strutturalmente positiva, con un contributo particolarmente significativo da parte del settore farmaceutico. Tab. 2.14.1 – L’export e l’import della Svezia (<strong>in</strong> dollari statunitensi a prezzi correnti) 2000 2001 2002 2003 2004 2005 2006 2007 2008 2009 Chemicals Exports 7,83E+09 7,94E+09 8,7E+09 1,17E+10 13720408553 14628997884 1,7E+10 1,87E+10 2,01E+10 1,77E+10 Pharmaceuticals Exports 3,92E+09 4,16E+09 4,49E+09 6,59E+09 7203943981 7239857181 8,74E+09 8,7E+09 9,12E+09 8,93E+09 Chemicals Imports 6,61E+09 6,55E+09 6,94E+09 8,9E+09 10783806797 11927449918 1,33E+10 1,65E+10 1,88E+10 1,52E+10 Pharmaceuticals Imports 1,34E+09 1,44E+09 1,83E+09 2,21E+09 2486798866 2772481341 3,21E+09 3,64E+09 4,2E+09 4,07E+09 Fonte: Elaborazioni dell’autore su dati World Trade Organization Tab. 2.14.2 – <strong>La</strong> quota di mercato della Svezia sull’export mondiale 2000 2001 2002 2003 2004 2005 2006 2007 2008 2009 Chemicals 1,3 1,3 1,3 1,5 1,4 1,3 1,4 1,3 1,2 1,2 Pharmaceuticals 3,6 3,1 2,7 3,2 2,9 2,6 2,8 2,3 2,2 2,1 Fonte: Elaborazioni dell’autore su dati World Trade Organization Tab. 2.14.3 – <strong>La</strong> bilancia commerciale della Svezia 2000 2001 2002 2003 2004 2005 2006 2007 2008 2009 Saldo cumulato 2000-2009 Chemicals 1,23E+09 1,39E+09 1,76E+09 2,8E+09 2,9E+09 2,7E+09 3,66E+09 2,21E+09 1,24E+09 2,46E+09 22391773294 Pharmaceuticals 2,57E+09 2,72E+09 2,66E+09 4,37E+09 4,7E+09 4,47E+09 5,53E+09 5,07E+09 4,93E+09 4,85E+09 41892182932 Fonte: Elaborazioni dell’autore su dati World Trade Organization 33
- Page 2 and 3: Gruppo di lavoro Claudio Carnieri (
- Page 5 and 6: PRESENTAZIONE Claudio Carnieri - Ca
- Page 7: Di qui anche la fecondità dello sc
- Page 11 and 12: LA CHIMICA MONDIALE: FATTORI STRUTT
- Page 13 and 14: Tab. 1 - Il peso dell’industria m
- Page 15 and 16: Tab. 3 - La variazione della chimic
- Page 17 and 18: Al contrario, i Paesi che vantano u
- Page 19 and 20: del Belgio mentre valori relativame
- Page 21 and 22: contrae nella farmaceutica; comport
- Page 23 and 24: A questo fine, sono stati analizzat
- Page 25 and 26: Tab. 2.2.1 - L’export e l’impor
- Page 27 and 28: Tab. 2.4.2 - La quota di mercato de
- Page 29 and 30: Tab. 2.7.1 - L’export e l’impor
- Page 31: Tab. 2.10.1 - L’export e l’impo
- Page 35 and 36: Tab. 2.16.2 - La quota di mercato d
- Page 37: commerciale in negativo. Purtroppo,
- Page 40 and 41: Per comprendere fino in fondo quest
- Page 42 and 43: 42 Andamento del saldo commerciale
- Page 44 and 45: termini di flessibilità, creativit
- Page 46 and 47: of a Sustainable Future”, sottoli
- Page 48 and 49: 48 Distribuzione della produzione i
- Page 50 and 51: PMI: realtà importante in Europa e
- Page 52 and 53: 52 Imprese a capitale estero nella
- Page 54 and 55: 54 Micro-settori di specializzazion
- Page 56 and 57: La centralità di ricerca e innovaz
- Page 58 and 59: Tuttavia, solo nel 16% dei casi è
- Page 60 and 61: anno accoglie giovani tirocinanti l
- Page 62 and 63: ambientale in ambito comunitario (c
- Page 64 and 65: . Modalità di trasporto dei prodot
- Page 66 and 67: 4. Anche per la chimica assumerà i
- Page 69 and 70: NOTE PER UNA STORIA DELLA CHIMICA I
- Page 71 and 72: calcio, componente fondamentale del
- Page 73 and 74: Cautchouc, Guttaperga e Affini. Ent
- Page 75 and 76: punta della Banca Commerciale Itali
- Page 77 and 78: costituita nel 1898, di cui il prin
- Page 79 and 80: mescolato con resine, da cui deriva
- Page 81 and 82: tuttavia, non ha successo e il 31 m
- Page 83 and 84:
narnese e la sua controllata Elettr
- Page 85 and 86:
La chimica umbra tra guerra e dopog
- Page 87 and 88:
[…] la fiducia posta nell’espan
- Page 89 and 90:
dopoguerra “accusandola di non fo
- Page 91 and 92:
Il protagonismo della Terni non pot
- Page 93 and 94:
Tab. 2 - Addetti all’industrie ch
- Page 95 and 96:
sperimentando un processo che “pa
- Page 97 and 98:
Terni nel 1961 le imprese sono 11 e
- Page 99 and 100:
Sulla base di questo retroterra si
- Page 101 and 102:
situazione critica dell’Elettroca
- Page 103 and 104:
Più complessa ed emblematica è la
- Page 105 and 106:
questa una delle tante operazioni v
- Page 107 and 108:
LA CHIMICA IN UMBRIA: CONFRONTI STR
- Page 109 and 110:
I risultati dell’analisi empirica
- Page 111 and 112:
14,9 operano nel farmaceutico. La s
- Page 113 and 114:
La tabella 5 riporta un indice di d
- Page 115 and 116:
Tab. 6 - La dinamica delle imprese
- Page 117 and 118:
di avere valori inferiori del tasso
- Page 119 and 120:
Tab. 11 - La forma giuridica delle
- Page 121:
2001, contrariamente alla crescita,
- Page 125 and 126:
IL SETTORE ALLARGATO DELLA CHIMICA
- Page 127 and 128:
i quattro quinti del totale (Graf.
- Page 129 and 130:
Tab. 1 - La Chimica in Umbria: impr
- Page 131 and 132:
La Chimica fine e delle specialità
- Page 133 and 134:
L’ATTIVITÀ DELLE IMPRESE CENSITE
- Page 135 and 136:
I caratteri strutturali Due terzi d
- Page 137 and 138:
Le micro realtà sono prevalentemen
- Page 139 and 140:
Incrociando le variabili dimensiona
- Page 141 and 142:
Per apprezzare la struttura della c
- Page 143 and 144:
operai specializzati non figurano n
- Page 145 and 146:
totale degli addetti delle imprese
- Page 147 and 148:
Graf. 15 - Imprese innovative per m
- Page 149 and 150:
Graf. 18 - Fatturato medio, totale
- Page 151 and 152:
Graf. 20 - Funzione di ripartizione
- Page 153 and 154:
Le imprese che hanno indicato i mer
- Page 155 and 156:
La Chimica per il consumo e la Lavo
- Page 157 and 158:
Graf. 30 - Acquisti delle imprese c
- Page 159 and 160:
Si riscontra una certa tendenza all
- Page 161 and 162:
Le imprese che lavorano nella Chimi
- Page 163 and 164:
Graf. 39 - Imprese per mercati prev
- Page 165 and 166:
Graf. 41 - Composizione delle impre
- Page 167 and 168:
Si riscontra una marcata correlazio
- Page 169 and 170:
Graf. 47 - Distribuzione delle impr
- Page 171 and 172:
La rete delle interrelazioni aziend
- Page 173 and 174:
Gli scambi commerciali: più reti l
- Page 175 and 176:
tutte le realtà aperte all’ester
- Page 177:
Nota metodologica A marzo 2011 è s
- Page 180 and 181:
semplice ai decisori il processo di
- Page 182 and 183:
182 la qualità della visione stra
- Page 184 and 185:
Di seguito riportiamo l’elenco de
- Page 186 and 187:
186 quindi, comunque indotto dall
- Page 188 and 189:
mediazione politica, sono il risult
- Page 190 and 191:
concorrenza, soprattutto se le prop
- Page 192 and 193:
sanzioni sotto forma di concessione
- Page 194 and 195:
progettazione, messa a punto e test
- Page 196 and 197:
Il Presidente di Treofan ci spiegav
- Page 198 and 199:
materie prime (monomero), non avreb
- Page 200 and 201:
Nel momento in cui scriviamo regist
- Page 202 and 203:
mette in atto, quindi, una sorta di
- Page 204 and 205:
per una buona parte si lascia corre
- Page 206 and 207:
partner maggiore non è quello dell
- Page 208 and 209:
tra mondo della ricerca e mondo del
- Page 210 and 211:
funzione esecutiva, il cervello no,
- Page 212 and 213:
prodotti e/o servizi 2 ). Tali real
- Page 214 and 215:
potevano scaturire. È possibile af
- Page 216 and 217:
infatti, non essere in grado di for
- Page 218 and 219:
Una di queste, “Tecnotubi”, ha
- Page 220 and 221:
l’inizio di un declino che viene
- Page 222 and 223:
Il caso BRAI richiama l’interesse
- Page 224 and 225:
GDS (Sirci) e Riccini sono due impo
- Page 226 and 227:
Riccini. Nasce in questo modo il
- Page 228 and 229:
dove il Mater-Bi ha maggiori possib
- Page 230 and 231:
Tuttavia, il vero punto di forza di
- Page 232 and 233:
poiché si perde il controllo del m
- Page 235 and 236:
RICERCA, COMPETENZE, RELAZIONI SCIE
- Page 237 and 238:
Giangualberto Volpi, Gian Lorenzo M
- Page 239 and 240:
lungo per essere qui riportato, son
- Page 241 and 242:
selettiva. Di altrettanto grande in
- Page 243 and 244:
di sviluppi teorici e computazional
- Page 245 and 246:
CEMIN Il CEMIN è un centro di ecce
- Page 247 and 248:
Un’altra caratteristica dell’IS
- Page 249 and 250:
Le applicazioni attuali e potenzial
- Page 251 and 252:
NMR, Spettrometria UV-Vis, Spettrom
- Page 253 and 254:
SERVIZI TECNOLOGICI Sin dalla sua c
- Page 255 and 256:
Extraeuropee Tra le collaborazioni
- Page 257 and 258:
GOLPE (Generating Optimal Linear PL
- Page 259 and 260:
(CE) n. 1488/94 della Commissione,
- Page 261 and 262:
LA RICERCA IN CHIMICA FARMACEUTICA
- Page 263 and 264:
sintetiche, cruciali ed a volte dec
- Page 265 and 266:
Nel quadro dell’approccio multidi
- Page 267 and 268:
Modulatori delle vie eccitatorie de
- Page 269 and 270:
infezioni un tempo incurabili o fat
- Page 271 and 272:
è espressa in una fase precoce del
- Page 273 and 274:
futuro imminente il costo sanitario
- Page 275 and 276:
terapia: alcuni sono legati al farm
- Page 277 and 278:
una terapia inalatoria della TB anc
- Page 279 and 280:
state impiegate per migliorare la f
- Page 281 and 282:
il 2005 ed il 2015 (dati EUCHEMS, E
- Page 283 and 284:
LA CHIMICA, LA PRODUZIONE AGRARIA E
- Page 285 and 286:
fungicida prevalgano in maniera pre
- Page 287 and 288:
Tab. 3 - Prodotti fitosanitari dist
- Page 289 and 290:
LA RICERCA CHIMICA NELLA FACOLTÀ D
- Page 291 and 292:
L’attività scientifica e di rice
- Page 293 and 294:
molecole individuate, presenti in f
- Page 295 and 296:
pericolo, tanto nelle cellule anima
- Page 297 and 298:
ecuperare materia organica in agric
- Page 299 and 300:
distribuzione nel lungo periodo, mo
- Page 301 and 302:
prova effettuata con il Ni, evidenz
- Page 303 and 304:
Le attuali linee di ricerca nell’
- Page 305 and 306:
Brassicaceae allo scopo di individu
- Page 307 and 308:
Oltre che con prodotti di sintesi,
- Page 309 and 310:
d. La Sezione di Patologia Vegetale
- Page 311 and 312:
Agan) ed ha l’obiettivo di verifi
- Page 313 and 314:
edilizio, insieme ad Istituti di al
- Page 315 and 316:
diffusione, ne consegue che, rispet
- Page 317:
fenolici nell’olio vergine di oli
- Page 320 and 321:
Un ruolo fondamentale nel possibile
- Page 322 and 323:
totale. Le imprese biotecnologiche
- Page 324 and 325:
sviluppare propri piani strategici
- Page 326 and 327:
capacità innovative, tradizione, e
- Page 328 and 329:
tecniche di laboratorio e di proces
- Page 330 and 331:
settore del processo multidisciplin
- Page 332 and 333:
L'articolazione del corso di studio
- Page 334 and 335:
di introdurre prodotti sempre più
- Page 336 and 337:
La situazione sopra illustrata è p
- Page 338 and 339:
come induttore della tolleranza imm
- Page 340 and 341:
- Ricerca e sviluppo di vaccini e c
- Page 342 and 343:
malattie infettive. All’interno d
- Page 344 and 345:
cellule si ottengono facilmente da
- Page 346 and 347:
permetterà in questo modo un trasf
- Page 348 and 349:
- Sviluppo di analisi mutazionali
- Page 350 and 351:
- Il settore veterinario il quale s
- Page 352 and 353:
Un altro progetto europeo viene svo
- Page 354 and 355:
Le competenze del gruppo sono anche
- Page 356 and 357:
Sono circa 15 anni che i ricercator
- Page 358 and 359:
genomiche, il clonaggio dei geni re
- Page 360 and 361:
per il calcolo delle parentele geno
- Page 362 and 363:
e) Realizzazione di software per la
- Page 364 and 365:
esponsabili dell’adattamento del
- Page 366 and 367:
- Toxoplasmosi umana e rischio sani
- Page 368 and 369:
Da un punto di vista funzionale e m
- Page 370 and 371:
eritrociti bovini attraverso un pro
- Page 372 and 373:
patologie allergiche e, non ultimo,
- Page 374 and 375:
La metabolomica è definita come lo
- Page 376 and 377:
Modelli Matematici di Epidemie: la
- Page 378 and 379:
o usi biologici e biochimici e spes
- Page 380 and 381:
- Nanoparticelle colloidali: nanopa
- Page 382 and 383:
Risonanza Plasmonica di Superficie
- Page 384 and 385:
settori della genomica, genetica e
- Page 386 and 387:
il centro potrà attrarre sul terri
- Page 388 and 389:
puliti e altro ancora. La conoscenz
- Page 390 and 391:
Il CERB è l’unico Centro di Ecce
- Page 392 and 393:
Biomasse a fini energetici, svilupp
- Page 394 and 395:
- Proseguire e promuovere la raccol
- Page 396 and 397:
- preparazione Acidi nucleici per a
- Page 398 and 399:
Elenco dal 2006: principali italian
- Page 400 and 401:
cosidette “white” che prometton
- Page 403:
CONCLUSIONI
- Page 406 and 407:
Tuttavia sono in corso grandi trasf
- Page 408 and 409:
408 sono rarissime le pratiche di
- Page 410 and 411:
Per intercettare questa nuova onda
- Page 412 and 413:
C.1 Relazioni imprese - università
- Page 414:
aziende, quasi tutte di micro-dimen


