VAS – Rapporto Ambientale - Comune di Marano Vicentino
VAS – Rapporto Ambientale - Comune di Marano Vicentino
VAS – Rapporto Ambientale - Comune di Marano Vicentino

You also want an ePaper? Increase the reach of your titles
YUMPU automatically turns print PDFs into web optimized ePapers that Google loves.
. <strong>Comune</strong> <strong>di</strong> <strong>Marano</strong> <strong>Vicentino</strong><br />
P.A.T. <strong>–</strong> V.A.S. <strong>–</strong> <strong>Rapporto</strong> <strong>Ambientale</strong><br />
2011<br />
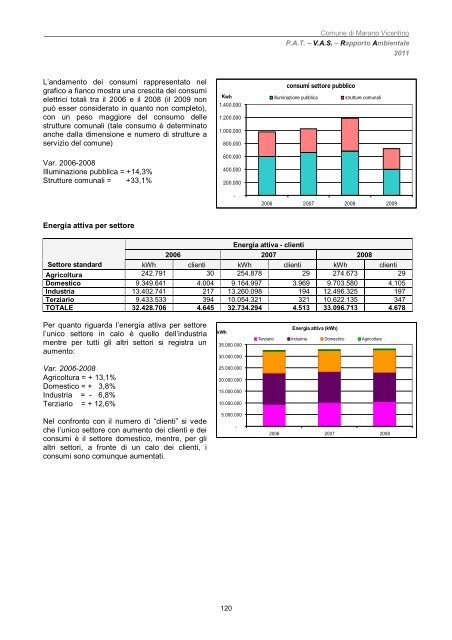
L’andamento dei consumi rappresentato nel<br />
grafico a fianco mostra una crescita dei consumi<br />
elettrici totali tra il 2006 e il 2008 (il 2009 non<br />
può esser considerato in quanto non completo),<br />
con un peso maggiore del consumo delle<br />
strutture comunali (tale consumo è determinato<br />
anche dalla <strong>di</strong>mensione e numero <strong>di</strong> strutture a<br />
servizio del comune)<br />
Var. 2006-2008<br />
Illuminazione pubblica = +14,3%<br />
Strutture comunali = +33,1%<br />
Energia attiva per settore<br />
1.400.000<br />
1.200.000<br />
1.000.000<br />
800.000<br />
600.000<br />
400.000<br />
200.000<br />
120<br />
-<br />
consumi settore pubblico<br />
Kwh illuminazione pubblica strutture comunali<br />
2006 2007 2008 2009<br />
Energia attiva - clienti<br />
2006 2007 2008<br />
Settore standard kWh clienti kWh clienti kWh clienti<br />
Agricoltura 242.791 30 254.878 29 274.673 29<br />
Domestico 9.349.641 4.004 9.164.997 3.969 9.703.580 4.105<br />
Industria 13.402.741 217 13.260.098 194 12.496.325 197<br />
Terziario 9.433.533 394 10.054.321 321 10.622.135 347<br />
TOTALE 32.428.706 4.645 32.734.294 4.513 33.096.713 4.678<br />
Per quanto riguarda l’energia attiva per settore<br />
l’unico settore in calo è quello dell’industria<br />
mentre per tutti gli altri settori si registra un<br />
aumento:<br />
Var. 2006-2008<br />
Agricoltura = + 13,1%<br />
Domestico = + 3,8%<br />
Industria = - 6,8%<br />
Terziario = + 12,6%<br />
Nel confronto con il numero <strong>di</strong> “clienti” si vede<br />
che l’unico settore con aumento dei clienti e dei<br />
consumi è il settore domestico, mentre, per gli<br />
altri settori, a fronte <strong>di</strong> un calo dei clienti, i<br />
consumi sono comunque aumentati.<br />
kWh<br />
35.000.000<br />
30.000.000<br />
25.000.000<br />
20.000.000<br />
15.000.000<br />
10.000.000<br />
5.000.000<br />
-<br />
Energia attiva (kWh)<br />
Terziario Industria Domestico Agricoltura<br />
2006 2007 2008