
Create successful ePaper yourself
Turn your PDF publications into a flip-book with our unique Google optimized e-Paper software.
9. CALCULATION OF RESULTS<br />
Calculate Calibrator and Sample counts per minute (cpm) or their percent binding:<br />
Solid phase cpm<br />
B/T % = ------------------------- x 100<br />
Total activity cpm<br />
Draw a calibration curve on semi-log graph paper by plotting the cpm or percent<br />
binding (B/T)% of each Calibrator (y-axis) against the relative concentration (xaxis).<br />
Consider the Zero Calibrator as the first concentration of the calibration<br />
curve. Read the sample concentration by interpolatig the counts or percent<br />
binding on the calibration curve.<br />
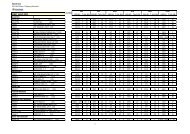
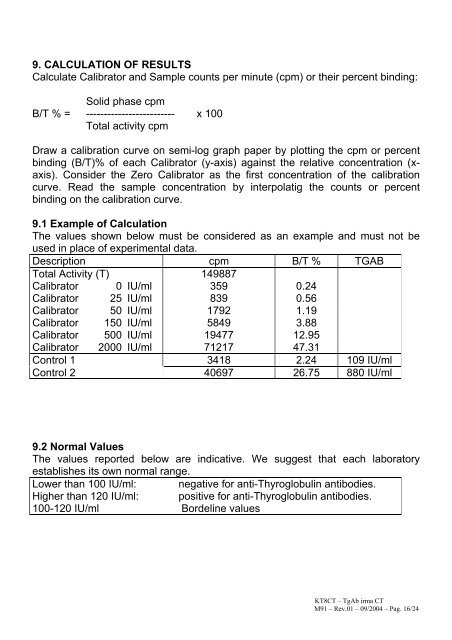
9.1 Example of Calculation<br />
The values shown below must be considered as an example and must not be<br />
used in place of experimental data.<br />
Description cpm B/T % TGAB<br />
Total Activity (T) 149887<br />
Calibrator 0 IU/ml 359 0.24<br />
Calibrator 25 IU/ml 839 0.56<br />
Calibrator 50 IU/ml 1792 1.19<br />
Calibrator 150 IU/ml 5849 3.88<br />
Calibrator 500 IU/ml 19477 12.95<br />
Calibrator 2000 IU/ml 71217 47.31<br />
Control 1 3418 2.24 109 IU/ml<br />
Control 2 40697 26.75 880 IU/ml<br />
9.2 Normal Values<br />
The values reported below are indicative. We suggest that each laboratory<br />
establishes its own normal range.<br />
Lower than 100 IU/ml: negative for anti-Thyroglobulin antibodies.<br />
Higher than 120 IU/ml: positive for anti-Thyroglobulin antibodies.<br />
100-120 IU/ml Bordeline values<br />
KT8<strong>CT</strong> – <strong>TgAb</strong> irma <strong>CT</strong><br />
M91 – Rev.01 – 09/2004 – Pag. 16/24