- Page 1 and 2:
saqarTvelos ekonomikuri ganviTarebi
- Page 3 and 4:
winasityvaobawinamdebare statistiku
- Page 5 and 6:
50685
- Page 7 and 8:
sarCeviCONTENTSzogadi mimoxilvaGENE
- Page 9 and 10:
zogadi mimoxilvaGENERAL INFORMATION
- Page 11 and 12: zogadi mimoxilva — GENERAL INFORM
- Page 13 and 14: zogadi mimoxilva — GENERAL INFORM
- Page 15 and 16: mosaxleobaPOPULATION2
- Page 17 and 18: mosaxleoba — POPULATIONmosaxleobi
- Page 19 and 20: 2.2. mamakacebisa da qalebis ricxov
- Page 21 and 22: 2.3. mosaxleobis ricxovnoba sqesisa
- Page 23 and 24: 2.5. qorwinebebi da ganqorwinebebiw
- Page 25 and 26: 2.7. daqorwinebulTa ricxvi qorwineb
- Page 27 and 28: mosaxleoba — POPULATION2.9. regis
- Page 29 and 30: mosaxleoba — POPULATION2.11. cocx
- Page 31 and 32: 2.13. gardacvlilTa ricxovnoba garda
- Page 33 and 34: 2.13. gardacvlilTa ricxovnoba garda
- Page 35 and 36: 2.15. sicocxlis mosalodneli xangrZl
- Page 37: 2.17. qalaqebis mosaxleobis ricxovn
- Page 40 and 41: Sromis bazari — LABOUR MARKET3.1.
- Page 42 and 43: Sromis bazari — LABOUR MARKET3200
- Page 44 and 45: Sromis bazari — LABOUR MARKET3.2.
- Page 46 and 47: 3Sromis bazari — LABOUR MARKET3.4
- Page 48 and 49: Sromis bazari — LABOUR MARKET3.5.
- Page 50 and 51: Sromis bazari — LABOUR MARKET33.7
- Page 52 and 53: Sromis bazari — LABOUR MARKET33.1
- Page 54 and 55: Sromis bazari — LABOUR MARKET33.1
- Page 56 and 57: Sromis bazari — LABOUR MARKET3.14
- Page 58 and 59: Sinameurneobebis Semosavlebi, xarje
- Page 60 and 61: Sinameurneobebis Semosavlebi, xarje
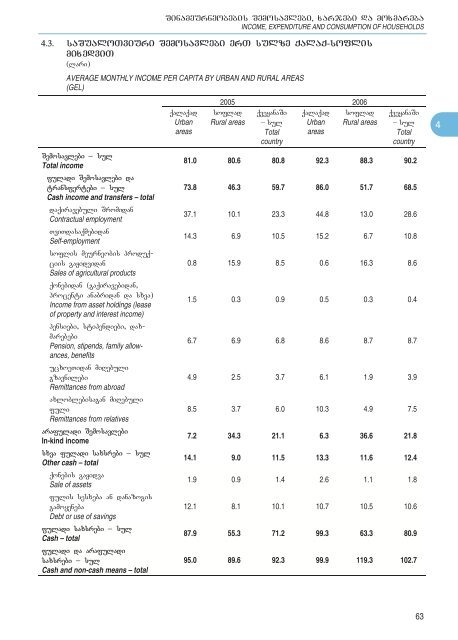
- Page 64 and 65: Sinameurneobebis Semosavlebi, xarje
- Page 66 and 67: 4Sinameurneobebis Semosavlebi, xarj
- Page 68 and 69: 4Sinameurneobebis Semosavlebi, xarj
- Page 70 and 71: Sinameurneobebis Semosavlebi, xarje
- Page 73 and 74: ganaTleba, mecniereba, kulturaEDUCA
- Page 75 and 76: ganaTleba, mecniereba, kultura —
- Page 77 and 78: ganaTleba, mecniereba, kultura —
- Page 79 and 80: arasaxelmwifo saeroumaRlesi saswavl
- Page 81 and 82: ganaTleba, mecniereba, kultura —
- Page 83 and 84: 5.8. moswavleTa ganTesvaPUPILS’ D
- Page 85 and 86: ganaTleba, mecniereba, kultura —
- Page 87 and 88: ganaTleba, mecniereba, kultura —
- Page 89 and 90: ganaTleba, mecniereba, kultura —
- Page 91 and 92: ganaTleba, mecniereba, kultura —
- Page 93 and 94: 5.21. samecniero-teqnikuri samuSaoe
- Page 95 and 96: 5.23. muzeumebiMUSEUMSganaTleba, me
- Page 97 and 98: janmrTelobis dacva dasocialuri uzru
- Page 99 and 100: janmrTelobis dacva da socialuri uzr
- Page 101 and 102: janmrTelobis dacva da socialuri uzr
- Page 103 and 104: janmrTelobis dacva da socialuri uzr
- Page 105 and 106: janmrTelobis dacva da socialuri uzr
- Page 107 and 108: janmrTelobis dacva da socialuri uzr
- Page 109 and 110: janmrTelobis dacva da socialuri uzr
- Page 111 and 112: samarTaldarRvevebiCRIMES7
- Page 113 and 114:
samarTaldarRvevebi — CRIMESregist
- Page 115 and 116:
samarTaldarRvevebi — CRIMES7.2. m
- Page 117 and 118:
samarTaldarRvevebi — CRIMES7.5. a
- Page 119 and 120:
unebrivi resursebida garemos dacvaN
- Page 121 and 122:
unebrivi resursebi da garemos dacva
- Page 123 and 124:
unebrivi resursebi da garemos dacva
- Page 125 and 126:
unebrivi resursebi da garemos dacva
- Page 127 and 128:
erovnuli angariSebiNATIONAL ACCOUNT
- Page 129 and 130:
erovnuli angariSebi — NATIONAL AC
- Page 131 and 132:
erovnuli angariSebi — NATIONAL AC
- Page 133 and 134:
erovnuli angariSebi — NATIONAL AC
- Page 135 and 136:
erovnuli angariSebi — NATIONAL AC
- Page 137 and 138:
erovnuli angariSebi — NATIONAL AC
- Page 139 and 140:
erovnuli angariSebi — NATIONAL AC
- Page 141 and 142:
erovnuli angariSebi — NATIONAL AC
- Page 143 and 144:
erovnuli angariSebi — NATIONAL AC
- Page 145 and 146:
erovnuli angariSebi — NATIONAL AC
- Page 147 and 148:
saxelmwifo qonebisprivatizebaPRIVAT
- Page 149 and 150:
saxelmwifo qonebis privatizeba —
- Page 151 and 152:
samewarmeo saqmianobaENTREPRENEURIA
- Page 153 and 154:
samewarmeo saqmianoba — ENTREPREN
- Page 155 and 156:
samewarmeo saqmianoba — ENTREPREN
- Page 157 and 158:
samewarmeo saqmianoba — ENTREPREN
- Page 159 and 160:
samewarmeo saqmianoba — ENTREPREN
- Page 161 and 162:
samewarmeo saqmianoba — ENTREPREN
- Page 163 and 164:
mrewvelobaINDUSTRY12
- Page 165 and 166:
mrewveloba — INDUSTRYwarmoebuli s
- Page 167 and 168:
mrewveloba — INDUSTRY12.1. sawarm
- Page 169 and 170:
mrewveloba — INDUSTRY12.2. dasaqm
- Page 171 and 172:
mrewveloba — INDUSTRY12.3. samrew
- Page 173 and 174:
mrewveloba — INDUSTRY12.4. calkeu
- Page 175 and 176:
mrewveloba — INDUSTRY12.6. mrewve
- Page 177 and 178:
mrewveloba — INDUSTRY12.7. mrewve
- Page 179:
mrewveloba — INDUSTRY12.7. mrewve
- Page 182 and 183:
soflis meurneoba — AGRICULTURE13.
- Page 184 and 185:
soflis meurneoba — AGRICULTUREsas
- Page 186 and 187:
soflis meurneoba — AGRICULTURE13.
- Page 188 and 189:
13soflis meurneoba — AGRICULTURE1
- Page 190 and 191:
soflis meurneoba — AGRICULTURE13.
- Page 192 and 193:
13soflis meurneoba — AGRICULTURE1
- Page 194 and 195:
soflis meurneoba — AGRICULTURE13.
- Page 196 and 197:
soflis meurneoba — AGRICULTURE13.
- Page 198 and 199:
soflis meurneoba — AGRICULTURE13.
- Page 201 and 202:
investiciebi arafinansur aqtivebSiI
- Page 203 and 204:
investiciebi arafinansur aqtivebSi
- Page 205 and 206:
investiciebi arafinansur aqtivebSi
- Page 207:
14.5. mTliani dagroveba(mln. lari)G
- Page 210 and 211:
samSeneblo saqmianoba — CONSTRUCT
- Page 212 and 213:
samSeneblo saqmianoba — CONSTRUCT
- Page 214 and 215:
samSeneblo saqmianoba — CONSTRUCT
- Page 216 and 217:
samSeneblo saqmianoba — CONSTRUCT
- Page 219 and 220:
transporti da kavSirgabmulobaTRANSP
- Page 221 and 222:
transporti da kavSirgabmuloba — T
- Page 223 and 224:
transporti da kavSirgabmuloba — T
- Page 225 and 226:
transporti da kavSirgabmuloba — T
- Page 227:
16.9. avtosagzao SemTxvevebiTRAFFIC
- Page 230 and 231:
sacalo vaWroba — RETAIL TRADE17.1
- Page 232 and 233:
sacalo vaWroba — RETAIL TRADE17.1
- Page 234 and 235:
17sacalo vaWroba — RETAIL TRADE17
- Page 237 and 238:
sastumroebi darestornebiHOTELS ANDR
- Page 239 and 240:
sastumroebi da restornebi — HOTEL
- Page 241 and 242:
sastumroebi da restornebi — HOTEL
- Page 243 and 244:
18.6. stumrebis ganawileba qveynebi
- Page 245 and 246:
saxelmwifo finansebi dafulad-sakred
- Page 247 and 248:
saxelmwifo finansebi da fulad-sakre
- Page 249 and 250:
saxelmwifo finansebi da fulad-sakre
- Page 251 and 252:
saxelmwifo finansebi da fulad-sakre
- Page 253 and 254:
19.2.1. Sida kreditebis struqtura(w
- Page 255 and 256:
19.2.4. fulis masa agregatebis mixe
- Page 257 and 258:
saxelmwifo finansebi da fulad-sakre
- Page 259 and 260:
fasebiPRICES20
- Page 261 and 262:
fasebi — PRICESganyofileba Seicav
- Page 263 and 264:
fasebi — PRICES20.3. samomxmarebl
- Page 265 and 266:
fasebi — PRICES20.6. samomxmarebl
- Page 267:
20.7. samrewvelo produqciis mwarmoe
- Page 270 and 271:
sagareo ekonomikuri urTierTobebi
- Page 272 and 273:
21sagareo ekonomikuri urTierTobebi
- Page 274 and 275:
sagareo ekonomikuri urTierTobebi
- Page 276 and 277:
sagareo ekonomikuri urTierTobebi
- Page 278 and 279:
21sagareo ekonomikuri urTierTobebi
- Page 280 and 281:
sagareo ekonomikuri urTierTobebi
- Page 282 and 283:
sagareo ekonomikuri urTierTobebi
- Page 284 and 285:
sagareo ekonomikuri urTierTobebi
- Page 286 and 287:
sagareo ekonomikuri urTierTobebi
- Page 288 and 289:
sagareo ekonomikuri urTierTobebi
- Page 290 and 291:
sagareo ekonomikuri urTierTobebi
- Page 292 and 293:
sagareo ekonomikuri urTierTobebi
- Page 295 and 296:
sawarmoTa da organizaciaTaerTiani s
- Page 297 and 298:
sawarmoTa da organizaciaTa erTiani
- Page 299 and 300:
sawarmoTa da organizaciaTa erTiani
- Page 301 and 302:
sawarmoTa da organizaciaTa erTiani
- Page 303 and 304:
saerTaSoriso SedarebebiINTERNATIONA
- Page 305 and 306:
saerTaSoriso Sedarebebi — INTERNA
- Page 307 and 308:
saerTaSoriso Sedarebebi — INTERNA
- Page 309 and 310:
saerTaSoriso Sedarebebi — INTERNA
- Page 311 and 312:
saerTaSoriso Sedarebebi — INTERNA
- Page 313 and 314:
saerTaSoriso Sedarebebi — INTERNA
- Page 315 and 316:
saerTaSoriso Sedarebebi — INTERNA
- Page 317 and 318:
saerTaSoriso Sedarebebi — INTERNA
- Page 319 and 320:
saerTaSoriso Sedarebebi — INTERNA
- Page 321 and 322:
saerTaSoriso Sedarebebi — INTERNA
- Page 323 and 324:
saerTaSoriso Sedarebebi — INTERNA
- Page 325 and 326:
saerTaSoriso Sedarebebi — INTERNA
- Page 327 and 328:
saerTaSoriso Sedarebebi — INTERNA