
Create successful ePaper yourself
Turn your PDF publications into a flip-book with our unique Google optimized e-Paper software.
Defining the spatial analysis<br />
methods:<br />
IDW - assumes that each input point<br />
has a local influence that diminishes<br />
with distance.<br />
Spline - an interpolation method that<br />
fits a minimum curvature surface<br />
through the input points.<br />
Kriging - a method of interpolation<br />
that predicts unknown values from<br />
data observed at known locations<br />
using procedures that include<br />
weighting from distant points.<br />
Theissen polygons - constructed<br />
using geometric techniques to create<br />
polygons having the same value as<br />
the original data point, i.e. the measured<br />
point value is converted to a surface<br />
area that the point measurement<br />
represents.<br />
The first point to note is the differences<br />
in the images produced. (Figure 1) Each<br />
analysis method produces different<br />
images! This raises the question: Which<br />
is the correct image? To answer this, a<br />
comparison of the actual measured values<br />
to the method predictions was<br />
done along a line indicated by the<br />
arrows in Figure 1. The results of this<br />
comparison are presented in Figure 2.<br />
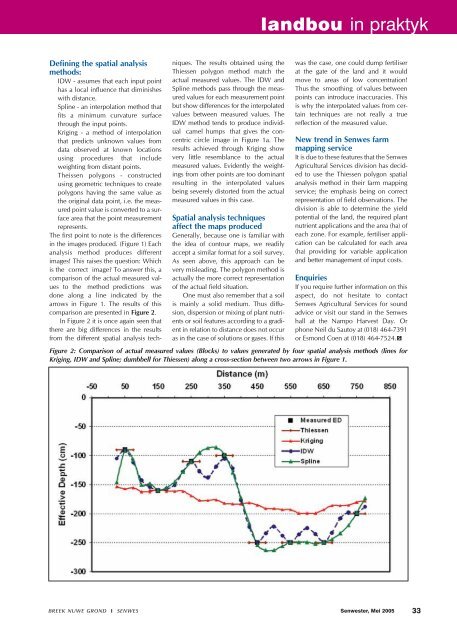
In Figure 2 it is once again seen that<br />
there are big differences in the results<br />
from the different spatial analysis tech-<br />
niques. The results obtained using the<br />
Thiessen polygon method match the<br />
actual measured values. The IDW and<br />
Spline methods pass through the measured<br />
values for each measurement point<br />
but show differences for the interpolated<br />
values between measured values. The<br />
IDW method tends to produce individual<br />
camel humps that gives the concentric<br />
circle image in Figure 1a. The<br />
results achieved through Kriging show<br />
very little resemblance to the actual<br />
measured values. Evidently the weightings<br />
from other points are too dominant<br />
resulting in the interpolated values<br />
being severely distorted from the actual<br />
measured values in this case.<br />
Spatial analysis techniques<br />
affect the maps produced<br />
Generally, because one is familiar with<br />
the idea of contour maps, we readily<br />
accept a similar format for a soil survey.<br />
As seen above, this approach can be<br />
very misleading. The polygon method is<br />
actually the more correct representation<br />
of the actual field situation.<br />
One must also remember that a soil<br />
is mainly a solid medium. Thus diffusion,<br />
dispersion or mixing of plant nutrients<br />
or soil features according to a gradient<br />
in relation to distance does not occur<br />
as in the case of solutions or gases. If this<br />
landbou in praktyk<br />
was the case, one could dump fertiliser<br />
at the gate of the land and it would<br />
move to areas of low concentration!<br />
Thus the smoothing of values between<br />
points can introduce inaccuracies. This<br />
is why the interpolated values from certain<br />
techniques are not really a true<br />
reflection of the measured value.<br />
New trend in Senwes farm<br />
mapping service<br />
It is due to these features that the Senwes<br />
Agricultural Services division has decided<br />
to use the Thiessen polygon spatial<br />
analysis method in their farm mapping<br />
service; the emphasis being on correct<br />
representation of field observations. The<br />
division is able to determine the yield<br />
potential of the land, the required plant<br />
nutrient applications and the area (ha) of<br />
each zone. For example, fertiliser application<br />
can be calculated for each area<br />
(ha) providing for variable application<br />
and better management of input costs.<br />
Enquiries<br />
If you require further information on this<br />
aspect, do not hesitate to contact<br />
Senwes Agricultural Services for sound<br />
advice or visit our stand in the Senwes<br />
hall at the Nampo Harvest Day. Or<br />
phone Neil du Sautoy at (018) 464-7391<br />
or Esmond Coen at (018) 464-7524.<br />
Figure 2: Comparison of actual measured values (Blocks) to values generated by four spatial analysis methods (lines for<br />
Kriging, IDW and Spline; dumbbell for Thiessen) along a cross-section between two arrows in Figure 1.<br />
Senwester, Mei 2005<br />
33