Revista de - Ministério da Agricultura
Revista de - Ministério da Agricultura
Revista de - Ministério da Agricultura

You also want an ePaper? Increase the reach of your titles
YUMPU automatically turns print PDFs into web optimized ePapers that Google loves.
ganharem mais do que empregados não se <strong>de</strong>ve<br />
apenas à sua maior escolari<strong>da</strong><strong>de</strong> média. 11<br />
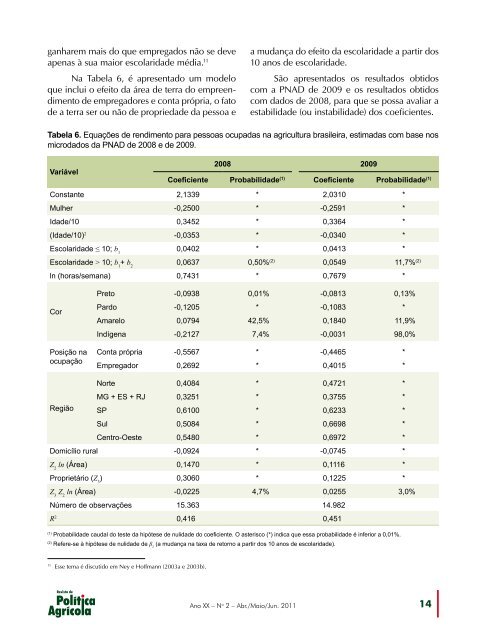
Na Tabela 6, é apresentado um mo<strong>de</strong>lo<br />
que inclui o efeito <strong>da</strong> área <strong>de</strong> terra do empreendimento<br />
<strong>de</strong> empregadores e conta própria, o fato<br />
<strong>de</strong> a terra ser ou não <strong>de</strong> proprie<strong>da</strong><strong>de</strong> <strong>da</strong> pessoa e<br />
Ano XX – N o 2 – Abr./Maio/Jun. 2011<br />
a mu<strong>da</strong>nça do efeito <strong>da</strong> escolari<strong>da</strong><strong>de</strong> a partir dos<br />
10 anos <strong>de</strong> escolari<strong>da</strong><strong>de</strong>.<br />
São apresentados os resultados obtidos<br />
com a PNAD <strong>de</strong> 2009 e os resultados obtidos<br />
com <strong>da</strong>dos <strong>de</strong> 2008, para que se possa avaliar a<br />
estabili<strong>da</strong><strong>de</strong> (ou instabili<strong>da</strong><strong>de</strong>) dos coeficientes.<br />
Tabela 6. Equações <strong>de</strong> rendimento para pessoas ocupa<strong>da</strong>s na agricultura brasileira, estima<strong>da</strong>s com base nos<br />
micro<strong>da</strong>dos <strong>da</strong> PNAD <strong>de</strong> 2008 e <strong>de</strong> 2009.<br />
Variável<br />
2008 2009<br />
Coeficiente Probabili<strong>da</strong><strong>de</strong> (1) Coeficiente Probabili<strong>da</strong><strong>de</strong> (1)<br />
Constante 2,1339 * 2,0310 *<br />
Mulher -0,2500 * -0,2591 *<br />
I<strong>da</strong><strong>de</strong>/10 0,3452 * 0,3364 *<br />
(I<strong>da</strong><strong>de</strong>/10) 2 -0,0353 * -0,0340 *<br />
Escolari<strong>da</strong><strong>de</strong> ≤ 10; b 1 0,0402 * 0,0413 *<br />
Escolari<strong>da</strong><strong>de</strong> > 10; b 1 + b 2 0,0637 0,50% (2) 0,0549 11,7% (2)<br />
ln (horas/semana) 0,7431 * 0,7679 *<br />
Cor<br />
Posição na<br />
ocupação<br />
Região<br />
Preto -0,0938 0,01% -0,0813 0,13%<br />
Pardo -0,1205 * -0,1083 *<br />
Amarelo 0,0794 42,5% 0,1840 11,9%<br />
Indígena -0,2127 7,4% -0,0031 98,0%<br />
Conta própria -0,5567 * -0,4465 *<br />
Empregador 0,2692 * 0,4015 *<br />
Norte 0,4084 * 0,4721 *<br />
MG + ES + RJ 0,3251 * 0,3755 *<br />
SP 0,6100 * 0,6233 *<br />
Sul 0,5084 * 0,6698 *<br />
Centro-Oeste 0,5480 * 0,6972 *<br />
Domicílio rural -0,0924 * -0,0745 *<br />
Z 2 ln (Área) 0,1470 * 0,1116 *<br />
Proprietário (Z 3 ) 0,3060 * 0,1225 *<br />
Z 3 Z 2 ln (Área) -0,0225 4,7% 0,0255 3,0%<br />
Número <strong>de</strong> observações 15.363 14.982<br />
R 2 0,416 0,451<br />
(1) Probabili<strong>da</strong><strong>de</strong> cau<strong>da</strong>l do teste <strong>da</strong> hipótese <strong>de</strong> nuli<strong>da</strong><strong>de</strong> do coeficiente. O asterisco (*) indica que essa probabili<strong>da</strong><strong>de</strong> é inferior a 0,01%.<br />
(2) Refere-se à hipótese <strong>de</strong> nuli<strong>da</strong><strong>de</strong> <strong>de</strong> β2 (a mu<strong>da</strong>nça na taxa <strong>de</strong> retorno a partir dos 10 anos <strong>de</strong> escolari<strong>da</strong><strong>de</strong>).<br />
11 Esse tema é discutido em Ney e Hoffmann (2003a e 2003b).<br />
14