92 b) 2* Distribuição . Faixa I (20 aR < X S 80 aR) NÚMERO DO SUPORTE 218 278 039 093 147 213 095 026 EXPOSIÇÃO TLD (y) AG 57 57 60 60 71 71 71 77 (mR) (x) 40 60 30 20 50 30 30 60 Z =x/y 0,70 1,05 0,50 0,33 0,70 0,42 0,42 0,78 Faixa II (80 mR < X á 300 mR) NÚMERO DO SUPORTE 157 001 143 148 155 053 121 160 091 169 035 046 124 279 074 265 098 EXPOSI( :AO (mR) TLD (y) AG (x) 85 88 90 93 97 97 99 102 105 128 135 140 142 145 155 157 158 60 100 70 80 90 90 60 90 90 120 110 130 130 150 130 190 130 Z = x/y 0,71 1,14 0,78 0,86 0,93 0,93 0,61 0,88 0,86 0,94 0,81 0,93 0,92 1,03 0,84 1,21 0,82
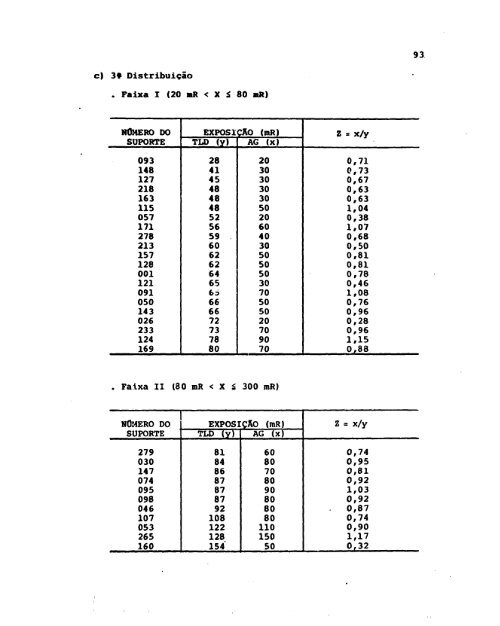
93 c) 3* Distribuição . Faixa I (20 mR < X S 80 mR) NUMERO DO SUPORTE 093 148 127 218 163 115 057 171 278 213 157 128 001 121 091 050 143 026 233 124 169 EXPOSIÇÃO TLD (y) AG (mR) (X) 28 41 45 48 48 48 52 56 59 60 62 62 64 65 65 66 66 72 73 78 80 20 30 30 30 30 50 20 60 40 30 50 50 50 30 70 50 50 20 70 90 70 Z = x/y 0,71 0,73 0,67 0,63 0,63 1,04 0,38 1,07 0,68 0,50 0,81 0,81 0,78 0,46 1,08 0,76 0,96 0,28 0,96 1,15 0,88 Faixa II (80 mR < X S 300 mR) NÚMERO DO SUPORTE 279 030 147 074 095 098 046 107 053 265 160 EXPOSIÇÃO (mR) TLD (y) AG (x) 81 84 86 87 87 87 92 108 122 128 154 Z = x/y 0,74 0,95 0,81 0,92 1,03 0,92 . 0,87 0,74 0,90 1,17 50 0,32 60 80 70 80 90 80 80 80 110 150
- Page 1 and 2:
UNIVERSIDADE FEDERAL DE MINAS GERAI
- Page 3 and 4:
CURSO DE POS-GRADUAÇAO EM CIÊNCIA
- Page 5 and 6:
Este trabalho foi realizado nas ins
- Page 7 and 8:
AGRADECIMENTOS Ao Eng9 Maurício Me
- Page 9 and 10:
ABSTRACT A quality control systemat
- Page 11 and 12:
5. CONCLUSÕES 102 APÊNDICE I - Ta
- Page 13 and 14:
químicas, fração defeituosa etc)
- Page 15 and 16:
adequação de tais medidas. 1.2 Ga
- Page 17 and 18:
10 cas e odontolõgicas, instituiç
- Page 19 and 20:
12 CNEN. Ela resultou, na realidade
- Page 21 and 22:
14 "International Commission on Rad
- Page 23 and 24:
16 citação e ionização de átom
- Page 25 and 26:
At Si No Sistema Internacional de U
- Page 27 and 28:
20 Sejam: An = número total de par
- Page 29 and 30:
22 Em unidades especiais , obtém-s
- Page 31 and 32:
24 mais órgãos ou tecidos, a dose
- Page 33 and 34:
(iii) para limitação da ocorrênc
- Page 35 and 36:
ção, constituem a imagem latente.
- Page 37 and 38:
30 Um outro problema associado à d
- Page 39 and 40:
Tabela 2.2 - Características dos P
- Page 41 and 42:
34 Supondo que o dosímetro seja su
- Page 43 and 44:
36 me importado KODAK PATHÊ,tipo 1
- Page 45 and 46:
38 A avaliação da energia efetiva
- Page 47 and 48:
tiquetas de endereço da entidade s
- Page 49 and 50: IMS s K MMSS1 41 c»>s*«o IMS mour
- Page 51 and 52: I*. CtttlltSo st. f «viti» MO- J
- Page 53 and 54: 45 ficações atende ao propósito
- Page 55 and 56: 47 mento dos doslmetros pode ser co
- Page 57 and 58: 49 assim especificados: - Gráfico
- Page 59 and 60: 51 LIC s po - 1,5 5 0 = X - 0,729 R
- Page 61 and 62: 53 aumento da dispersão, mantendo-
- Page 63 and 64: 55 a) Variável de controle Z = x/y
- Page 65 and 66: 57 fora da faixa de controle (LIC,
- Page 67 and 68: 59 4. RESULTADOS EXPERIMENTAIS 4.1
- Page 69 and 70: 61 FIG. 4.1 - ARRANJO UTILIZADO PAR
- Page 71 and 72: 63 das diversas unidades do Grupo N
- Page 73 and 74: Tabela 4.3 - Resultados de Densidad
- Page 75 and 76: 67 Tabela 4.5 - Resultados de Corre
- Page 77 and 78: GRAFICO DA MÉDIA 0,24 LSC's J+1,5
- Page 79 and 80: ft' GRÁFICO DA MÉDIA 0,80 © o o
- Page 81 and 82: X' 0,40 GRAFICO DA MEDIA 0,38 | 0,3
- Page 83 and 84: 75 Assim, para que o processo de me
- Page 85 and 86: 77 O desvio padrão calculado coin
- Page 87 and 88: 79 Pelo gráfico da amplitude, obse
- Page 89 and 90: 81 B 1 = 25- = 2 ' " *" :i " 5)2 24
- Page 91 and 92: Tabela 4.7 - Resultados Obtidos par
- Page 93 and 94: 85 c) Faixa III (300 mR < X á 800
- Page 95 and 96: Tabela 4.8 - Intercomparaçao de Re
- Page 97 and 98: 89 c) 39 Distribuição . Faixa I (
- Page 99: 91 Tabela 4.9 - Intercomparaçao de
- Page 103 and 104: w w u u u • • (MM I (toou < X
- Page 105 and 106: 97 b) Faixa II (80 mR < X á 300 mR
- Page 107 and 108: CONVENÇlO I» O O . PMXA I (2OmR
- Page 109 and 110: 101 com relação às medidas por T
- Page 111 and 112: 103 persão das médias, é também
- Page 113 and 114: Tabela I.I - Fatores para Cálculo
- Page 115 and 116: APÊNDICE II - Formulário para Col
- Page 117 and 118: 109 REFERÊNCIAS BIBLIOGRÁFICAS 11
- Page 119 and 120: Ill BIBLIOGRAFIA ADICIONAL ATTIX, F
- Page 121 and 122: 113 INTERNATIONAL COMMISSION ON RAD