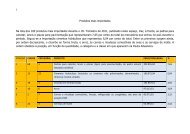
O Porto <strong>de</strong> Luanda registou, durante o I trimestre<strong>de</strong>ste ano, uma redução <strong>de</strong> 5,14 por cento na entrada<strong>de</strong> contentores <strong>de</strong> 20 pés, totalizando 24.883 contentores,contra 26.232 do IV trimestre do ano passado.Já nos contentores <strong>de</strong> 40 pés, registou-se umaquebra <strong>de</strong> 21,5 por cento. A produção foi <strong>de</strong> 13.927contentores, contra 17.752 contentores do últimotrimestre do ano passado. O segundo maior ponto<strong>de</strong> entrada <strong>de</strong> mercadorias, o Porto do Lobito, onúmero <strong>de</strong> contentores <strong>de</strong> 20 pés caiu 28,5 porcento. Nos contentores <strong>de</strong> 40 pés a queda tambémfoi acentuada, 22,5 por cento.Port of Luanda recor<strong>de</strong>d during the first quarter ofthis year, down 5.14 percent at the entrance of 20-footcontainers, totalling 24 883 containers, compared with26 232 of the IV quarter of last year. Already in the 40-foot containers, there was a <strong>de</strong>cline of 21.5 percent.The production was 13,927 containers, 17,752 containersagainst the final quarter of last year. The secondmajor point of entry of goods, the Port of Lobito, thenumber of 20-foot containers fell 28.5 percent. In the40-foot containers was also accentuated the fall, 22.5percent.ANALISE COMPARATIVA - <strong>2010</strong> - PORTOS DE DESTINOPORTS OF DESTINATION OF GOODS PER UNITS IN <strong>2010</strong>NÚMERO DE UNIDADESCONTENTOR10PORTO I Trim <strong>2010</strong> 4 Trime 2009 DIFERENÇA VARIAÇÃOCABINDA 0 2 -2 -100,00LUANDA 11 6 5 83,33SOYO 0 2 -2 -100,00MALONGO 2 0 2 NATOTAL 38,7987 121,26 -82,4613 -44,036854NÚMERO DE UNIDADESCONTENTOR20PORTO I Trim <strong>2010</strong> 4 Trime 2009 DIFERENÇA VARIAÇÃOCABINDA 1.279 1535 -256 -16,68POINT NOIRE 118 137 -19 -13,87NAMIBE 1.575 1543 32 2,07LUANDA 24.883 26232 -1.349 -5,14LOBITO 2.665 3728 -1.063 -28,51SOYO 488 489 -1 -0,20MALONGO 829 763 66 8,65SONILS 15 32 -17 -53,13ONDJIVA 2 0 2 NAANGOLA 3 0 3 NAPORTO AMBOIM 25 48 -23 -47,92TOTAL 634.951,29 718142,59 -83.191,30 -155,43NÚMERO DE UNIDADESCONTENTOR40PORTO I TRIM <strong>2010</strong> 4 Trime 2009 DIFERENÇA VARIAÇÃOCABINDA 242 455 -213 -46,81POINT NOIRE 35 24 11 45,83NAMIBE 645 989 -344 -34,78LUANDA 13.927 17752 -3825 -21,55LOBITO 1.720 2220 -500 -22,52SOYO 265 312 -47 -15,06MALONGO 62 97 -35 -36,08SONILS 35 15 20 133,33ANY PORT OF ANGOLA 3 0 3 NAPORTO AMBOIM 17 41 -24 -58,54TOTAL 275.162,30 334662,51 -59.500,21 -102,34A ANALISE COMPARATIVANÚMERO DE UNIDADESFRIGO10PORTO I Trim <strong>2010</strong> 4 Trime 2009 DIFERENÇA VARIAÇÃOLUANDA 0 1 -1 -100LOBITO 0 4 -4 -100MALONGO 5 0 5 NAPORTO AMBOIM 0 1 -1 -100TOTAL 45,5694 28,50 17,07 NANÚMERO DE UNIDADESFRIGO20PORTO I Trim <strong>2010</strong> 4 Trime 2009 DIFERENÇA VARIAÇÃOCABINDA 14 22 -8 -36,36POINT NOIRE 2 1 1 100,00NAMIBE 7 9 -2 -22,22LUANDA 95 162 -67 -41,36LOBITO 7 15 -8 -53,33SOYO 86 85 1 1,18MALONGO 105 54 51 94,44TOTAL 3.707,57 4629,65 -922,08 1,11NÚMERO DE UNIDADESFRIGO40PORTO I Trim <strong>2010</strong> 4 Trime 2009 DIFERENÇA VARIAÇÃOCABINDA 78 125 -47 -37,60POINT NOIRE 10 5 5 100,00NAMIBE 47 43 4 9,30LUANDA 2.994 2602 392 15,07LOBITO 147 128 19 14,84SOYO 21 10 11 110,00TOTAL 89.639,45 78365,64 11.273,81 151,10
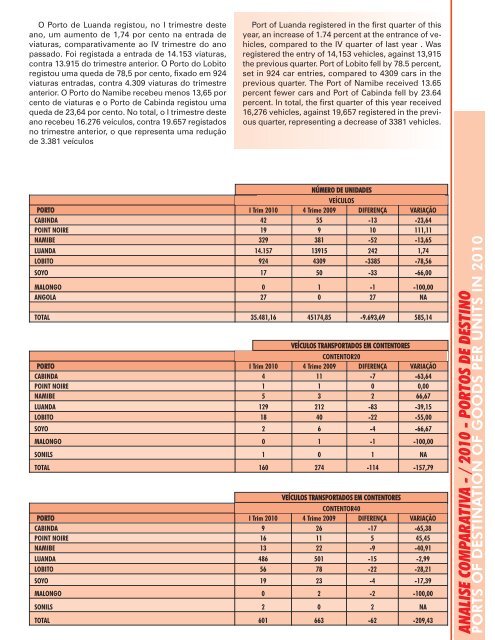
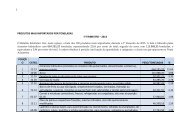
O Porto <strong>de</strong> Luanda registou, no I trimestre <strong>de</strong>steano, um aumento <strong>de</strong> 1,74 por cento na entrada <strong>de</strong>viaturas, comparativamente ao IV trimestre do anopassado. Foi registada a entrada <strong>de</strong> 14.153 viaturas,contra 13.915 do trimestre anterior. O Porto do Lobitoregistou uma queda <strong>de</strong> 78,5 por cento, fixado em 924viaturas entradas, contra 4.309 viaturas do trimestreanterior. O Porto do Namibe recebeu menos 13,65 porcento <strong>de</strong> viaturas e o Porto <strong>de</strong> Cabinda registou umaqueda <strong>de</strong> 23,64 por cento. No total, o I trimestre <strong>de</strong>steano recebeu 16.276 veículos, contra 19.657 registadosno trimestre anterior, o que representa uma redução<strong>de</strong> 3.381 veículosPort of Luanda registered in the first quarter of thisyear, an increase of 1.74 percent at the entrance of vehicles,compared to the IV quarter of last year . Wasregistered the entry of 14,153 vehicles, against 13,915the previous quarter. Port of Lobito fell by 78.5 percent,set in 924 car entries, compared to 4309 cars in theprevious quarter. The Port of Namibe received 13.65percent fewer cars and Port of Cabinda fell by 23.64percent. In total, the first quarter of this year received16,276 vehicles, against 19,657 registered in the previousquarter, representing a <strong>de</strong>crease of 3381 vehicles.NÚMERO DE UNIDADESVEÍCULOSPORTO I Trim <strong>2010</strong> 4 Trime 2009 DIFERENÇA VARIAÇÃOCABINDA 42 55 -13 -23,64POINT NOIRE 19 9 10 111,11NAMIBE 329 381 -52 -13,65LUANDA 14.157 13915 242 1,74LOBITO 924 4309 -3385 -78,56SOYO 17 50 -33 -66,00MALONGO 0 1 -1 -100,00ANGOLA 27 0 27 NATOTAL 35.481,16 45174,85 -9.693,69 585,14VEÍCULOS TRANSPORTADOS EM CONTENTORESCONTENTOR20PORTO I Trim <strong>2010</strong> 4 Trime 2009 DIFERENÇA VARIAÇÃOCABINDA 4 11 -7 -63,64POINT NOIRE 1 1 0 0,00NAMIBE 5 3 2 66,67LUANDA 129 212 -83 -39,15LOBITO 18 40 -22 -55,00SOYO 2 6 -4 -66,67MALONGO 0 1 -1 -100,00SONILS 1 0 1 NATOTAL 160 274 -114 -157,79VEÍCULOS TRANSPORTADOS EM CONTENTORESCONTENTOR40PORTO I Trim <strong>2010</strong> 4 Trime 2009 DIFERENÇA VARIAÇÃOCABINDA 9 26 -17 -65,38POINT NOIRE 16 11 5 45,45NAMIBE 13 22 -9 -40,91LUANDA 486 501 -15 -2,99LOBITO 56 78 -22 -28,21SOYO 19 23 -4 -17,39MALONGO 0 2 -2 -100,00SONILS 2 0 2 NATOTAL 601 663 -62 -209,43ANALISE COMPARATIVA - / <strong>2010</strong> - PORTOS DE DESTINOPORTS OF DESTINATION OF GOODS PER UNITS IN <strong>2010</strong>