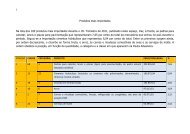
A China e Portugal se mantiveram, no I trimestre<strong>de</strong>ste ano, na li<strong>de</strong>rança dos maiores exportadorespara <strong>Angola</strong>, enquanto a Espanha passou da terceirapara a 17ª posição.A China beneficiu <strong>de</strong> um aumento<strong>de</strong> 45,7 por cento nas suas exportações para <strong>Angola</strong>.Já Portugal, apesar <strong>de</strong> ter registado uma queda <strong>de</strong> 5,por cento nas suas exportações para <strong>Angola</strong>, manteveo segundo lugar. O terceiro é agora a Françaque também viu as exportações caírem (8,8%)mas conseguiu ultrapassar o Brasil, que teve umaqueda maior (25%). No total a China foi responsávelpor 40 por cento das mercadorias que entraramem <strong>Angola</strong>, enquanto Portugal ficou com um saldo<strong>de</strong> 13,2 por cento.China and Portugal remained in the first quarter ofthis year, the lea<strong>de</strong>rship of the largest exporters to <strong>Angola</strong>,while Spain dropped from third to 17th position.China has benefited from a rise of 45.7 percent on itsexports to <strong>Angola</strong>. Already Portugal, <strong>de</strong>spite havingregistered a fall of 5 per cent in its exports to <strong>Angola</strong>,remained in second place. The third is now France thatalso saw exports fall (8.8%) but failed to overcomeBrazil, which had a greater <strong>de</strong>crease (25%). In total,China was responsible for 40 percent of goods entering<strong>Angola</strong>, while Portugal was left with a balance of13.2 percent.ANALISE COMPARATIVA / <strong>2010</strong>- MERCADOSMAJOR IMPORTERS IN <strong>2010</strong>MERCADOS (PAÍSES) MAIS SIGNIFICATIVOSTONELADASPOSIÇÃO ID PAÍS I TRIM <strong>2010</strong> 4 TRIME 2009 DIFERENÇA VARIAÇÃO1 44 China 959.297,22 658.416,75 300.880,47 45,702 171 Portugal 316.732,50 333.763,66 -17.031,16 -5,103 72 França 138.274,57 151.620,32 -13.345,75 -8,804 28 Brasil 123.721,74 165.379,99 -41.658,25 -25,195 24 Bélgica 97.286,93 107.612,66 -10.325,73 -9,606 2 África do Sul (South Africa) 66.192,17 83.779,68 -17.587,51 -20,997 66 Estados Unidos da América 63.205,78 40.531,30 22.674,48 55,948 213 Turquia 54.756,04 41.028,89 13.727,15 33,469 264 Vietname 54.428,12 59.270,66 -4.842,54 -8,1710 61 Emirados Arabes Unidos 48.820,10 50.512,45 -1.692,35 -3,3511 204 Taiwan 48.283,89 1.742,53 46.541,36 2670,9112 106 Índia 45.504,75 45.324,91 179,84 0,4013 40 Canadá 41.895,13 88.525,78 -46.630,65 -52,6714 107 Indonésia 34.832,87 22.161,39 12.671,48 57,1815 13 Argentina 32.749,61 46.430,00 -13.680,39 -29,4616 203 Tailândia 32.560,79 28.486,88 4.073,91 14,3017 63 Espanha 31.246,94 290.721,63 -259.474,69 -89,2518 132 Malásia 28.928,70 19.845,85 9.082,85 45,7719 51 Costa do Marfim 25.306,49 16.330,46 8.976,03 54,9620 174 Reino Unido 18.370,01 5.252,59 13.117,42 249,7321 4 Alemanha (Germany) 16.186,96 18.322,91 -2.135,95 -11,6622 153 Holanda 15.143,47 11.006,05 4.137,42 37,5923 113 Itália 14.575,08 18.743,28 -4.168,20 -22,2424 194 Singapura 11.570,34 12.570,20 -999,86 -7,9525 109 Irão 9.790,52 4.481,63 5.308,89 118,4626 50 Coreia do Sul 8.329,88 18.870,45 -10.540,57 -55,8627 123 Líbano 5.769,13 4.831,99 937,14 19,3928 70 Filipinas 5.647,12 12,91 5.634,21 43642,2229 169 Polónia 5.207,51 636,18 4.571,33 718,5630 60 Egipto 4.309,36 6.965,36 -2.656,00 -38,1331 116 Japão 4.256,11 2.221,09 2.035,02 91,6232 112 Israel 3.784,39 138,81 3.645,58 2626,3133 217 Uruguai 3.097,99 2.127,93 970,06 45,5934 165 Paquistão 2.823,11 3.564,71 -741,60 -20,8035 150 Namíbia 2.722,41 3.290,33 -567,92 -17,2636 137 Marrocos 2.530,81 1.103,35 1.427,46 129,3837 173 Quénia 2.262,39 533,81 1.728,58 323,8238 201 Suécia 2.018,12 3.285,44 -1.267,32 -38,5739 195 Síria 1.995,29 1.809,40 185,89 10,2740 48 Congo 1.747,72 40.558,03 -38.810,31 -95,6941 160 Nova Zelândia 1.621,46 1.244,11 377,35 30,3342 142 México 1.540,22 1.365,00 175,22 12,8443 158 Noruega 1.395,99 1.924,72 -528,73 -27,4744 166 Paraguai 1.321,25 614,61 706,64 114,97
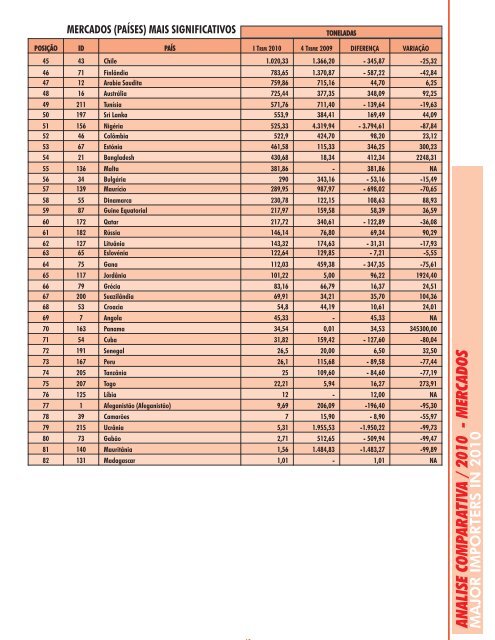
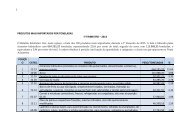
MERCADOS (PAÍSES) MAIS SIGNIFICATIVOSTONELADASPOSIÇÃO ID PAÍS I TRIM <strong>2010</strong> 4 TRIME 2009 DIFERENÇA VARIAÇÃO45 43 Chile 1.020,33 1.366,20 - 345,87 -25,3246 71 Finlândia 783,65 1.370,87 - 587,22 -42,8447 12 Arabia Saudita 759,86 715,16 44,70 6,2548 16 Austrália 725,44 377,35 348,09 92,2549 211 Tunísia 571,76 711,40 - 139,64 -19,6350 197 Sri Lanka 553,9 384,41 169,49 44,0951 156 Nigéria 525,33 4.319,94 - 3.794,61 -87,8452 46 Colômbia 522,9 424,70 98,20 23,1253 67 Estónia 461,58 115,33 346,25 300,2354 21 Bangla<strong>de</strong>sh 430,68 18,34 412,34 2248,3155 136 M<strong>alta</strong> 381,86 - 381,86 NA56 34 Bulgária 290 343,16 - 53,16 -15,4957 139 Maurício 289,95 987,97 - 698,02 -70,6558 55 Dinamarca 230,78 122,15 108,63 88,9359 87 Guine Equatorial 217,97 159,58 58,39 36,5960 172 Qatar 217,72 340,61 - 122,89 -36,0861 182 Rússia 146,14 76,80 69,34 90,2962 127 Lituânia 143,32 174,63 - 31,31 -17,9363 65 Eslovénia 122,64 129,85 - 7,21 -5,5564 75 Gana 112,03 459,38 - 347,35 -75,6165 117 Jordânia 101,22 5,00 96,22 1924,4066 79 Grécia 83,16 66,79 16,37 24,5167 200 Suazilândia 69,91 34,21 35,70 104,3668 53 Croacia 54,8 44,19 10,61 24,0169 7 <strong>Angola</strong> 45,33 - 45,33 NA70 163 Panama 34,54 0,01 34,53 345300,0071 54 Cuba 31,82 159,42 - 127,60 -80,0472 191 Senegal 26,5 20,00 6,50 32,5073 167 Peru 26,1 115,68 - 89,58 -77,4474 205 Tanzânia 25 109,60 - 84,60 -77,1975 207 Togo 22,21 5,94 16,27 273,9176 125 Líbia 12 - 12,00 NA77 1 Afeganistão (Afeganistão) 9,69 206,09 -196,40 -95,3078 39 Camarões 7 15,90 - 8,90 -55,9779 215 Ucrânia 5,31 1.955,53 -1.950,22 -99,7380 73 Gabão 2,71 512,65 - 509,94 -99,4781 140 Mauritânia 1,56 1.484,83 -1.483,27 -99,8982 131 Madagascar 1,01 - 1,01 NAANALISE COMPARATIVA / <strong>2010</strong> - MERCADOSMAJOR IMPORTERS IN <strong>2010</strong>