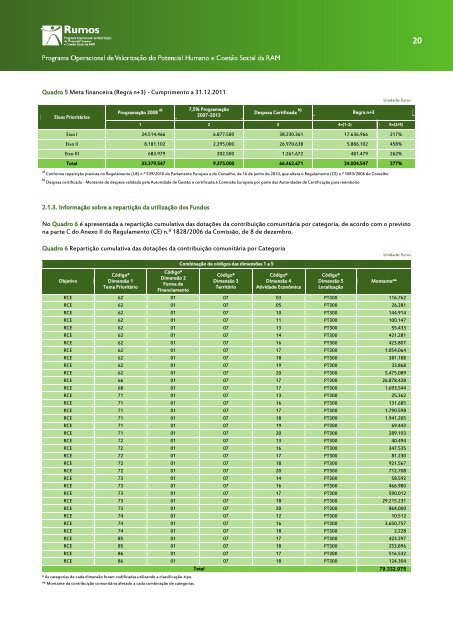
20Quadro 5 Meta financeira (Regra n+3) - Cumprimento a 31.12.2011Unida<strong>de</strong>: EurosEixos Prioritários<strong>Programa</strong>ção 2008 a)7,5% <strong>Programa</strong>ção2007-2013Despesa Certificada b) Regra n+31 2 3 4=(1-2) 5=(3/4)Eixo I 24.514.466 6.877.500 38.230.361 17.636.966 217%Eixo II 8.181.102 2.295.000 26.970.638 5.886.102 458%Eixo III 683.979 202.500 1.261.672 481.479 262%Total 33.379.547 9.375.000 66.462.671 24.004.547 277%a) Conforme repartição prevista no Regulamento (UE) n.º 539/2010 do Parlamento Europeu e do Conselho, <strong>de</strong> 16 <strong>de</strong> junho <strong>de</strong> 2010, que altera o Regulamento (CE) n.º 1083/2006 do Conselhob) Despesa certificada - Montante <strong>de</strong> <strong>de</strong>spesa validada pela Autorida<strong>de</strong> <strong>de</strong> Gestão e certificada à Comissão Europeia por parte das Autorida<strong>de</strong>s <strong>de</strong> Certificação para reembolso2.1.3. Informação sobre a repartição da utilização dos FundosNo Quadro 6 é apresentada a repartição cumulativa das dotações da contribuição comunitária por categoria, <strong>de</strong> acordo com o previstona parte C do Anexo II do Regulamento (CE) n.º 1828/2006 da Comissão, <strong>de</strong> 8 <strong>de</strong> <strong>de</strong>zembro.Quadro 6 Repartição cumulativa das dotações da contribuição comunitária por CategoriaObjetivoCódigo*Dimensão 1Tema PrioritárioCódigo*Dimensão 2Forma <strong>de</strong>FinanciamentoCombinação <strong>de</strong> códigos das dimensões 1 a 5Código*Dimensão 3TerritórioCódigo*Dimensão 4Ativida<strong>de</strong> EconómicaCódigo*Dimensão 5LocalizaçãoUnida<strong>de</strong>: EurosMontante**RCE 62 01 07 03 PT300 116.762RCE 62 01 07 05 PT300 26.281RCE 62 01 07 10 PT300 144.914RCE 62 01 07 11 PT300 100.147RCE 62 01 07 13 PT300 55.433RCE 62 01 07 14 PT300 421.281RCE 62 01 07 16 PT300 423.807RCE 62 01 07 17 PT300 1.054.064RCE 62 01 07 18 PT300 381.188RCE 62 01 07 19 PT300 33.868RCE 62 01 07 20 PT300 5.475.089RCE 66 01 07 17 PT300 26.878.428RCE 68 01 07 17 PT300 1.693.544RCE 71 01 07 13 PT300 25.362RCE 71 01 07 16 PT300 131.685RCE 71 01 07 17 PT300 1.790.598RCE 71 01 07 18 PT300 1.941.205RCE 71 01 07 19 PT300 69.443RCE 71 01 07 20 PT300 289.103RCE 72 01 07 13 PT300 40.494RCE 72 01 07 16 PT300 347.535RCE 72 01 07 17 PT300 81.230RCE 72 01 07 18 PT300 921.567RCE 72 01 07 20 PT300 712.708RCE 73 01 07 14 PT300 58.592RCE 73 01 07 16 PT300 466.980RCE 73 01 07 17 PT300 590.012RCE 73 01 07 18 PT300 29.215.231RCE 73 01 07 20 PT300 864.000RCE 74 01 07 12 PT300 10.512RCE 74 01 07 16 PT300 3.650.757RCE 74 01 07 18 PT300 2.228RCE 85 01 07 17 PT300 423.297RCE 85 01 07 18 PT300 253.896RCE 86 01 07 17 PT300 516.532RCE 86 01 07 18 PT300 124.304Total 79.332.075* As categorias <strong>de</strong> cada dimensão foram codificadas utilizando a classificação-tipo.** Montante da contribuição comunitária afetado a cada combinação <strong>de</strong> categorias.
212.1.4. Assistência por grupos-alvoRelativamente à análise dos dados sobre os participantes em operações do FSE por priorida<strong>de</strong>, patentes no Quadro 7 são <strong>de</strong> assinalar asseguintes constatações:Foram abrangidos por intervenção do FSE - nos domínios da Educação e Formação, por um lado, e do Emprego e CoesãoSocial, por outro - um total <strong>de</strong> 26.180 pessoas/ano, 89% das quais ao abrigo da intervenção do Eixo I - Educação e Formação;A maioria <strong>de</strong>ste universo <strong>de</strong> participantes é representada pelo sexo feminino (59%), sendo tal realida<strong>de</strong> comum tanto ao EixoI como ao Eixo II (60% e 54%, respetivamente).Quadro 7 Dados sobre os participantes em operações do FSE, por eixo prioritárioEixoPrioritárioN.ºParticipantesAnoHMSituação no Mercado <strong>de</strong> Trabalho Ida<strong>de</strong> Grupos Vulneráveis Nível HabilitaçõesC/Emp. TCP Desemp DLD's Inativos Inac. E/F 15 - 24 55 -64 Minorias MigrantesDesvaf. Nível 1 /2 Nível 3 Nível 4 Nível 5<strong>de</strong>ficiênciaEixo I 23.325 9.332 13.993 13.415 317 7.157 2.429 2.753 1.369 5.110 665 0 0 159 110 10.589 3.711 7 5.353Eixo II 2.855 1.325 1.530 19 0 1.842 994 0 0 647 176 0 0 3 73 1.537 504 12 802Total 26.180 10.657 15.523 13.434 317 8.999 3.423 2.753 1.369 5.757 841 0 0 162 183 12.126 4.215 19 6.155Fonte: SIIFSENota: Nas Tipologias <strong>de</strong> Operação "Bolsas para professores", "<strong>Programa</strong>s e Bolsas <strong>de</strong> Pós-Graduação, Mestrado, Doutoramento e Pós-Doutoramento" e "projetos <strong>de</strong> investigação" não é recolhidainformação sobre a Situação no Mercado <strong>de</strong> TrabalhoNa Tipologia “Reconhecimento, Validação e Certificação <strong>de</strong> Competências” foi consi<strong>de</strong>rado o total <strong>de</strong> formandos abrangidos nas várias fases do processo <strong>de</strong> RVCC.2.1.5. Apoio restituído ou reutilizadoNão se registaram situações previstas no n.º 2 do artigo 57º e no n.º 2 do artigo 98º do Regulamento (CE) n.º 1083/2006 do Conselho,<strong>de</strong> 11 <strong>de</strong> julho.2.1.6. Análise qualitativaEste ponto proporciona uma visão global e consolidada da dinâmica <strong>de</strong> realizações do <strong>Programa</strong>, bem como uma análise crítica damesma, com base na informação física e financeira apresentada quer nos pontos anteriores, quer na informação específica que aqui se<strong>de</strong>senvolve em termos <strong>de</strong> candidaturas, aprovações e execução.Candidaturas: apresentadas, aprovadas e contratadasO <strong>Programa</strong> <strong>Rumos</strong> tem duas modalida<strong>de</strong>s <strong>de</strong> apresentação <strong>de</strong> candidaturas: período fechado e período aberto, verificando-se umasituação mista no Eixo Prioritário I, sendo a apresentação <strong>de</strong> candidaturas nos Eixos Prioritários II e III em período aberto.No âmbito do Eixo I, a apresentação <strong>de</strong> candidaturas funciona em períodos fechados, através <strong>de</strong> concursos, para a generalida<strong>de</strong> dasTipologias <strong>de</strong> Operação, com exceção das candidaturas apresentadas no âmbito das Tipologias <strong>de</strong> Operação 1.3.1 - Bolsas paraProfessores/Investigadores, 1.3.2 - <strong>Programa</strong>s e Bolsas <strong>de</strong> Pós - Graduação, Mestrado, Doutoramento e Pós-Doutoramento e 1.3.4 -Projetos <strong>de</strong> Investigação, que funcionam em regime <strong>de</strong> candidatura aberta, sendo que o respetivo início do período se reporta a 18 <strong>de</strong><strong>de</strong>zembro <strong>de</strong> 2007. Este processo inicia-se com a publicação <strong>de</strong> um aviso <strong>de</strong> abertura, do qual constam os prazos para a apresentação,admissão e seleção <strong>de</strong> candidaturas.As candidaturas no âmbito dos Eixos II e III são apresentadas ao longo do período <strong>de</strong> programação, i.e., funcionam em períodocontínuo (início a 18 <strong>de</strong> <strong>de</strong>zembro <strong>de</strong> 2007).