<strong>PROT</strong>-<strong>AML</strong> Anexo. Demografia 1871.22Estrangeiros com Residência Legalizada,Segun<strong>do</strong> o Local <strong>de</strong> Residência e a ProveniênciaDISTRITO DE LISBOA DISTRITO DE SETÚBAL DISTRITOS DE LISBOA E SETÚBAL PORTUGALPROVENIÊNCIA 1991 1997 1991 1997 1991 1997 1991 1997Total 100,0 100,0 100,0 100,0 100,0 100,0 100,0 100,0Europa 26,3 22,1 13,6 14,1 24,3 21,0 29,0 28,4UE 23,7 20,3 12,4 12,9 22,0 19,3 26,4 26,3Alemanha 3,6 3,0 2,4 3,1 3,4 3,0 4,5 4,8Áustria - 0,2 - 0,1 - 0,2 - 0,2Bélgica 0,9 0,7 0,4 0,6 0,8 0,7 1,0 1,0Dinamarca 0,3 0,3 0,1 0,2 0,3 0,2 0,4 0,4Espanha 8,7 6,3 3,7 3,1 7,9 5,9 6,6 5,6Finlândia - 0,2 - 0,1 - 0,1 - 0,2França 3,0 2,7 1,7 1,9 2,8 2,6 3,0 3,1Grécia 0,1 0,1 0,0 0,0 0,1 0,1 0,1 0,1Holanda 1,0 0,9 0,8 0,9 1,0 0,9 1,7 1,8Irlanda 0,2 0,2 0,1 0,1 0,2 0,2 0,2 0,2Itália 1,2 1,2 1,3 1,1 1,2 1,2 1,1 1,3Luxemburgo 0,0 0,0 0,0 0,0 0,0 0,0 0,0 0,0Reino Uni<strong>do</strong> 4,8 4,0 1,8 1,6 4,3 3,6 7,8 7,0Suécia - 0,6 - 0,3 - 0,6 - 0,6Outros da Europa 2,6 1,8 1,2 1,1 2,4 1,7 2,6 2,1África 52,9 56,9 77,2 76,1 56,6 59,7 42,1 46,6Angola 5,5 11,6 6,8 12,2 5,7 11,7 5,0 9,3Cabo Ver<strong>de</strong> 33,3 27,5 57,2 48,8 36,9 30,5 26,1 22,7Guiné Bissau 5,3 8,5 2,8 5,3 4,9 8,1 4,2 7,3Moçambique 4,0 3,3 5,4 4,4 4,3 3,4 2,9 2,5São Tomé e Príncipe 2,6 3,4 3,7 4,1 2,8 3,5 1,9 2,5Outros <strong>de</strong> África 2,2 2,7 1,2 1,4 2,1 2,5 1,9 2,3América <strong>do</strong> Norte 5,5 5,1 1,8 1,4 4,9 4,6 8,1 6,0Canadá 0,7 0,5 0,6 0,5 0,7 0,5 1,8 1,3EUA 4,8 4,5 1,3 0,9 4,3 4,0 6,3 4,8América Central e <strong>do</strong> Sul 9,1 10,3 4,5 5,8 8,4 9,7 16,4 14,4Brasil 7,8 9,1 3,6 4,9 7,2 8,5 11,1 11,4Venezuela 0,5 0,3 0,5 0,3 0,5 0,3 4,4 2,2Outros da AC e Sul 0,9 0,9 0,4 0,5 0,8 0,8 0,8 0,9Ásia 5,7 5,2 2,4 2,3 5,2 4,7 3,9 4,1Oceânia 0,2 0,2 0,2 0,2 0,2 0,2 0,3 0,3Apátridas 0,3 0,2 0,2 0,2 0,2 0,2 0,2 0,2Fonte: INE. Estatísticas Demográficas, 1991, 1997Unida<strong>de</strong>: % em coluna
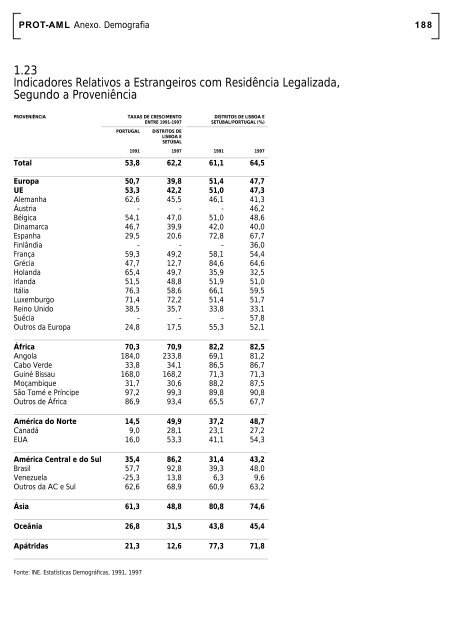
<strong>PROT</strong>-<strong>AML</strong> Anexo. Demografia 1881.23Indica<strong>do</strong>res Relativos a Estrangeiros com Residência Legalizada,Segun<strong>do</strong> a ProveniênciaPROVENIÊNCIA TAXAS DE CRESCIMENTO DISTRITOS DE LISBOA EENTRE 1991-1997 SETÚBAL/PORTUGAL (%)PORTUGAL DISTRITOS DELISBOA ESETÚBAL1991 1997 1991 1997Total 53,8 62,2 61,1 64,5Europa 50,7 39,8 51,4 47,7UE 53,3 42,2 51,0 47,3Alemanha 62,6 45,5 46,1 41,3Áustria - - - 46,2Bélgica 54,1 47,0 51,0 48,6Dinamarca 46,7 39,9 42,0 40,0Espanha 29,5 20,6 72,8 67,7Finlândia - - - 36,0França 59,3 49,2 58,1 54,4Grécia 47,7 12,7 84,6 64,6Holanda 65,4 49,7 35,9 32,5Irlanda 51,5 48,8 51,9 51,0Itália 76,3 58,6 66,1 59,5Luxemburgo 71,4 72,2 51,4 51,7Reino Uni<strong>do</strong> 38,5 35,7 33,8 33,1Suécia - - - 57,8Outros da Europa 24,8 17,5 55,3 52,1África 70,3 70,9 82,2 82,5Angola 184,0 233,8 69,1 81,2Cabo Ver<strong>de</strong> 33,8 34,1 86,5 86,7Guiné Bissau 168,0 168,2 71,3 71,3Moçambique 31,7 30,6 88,2 87,5São Tomé e Príncipe 97,2 99,3 89,8 90,8Outros <strong>de</strong> África 86,9 93,4 65,5 67,7América <strong>do</strong> Norte 14,5 49,9 37,2 48,7Canadá 9,0 28,1 23,1 27,2EUA 16,0 53,3 41,1 54,3América Central e <strong>do</strong> Sul 35,4 86,2 31,4 43,2Brasil 57,7 92,8 39,3 48,0Venezuela -25,3 13,8 6,3 9,6Outros da AC e Sul 62,6 68,9 60,9 63,2Ásia 61,3 48,8 80,8 74,6Oceânia 26,8 31,5 43,8 45,4Apátridas 21,3 12,6 77,3 71,8Fonte: INE. Estatísticas Demográficas, 1991, 1997
- Page 1:
Vol. IIIPROT-AMLPlano Regional deOr
- Page 6 and 7:
1 Demografia1.1 Inserção Demográ
- Page 8 and 9:
PROT-AML Demografia 71.2 Evolução
- Page 10 and 11:
PROT-AML Capítulo Demografia 9Fig.
- Page 12 and 13:
PROT-AML Demografia 11e Montijo, es
- Page 14 and 15:
PROT-AML Demografia 13pelos valores
- Page 16 and 17:
PROT-AML Demografia 15de constituir
- Page 18 and 19:
PROT-AML Demografia 17Assim, em 199
- Page 20 and 21:
PROT-AML Demografia 19Estrangeiros
- Page 22 and 23:
PROT-AML Demografia 21O concelho ma
- Page 24 and 25:
PROT-AML Demografia - Actualizaçã
- Page 26 and 27:
PROT-AML Demografia - Actualizaçã
- Page 28 and 29:
PROT-AML Demografia - Actualizaçã
- Page 30 and 31:
PROT-AML Demografia - Actualizaçã
- Page 32 and 33:
PROT-AML Demografia - Actualizaçã
- Page 34 and 35:
2 Habitação e Dinâmica Urbaníst
- Page 36 and 37:
PROT-AML Habitação e Dinâmica Ur
- Page 38 and 39:
PROT-AML Habitação e Dinâmica Ur
- Page 40 and 41:
PROT-AML Habitação e Dinâmica Ur
- Page 42 and 43:
PROT-AML Habitação e Dinâmica Ur
- Page 44 and 45:
PROT-AML Habitação e Dinâmica Ur
- Page 46 and 47:
3 Equipamentos Sociais e Culturais3
- Page 48 and 49:
PROT-AML Equipamentos Sociais e Cul
- Page 50 and 51:
PROT-AML Equipamentos Sociais e Cul
- Page 52 and 53:
PROT-AML Equipamentos Sociais e Cul
- Page 54 and 55:
PROT-AML Equipamentos Sociais e Cul
- Page 56 and 57:
PROT-AML Equipamentos Sociais e Cul
- Page 58 and 59:
PROT-AML Equipamentos Sociais e Cul
- Page 60 and 61:
PROT-AML Equipamentos Sociais e Cul
- Page 62 and 63:
PROT-AML Equipamentos Sociais e Cul
- Page 64 and 65:
PROT-AML Equipamentos Sociais e Cul
- Page 66 and 67:
PROT-AML Equipamentos Sociais e Cul
- Page 68 and 69:
4 Estrutura Produtiva4.1 Introduç
- Page 70 and 71:
PROT-AML Estrutura Produtiva 69Veri
- Page 72 and 73:
PROT-AML Estrutura Produtiva 71Fig.
- Page 74 and 75:
PROT-AML Estrutura Produtiva 73Exis
- Page 76 and 77:
PROT-AML Estrutura Produtiva 75Arei
- Page 78 and 79:
PROT-AML Estrutura Produtiva 77a ma
- Page 80 and 81:
5 Exclusão Sociale Fragmentação
- Page 82 and 83:
PROT-AML Exclusão Social e Fragmen
- Page 84 and 85:
PROT-AML Exclusão Social e Fragmen
- Page 86 and 87:
PROT-AML Capítulo Exclusão Social
- Page 88 and 89:
PROT-AML Exclusão Social e Fragmen
- Page 90 and 91:
PROT-AML Exclusão Social e Fragmen
- Page 92 and 93:
PROT-AML Exclusão Social e Fragmen
- Page 94 and 95:
PROT-AML Exclusão Social e Fragmen
- Page 96 and 97:
6 Mobilidade6.1 Inquérito à Mobil
- Page 98 and 99:
PROT-AML Mobilidade 976.1 Inquérit
- Page 100 and 101:
PROT-AML Mobilidade 996.2.1Indicado
- Page 102 and 103:
PROT-AML Mobilidade 101Os grupos et
- Page 104 and 105:
PROT-AML Mobilidade 103Duração da
- Page 106 and 107:
PROT-AML Mobilidade 105Figura 1.11R
- Page 108 and 109:
PROT-AML Mobilidade 107O conjunto d
- Page 110 and 111:
PROT-AML Mobilidade 109Figura 2.7Es
- Page 112 and 113:
PROT-AML Mobilidade 111Repartição
- Page 114 and 115:
PROT-AML Mobilidade 113à respectiv
- Page 116 and 117:
7 Síntese do Diagnósticodo Sistem
- Page 118 and 119:
PROT-AML Síntese do Diagnóstico d
- Page 120 and 121:
PROT-AML Síntese do Diagnóstico d
- Page 122 and 123:
PROT-AML Síntese do Diagnóstico d
- Page 124 and 125:
PROT-AML Síntese do Diagnóstico d
- Page 126 and 127:
PROT-AML Síntese do Diagnóstico d
- Page 128 and 129:
PROT-AML Síntese do Diagnóstico d
- Page 130 and 131:
PROT-AML Síntese do Diagnóstico d
- Page 132 and 133:
PROT-AML Síntese do Diagnóstico d
- Page 134 and 135:
PROT-AML Síntese do Diagnóstico d
- Page 136 and 137:
PROT-AML Síntese do Diagnóstico d
- Page 138 and 139: PROT-AML Síntese do Diagnóstico d
- Page 140 and 141: PROT-AML Síntese do Diagnóstico d
- Page 142 and 143: PROT-AML Síntese do Diagnóstico d
- Page 144 and 145: PROT-AML Síntese do Diagnóstico d
- Page 146 and 147: PROT-AML Síntese do Diagnóstico d
- Page 148 and 149: PROT-AML Síntese do Diagnóstico d
- Page 150 and 151: PROT-AML Síntese do Diagnóstico d
- Page 152 and 153: PROT-AML Síntese do Diagnóstico d
- Page 154 and 155: 8 Infraestruturas Energéticas8.1 I
- Page 156 and 157: PROT-AML Infraestruturas Energétic
- Page 158 and 159: PROT-AML Infraestruturas Energétic
- Page 160 and 161: PROT-AML Infraestruturas Energétic
- Page 162 and 163: 9 Protecção Civil9.1 Nota Introdu
- Page 164 and 165: PROT-AML Protecção Civil 163local
- Page 166 and 167: PROT-AML Protecção Civil 165risco
- Page 168 and 169: Anexos1 Demografia2 Habitação e D
- Page 170 and 171: PROT-AML Anexo. Demografia 1691.1In
- Page 172 and 173: PROT-AML Anexo. Demografia 1711.3Ev
- Page 174 and 175: PROT-AML Anexo. Demografia 1731.5Es
- Page 176 and 177: PROT-AML Anexo. Demografia 1751.7Í
- Page 178 and 179: PROT-AML Anexo. Demografia 1771.9Fa
- Page 180 and 181: PROT-AML Anexo. Demografia 1791.11D
- Page 182 and 183: PROT-AML Anexo. Demografia 1811.13T
- Page 184 and 185: PROT-AML Anexo. Demografia 1831.15E
- Page 186 and 187: PROT-AML Anexo. Demografia 1851.20E
- Page 190 and 191: PROT-AML Anexo. Demografia 1891.24S
- Page 192 and 193: 191Instituto Nacional de Estatísti
- Page 194 and 195: PROT-AML Anexo. Demografia.INE ⁄
- Page 196 and 197: PROT-AML Anexo. Demografia.INE ⁄
- Page 198 and 199: PROT-AML Anexo. Demografia.INE ⁄
- Page 200 and 201: PROT-AML Anexo. Demografia.INE ⁄
- Page 202 and 203: PROT-AML Anexo. Demografia.INE ⁄
- Page 204 and 205: PROT-AML Anexo. Demografia.INE ⁄
- Page 206 and 207: PROT-AML Anexo. Demografia.INE ⁄
- Page 208 and 209: PROT-AML Anexo. Demografia.INE ⁄
- Page 210 and 211: PROT-AML Anexo. Demografia.INE ⁄
- Page 212 and 213: PROT-AML Anexo. Demografia.INE ⁄
- Page 214 and 215: PROT-AML Anexo. Demografia.INE ⁄
- Page 216 and 217: PROT-AML Anexo. Demografia.INE ⁄
- Page 218 and 219: PROT-AML Anexo. Demografia.INE ⁄
- Page 220 and 221: PROT-AML Anexo. Habitação e Dinâ
- Page 222 and 223: PROT-AML Anexo. Habitação e Dinâ
- Page 224 and 225: PROT-AML Anexo. Habitação e Dinâ
- Page 226 and 227: PROT-AML Anexo. Habitação e Dinâ
- Page 228 and 229: PROT-AML Anexo. Habitação e Dinâ
- Page 230 and 231: PROT-AML Anexo. Habitação e Dinâ
- Page 232 and 233: PROT-AML Anexo. Habitação e Dinâ
- Page 234 and 235: PROT-AML Anexo. Habitação e Dinâ
- Page 236 and 237: PROT-AML Anexo. Equipamentos Sociai
- Page 238 and 239:
PROT-AML Anexo. Equipamentos Sociai
- Page 240 and 241:
PROT-AML Anexo. Equipamentos Sociai
- Page 242 and 243:
PROT-AML Anexo. Equipamentos Sociai
- Page 244 and 245:
PROT-AML Anexo. Equipamentos Sociai
- Page 246 and 247:
PROT-AML Anexo. Equipamentos Sociai
- Page 248 and 249:
ENSINO SUPERIOR PÚBLICO ENS.SUP.PA
- Page 250 and 251:
PROT-AML Anexo. Equipamentos Sociai
- Page 252 and 253:
PROT-AML Anexo. Equipamentos Sociai
- Page 254 and 255:
PROT-AML Anexo. Equipamentos Sociai
- Page 256 and 257:
PROT-AML Anexo. Equipamentos Sociai
- Page 258 and 259:
PROT-AML Anexo. Equipamentos Sociai
- Page 260 and 261:
PROT-AML Anexo. Equipamentos Sociai
- Page 262 and 263:
PROT-AML Anexo. Equipamentos Sociai
- Page 264 and 265:
PROT-AML Anexo. Equipamentos Sociai
- Page 266 and 267:
PROT-AML Anexo. Equipamentos Sociai
- Page 268 and 269:
PROT-AML Anexo. Equipamentos Sociai
- Page 270 and 271:
PROT-AML Anexo. Equipamentos Sociai
- Page 272 and 273:
PROT-AML Anexo. Equipamentos Sociai
- Page 274 and 275:
PROT-AML Anexo. Equipamentos Sociai
- Page 276 and 277:
PROT-AML Anexo. Equipamentos Sociai
- Page 278 and 279:
PROT-AML Anexo. Equipamentos Sociai
- Page 280 and 281:
PROT-AML Anexo. Estrutura Produtiva
- Page 282 and 283:
PROT-AML Anexo. Estrutura Produtiva
- Page 284 and 285:
PROT-AML Anexo. Estrutura Produtiva
- Page 286 and 287:
PROT-AML Anexo. Estrutura Produtiva
- Page 288 and 289:
PROT-AML Anexo. Estrutura Produtiva
- Page 290 and 291:
PROT-AML Anexo. Estrutura Produtiva
- Page 292 and 293:
PROT-AML Anexo. Estrutura Produtiva
- Page 294 and 295:
PROT-AML Anexo. Estrutura Produtiva
- Page 296 and 297:
PROT-AML Anexo. Exclusão Social e
- Page 298 and 299:
PROT-AML Anexo. Exclusão Social e
- Page 300 and 301:
PROT-AML Anexo. Exclusão Social e
- Page 302 and 303:
PROT-AML Anexo. Exclusão Social e
- Page 304 and 305:
PROT-AML Anexo. Exclusão Social e
- Page 306 and 307:
PROT-AML Anexo. Exclusão Social e
- Page 308 and 309:
PROT-AML Anexo. Exclusão Social e
- Page 310 and 311:
PROT-AML Anexo. Mobilidade 309Macro
- Page 312 and 313:
PROT-AML Anexo. Mobilidade 311Coroa
- Page 314 and 315:
PROT-AML Anexo. Mobilidade 313COROA
- Page 316 and 317:
7. Síntese do Diagnóstico doSiste
- Page 318 and 319:
PROT-AML Anexo. Síntese do Diagnó
- Page 320 and 321:
PROT-AML Anexo. Protecção Civil 3
- Page 322 and 323:
PROT-AML Anexo. Protecção Civil 3
- Page 324 and 325:
PROT-AML Anexo. Protecção Civil 3
- Page 326 and 327:
325Índice1. DEMOGRAFIA 51.1 Inser
- Page 328 and 329:
PROT-AML Índice 3275.4.2. Nota Met