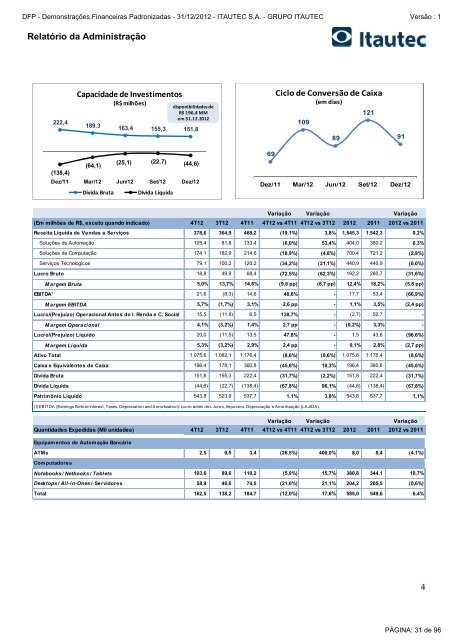
<strong>DFP</strong> - Demonstrações Financeiras Padronizadas - 31/12/<strong>2012</strong> - ITAUTEC S.A. - GRUPO ITAUTEC Versão : 1Relatório da Administração222,4Capacida<strong>de</strong> <strong>de</strong> Investimentos189,3(R$ milhões)disponibilida<strong>de</strong>s <strong>de</strong>R$ 196,4 MMem 31.12.<strong>2012</strong>163,4 155,3 151,812511095Ciclo <strong>de</strong> Conversão <strong>de</strong> Caixa(em dias)1098912191(64,1)(25,1) (22,7) (44,6)(138,4)Dez/11 Mar/12 Jun/12 Set/12 Dez/12Dívida Bruta Dívida Líquida80655069Dez/11 Mar/12 Jun/12 Set/12 Dez/12Variação Variação Variação(Em milhões <strong>de</strong> R$, exceto quando indicado) 4T12 3T12 4T11 4T12 vs 4T11 4T12 vs 3T12 <strong>2012</strong> 2011 <strong>2012</strong> vs 2011Receita Líquida <strong>de</strong> Vendas e Serviços 378,6 364,9 468,2 (19,1%) 3,8% 1.545,3 1.542,3 0,2%Soluções <strong>de</strong> Automação 125,4 81,8 133,4 (6,0%) 53,4% 404,0 380,2 6,3%Soluções <strong>de</strong> Computação 174,1 182,9 214,6 (18,9%) (4,8%) 700,4 721,2 (2,9%)Serviços Tecnológicos 79,1 100,2 120,2 (34,2%) (21,1%) 440,9 440,9 (0,0%)Lucro Bruto 18,8 49,9 68,4 (72,5%) (62,3%) 192,2 280,7 (31,6%)M argem Bruta 5,0% 13,7% 14,6% (9,6 pp) (8,7 pp) 12,4% 18,2% (5,8 pp)EBITDA¹ 21,6 (6,3) 14,6 48,6% - 17,7 53,4 (66,9%)M argem EBITDA 5,7% (1,7%) 3,1% 2,6 pp - 1,1% 3,5% (2,4 pp)Lucro/(Prejuízo) Operacional Antes do I. Renda e C. Social 15,5 (11,8) 6,5 138,7% - (2,7) 50,7 -M argem Operacional 4,1% (3,2%) 1,4% 2,7 pp - (0,2%) 3,3% -Lucro/(Prejuízo) Líquido 20,0 (11,5) 13,5 47,8% - 1,5 43,6 (96,6%)M argem Líquida 5,3% (3,2%) 2,9% 2,4 pp - 0,1% 2,8% (2,7 pp)Ativo Total 1.075,6 1.082,1 1.176,4 (8,6%) (0,6%) 1.075,6 1.176,4 (8,6%)Caixa e Equivalentes <strong>de</strong> Caixa 196,4 178,1 360,8 (45,6%) 10,3% 196,4 360,8 (45,6%)Dívida Bruta 151,8 155,3 222,4 (31,7%) (2,2%) 151,8 222,4 (31,7%)Dívida Líquida (44,6) (22,7) (138,4) (67,8%) 96,1% (44,6) (138,4) (67,8%)Patrimônio Líquido 543,8 523,9 537,7 1,1% 3,8% 543,8 537,7 1,1%(1) EBITDA (Earnings Before Interest, Taxes, Depreciation and Amortization): Lucro antes dos Juros, Impostos, Depreciação e Amortização (LAJIDA).Variação Variação VariaçãoQuantida<strong>de</strong>s Expedidas (Mil unida<strong>de</strong>s) 4T12 3T12 4T11 4T12 vs 4T11 4T12 vs 3T12 <strong>2012</strong> 2011 <strong>2012</strong> vs 2011Equipamentos <strong>de</strong> Automação BancáriaATMs 2,5 0,5 3,4 (26,5%) 400,0% 8,0 8,4 (4,1%)ComputadoresNotebooks / Netbooks / Tablets 103,6 89,6 110,2 (5,9%) 15,7% 380,8 344,1 10,7%Desktops / All-in-Ones / Servidores 58,9 48,6 74,5 (21,0%) 21,1% 204,2 205,5 (0,6%)Total 162,5 138,2 184,7 (12,0%) 17,6% 585,0 549,6 6,4%4PÁGINA: 31 <strong>de</strong> 96
<strong>DFP</strong> - Demonstrações Financeiras Padronizadas - 31/12/<strong>2012</strong> - ITAUTEC S.A. - GRUPO ITAUTEC Versão : 1Relatório da AdministraçãoOPERAÇÕES ITAUTECUNIDADE SOLUÇÕES DE AUTOMAÇÃOA Unida<strong>de</strong> Soluções <strong>de</strong> Automação atua na comercialização <strong>de</strong> produtos e soluções <strong>de</strong> automação bancária e automaçãocomercial <strong>de</strong>stinados aos mercados brasileiro e internacional. Em <strong>2012</strong>, a receita da Unida<strong>de</strong> foi <strong>de</strong> R$ 404,0 milhões, superiorem 6,3% à reportada no ano anterior, resultado da expedição <strong>de</strong> 8,0 mil ATMs, da expansão na comercialização <strong>de</strong> softwares eimplantação <strong>de</strong> projetos <strong>de</strong> biometria para instituições bancárias, e projetos que incluíram a substituição <strong>de</strong> impressoras fiscais,que contribuíram para o crescimento <strong>de</strong> mais <strong>de</strong> 90% no número <strong>de</strong> unida<strong>de</strong>s expedidas <strong>de</strong>sse produto em relação a 2011.O volume <strong>de</strong> ATMs expedidas em <strong>2012</strong> foi 4,1% inferior em relação ao ano anterior, em razão das menores entregas nomercado interno, principalmente relacionadas a contratos com bancos assinados em 2011. No mercado externo, foramentregues 343 ATMs para um gran<strong>de</strong> banco privado mexicano, conforme contrato firmado no ano anterior.No 4T12 a Unida<strong>de</strong> registrou receita líquida <strong>de</strong> R$ 125,4 milhões, montante 6,0% inferior ao registrado no quarto trimestre <strong>de</strong>2011 (4T11), em razão do menor volume <strong>de</strong> ATMs expedido no período. Com relação aos negócios realizados, <strong>de</strong>staque emAutomação Bancária para a concentração, no trimestre, <strong>de</strong> instalações da Plataforma <strong>de</strong> Biometria nas agências e postos <strong>de</strong>atendimento em um gran<strong>de</strong> banco privado nacional, que contribuirá para a otimização dos serviços, comodida<strong>de</strong> dos clientes eampliará os aspectos ligados à segurança da instituição.Em Automação Comercial, <strong>de</strong>staque para dois gran<strong>de</strong>s projetos ligados à substituição do parque instalado <strong>de</strong> impressorasfiscais. O primeiro, realizado para uma das maiores re<strong>de</strong>s <strong>de</strong> drogarias do Brasil, incluiu a substituição, no quarto trimestre, <strong>de</strong>todo o parque instalado da empresa em mais <strong>de</strong> 400 lojas. Todo o processo foi realizado em apenas nove horas, o que<strong>de</strong>monstra a capacida<strong>de</strong> técnica da re<strong>de</strong> <strong>de</strong> serviços da <strong>Itautec</strong> em atuar em gran<strong>de</strong>s projetos. O segundo incluiu acomercialização e instalação <strong>de</strong> impressoras para uma das maiores re<strong>de</strong>s <strong>de</strong> eletroeletrônicos do Brasil, visando a substituição<strong>de</strong> equipamentos e implantação <strong>de</strong> novas lojas. Ainda, foram realizados importantes negócios que incluíram a comercialização<strong>de</strong> terminais Ponto <strong>de</strong> Venda (PDVs) e terminais <strong>de</strong> consulta <strong>de</strong> preços para gran<strong>de</strong>s ca<strong>de</strong>ias varejistas, e suítes <strong>de</strong> softwares <strong>de</strong>gestão <strong>de</strong> loja para uma gran<strong>de</strong> re<strong>de</strong> <strong>de</strong> materiais <strong>de</strong> construção com presença no Estado <strong>de</strong> São Paulo. No mercadointernacional, foi realizada a instalação <strong>de</strong> 140 terminais <strong>de</strong> autoatendimento para uma empresa ligada ao setor <strong>de</strong> transportesno México. O projeto, que engloba serviços <strong>de</strong> monitoramento e manutenção, contribuiu para a expansão e diversificação dosnegócios da <strong>Itautec</strong> naquele país.UNIDADE SOLUÇÕES DE COMPUTAÇÃOA receita líquida da Unida<strong>de</strong> Soluções <strong>de</strong> Computação com a comercialização <strong>de</strong> microcomputadores (<strong>de</strong>sktops, notebooks,netbooks, tablets e servidores) e <strong>de</strong> soluções integradas e revenda <strong>de</strong> software em <strong>2012</strong> foi <strong>de</strong> R$ 700,4 milhões, inferior em2,9% a reportada em 2011, com 585,0 mil equipamentos comercializados, volume 6,4% maior em relação ao ano anterior.No segmento <strong>de</strong> Computação Pessoal, foram expedidos 375,3 mil equipamentos em <strong>2012</strong>, aumento <strong>de</strong> 18,5% em relação àsexpedições em 2011, resultado do fortalecimento do portfólio <strong>de</strong> produtos, do crescimento do número <strong>de</strong> pontos <strong>de</strong> venda, maiorregionalização, e da consistência na atuação junto às re<strong>de</strong>s varejistas, incluindo o treinamento das equipes <strong>de</strong> vendas. No ano,foram treinados 5,9 mil colaboradores <strong>de</strong> Clientes em diversas regiões do Brasil.Em Computação Corporativa, foram expedidos 209,7 mil equipamentos em <strong>2012</strong>, volume 10,0% menor em relação ao anoanterior, em razão da postergação dos investimentos pelas empresas. Destaque no exercício para a expedição <strong>de</strong> 7,5 mil All-in-Ones para o segmento <strong>de</strong> operadoras <strong>de</strong> Call Center, equipamentos que se diferenciam pela versatilida<strong>de</strong>, ergonometria,conectivida<strong>de</strong> e por ser um produto integrado, com economia <strong>de</strong> espaço e energia, afirmando-se como uma tendência para omercado corporativo e, 4,6 mil servidores, produtos <strong>de</strong>stinados a projetos <strong>de</strong> automação <strong>de</strong> agências bancárias e virtualização<strong>de</strong> estações <strong>de</strong> trabalho, e para expansão e atualização <strong>de</strong> datacenters para uma das principais empresas na área <strong>de</strong>computação em nuvem (cloud computing) e serviços <strong>de</strong> hospedagem <strong>de</strong> websites.5PÁGINA: 32 <strong>de</strong> 96