Análise-econômica-de-projetos-de-investimentos-para-expansão-da-produção-pecuária_Agroicone_INPUT

You also want an ePaper? Increase the reach of your titles
YUMPU automatically turns print PDFs into web optimized ePapers that Google loves.
3. RESULTADOS DAS ANÁLISES DE<br />
INVESTIMENTO: CASOS HIPOTÉTICOS<br />
DE FAZENDAS DE PECUÁRIA DE CORTE<br />
3.1. RESULTADOS PARA O CERRADO<br />
Os resultados <strong>de</strong> todos os cenários simulados, <strong>de</strong>talhando a TIR, o VPL e o payback por<br />
hectare e por ano <strong>para</strong> o bioma Cerrado encontram-se no Anexo 1 (proprie<strong>da</strong><strong>de</strong> <strong>de</strong> 3<br />
mil ha <strong>de</strong> área produtiva) e no Anexo 2 (proprie<strong>da</strong><strong>de</strong> <strong>de</strong> 300 ha <strong>de</strong> área produtiva).<br />
Avaliando o CENÁRIO 1 (intensificação <strong>da</strong> ativi<strong>da</strong><strong>de</strong> <strong>pecuária</strong> utilizando a área<br />
produtiva <strong>da</strong> proprie<strong>da</strong><strong>de</strong>), tanto <strong>para</strong> uma proprie<strong>da</strong><strong>de</strong> <strong>de</strong> 300 hectares quanto <strong>para</strong> a<br />
<strong>de</strong> 3 mil hectares, a maior rentabili<strong>da</strong><strong>de</strong> (VPL relativa) do projeto está na faixa <strong>de</strong> maior<br />
intensificação <strong>da</strong> ativi<strong>da</strong><strong>de</strong>, com maior TIR (a preços constantes <strong>de</strong> 2014) e menor<br />
payback <strong>de</strong>scontado. O mesmo comportamento é observado <strong>para</strong> a rentabili<strong>da</strong><strong>de</strong> <strong>da</strong><br />
<strong>pecuária</strong>, ou seja, é mais rentável quanto mais intensiva a <strong>produção</strong> por hectare.<br />
8 Para esta análise, a TIR foi<br />
calcula<strong>da</strong> utilizando custos <strong>de</strong><br />
<strong>produção</strong> e preços constantes<br />
em R$ <strong>de</strong> 2014. Para o cálculo<br />
do payback <strong>de</strong>scontado, foi<br />
utiliza<strong>da</strong> a taxa <strong>de</strong> inflação<br />
anual (5,85% ao ano) <strong>para</strong><br />
calcular a rentabili<strong>da</strong><strong>de</strong> anual<br />
acumula<strong>da</strong> a Valor Presente<br />
com TMA <strong>de</strong> 8,5%.<br />
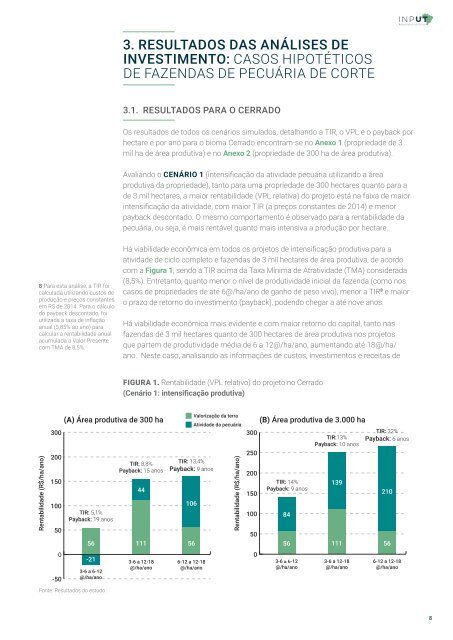
Há viabili<strong>da</strong><strong>de</strong> <strong>econômica</strong> em todos os <strong>projetos</strong> <strong>de</strong> intensificação produtiva <strong>para</strong> a<br />
ativi<strong>da</strong><strong>de</strong> <strong>de</strong> ciclo completo e fazen<strong>da</strong>s <strong>de</strong> 3 mil hectares <strong>de</strong> área produtiva, <strong>de</strong> acordo<br />
com a Figura 1, sendo a TIR acima <strong>da</strong> Taxa Mínima <strong>de</strong> Atrativi<strong>da</strong><strong>de</strong> (TMA) consi<strong>de</strong>ra<strong>da</strong><br />
(8,5%). Entretanto, quanto menor o nível <strong>de</strong> produtivi<strong>da</strong><strong>de</strong> inicial <strong>da</strong> fazen<strong>da</strong> (como nos<br />
casos <strong>de</strong> proprie<strong>da</strong><strong>de</strong>s <strong>de</strong> até 6@/ha/ano <strong>de</strong> ganho <strong>de</strong> peso vivo), menor a TIR 8 e maior<br />
o prazo <strong>de</strong> retorno do investimento (payback), po<strong>de</strong>ndo chegar a até nove anos.<br />
Há viabili<strong>da</strong><strong>de</strong> <strong>econômica</strong> mais evi<strong>de</strong>nte e com maior retorno do capital, tanto nas<br />
fazen<strong>da</strong>s <strong>de</strong> 3 mil hectares quanto <strong>de</strong> 300 hectares <strong>de</strong> área produtiva nos <strong>projetos</strong><br />
que partem <strong>de</strong> produtivi<strong>da</strong><strong>de</strong> média <strong>de</strong> 6 a 12@/ha/ano, aumentando até 18@/ha/<br />
ano. Neste caso, analisando as informações <strong>de</strong> custos, <strong>investimentos</strong> e receitas <strong>de</strong><br />
FIGURA 1. Rentabili<strong>da</strong><strong>de</strong> (VPL relativo) do projeto no Cerrado<br />
(Cenário 1: intensificação produtiva)<br />
Rentabili<strong>da</strong><strong>de</strong> (R$/ha/ano)<br />
300<br />
200<br />
150<br />
100<br />
50<br />
0<br />
-50<br />
(A) Área produtiva <strong>de</strong> 300 ha<br />
TIR: 5,1%<br />
Payback: 19 anos<br />
56<br />
-21<br />
3-6 a 6-12<br />
@/ha/ano<br />
Fonte: Resultados do estudo<br />
TIR: 8,8%<br />
Payback: 15 anos<br />
44<br />
111<br />
3-6 a 12-18<br />
@/ha/ano<br />
TIR: 13,4%<br />
Payback: 9 anos<br />
106<br />
56<br />
6-12 a 12-18<br />
@/ha/ano<br />
Valorização <strong>da</strong> terra<br />
Ativi<strong>da</strong><strong>de</strong> <strong>da</strong> <strong>pecuária</strong><br />
Rentabili<strong>da</strong><strong>de</strong> (R$/ha/ano)<br />
300<br />
250<br />
200<br />
150<br />
100<br />
50<br />
0<br />
(B) Área produtiva <strong>de</strong> 3.000 ha<br />
TIR: 14%<br />
Payback: 9 anos<br />
84<br />
56<br />
3-6 -21 a 6-12<br />
@/ha/ano<br />
TIR:13%<br />
Payback: 10 anos<br />
139<br />
111<br />
3-6 a 12-18<br />
@/ha/ano<br />
TIR: 22%<br />
Payback: 6 anos<br />
210<br />
56<br />
6-12 a 12-18<br />
@/ha/ano<br />
8