
You also want an ePaper? Increase the reach of your titles
YUMPU automatically turns print PDFs into web optimized ePapers that Google loves.
70 <strong>Manual</strong> <strong>para</strong> Análise <strong>de</strong> Inventário <strong>Florestal</strong> e Equação <strong>de</strong> Volume em Projetos <strong>de</strong> Manejo <strong>Florestal</strong> Sustentável - PMFS<br />
Figura 46 - Saída da estatística <strong>de</strong>scritiva gerada pelo Minitab.<br />
Descriptive Statistics: DAP(cm); H(m); Vreal<br />
Variable N N* Mean SE Mean StDev Minimum Q1 Median Q3<br />
DAP (cm) 300 0 78,50 1,05 18,14 44,25 65,33 74,80 88,65<br />
H(m) 300 0 17,577 0,216 3,747 7,870 14,908 17,620 20,148<br />
Vreal 300 0 7,052 0,222 3,839 2,112 4,435 5,958 8,645<br />
Variable Maximum<br />
DAP(cm) 153,11<br />
H(m) 28,400<br />
Vreal 27,788<br />
Nos gráficos gerados (Figuras 45, 47, 48, 49 e Quadro 4) <strong>de</strong>verá<br />
ser efetuado o seguinte ajuste: Eliminação dos outliers 14 . A eliminação<br />
<strong>de</strong>sses dados não afetará a representação real dos dados no campo,<br />
no entanto, <strong>de</strong>ve ser realizada com cautela (a forma <strong>de</strong> eliminação será<br />
tratada mais adiante).<br />
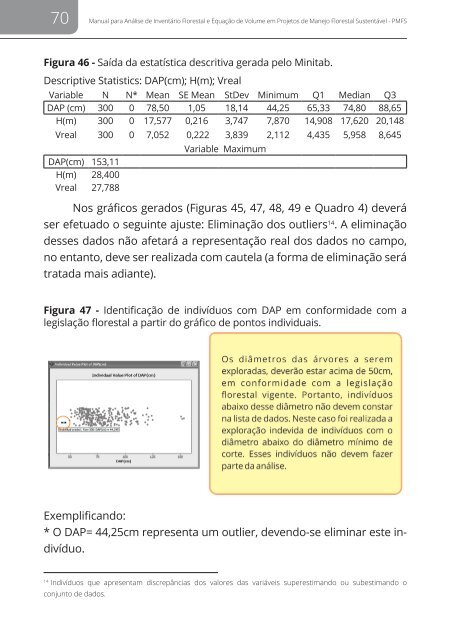
Figura 47 - I<strong>de</strong>ntificação <strong>de</strong> indivíduos com DAP em conformida<strong>de</strong> com a<br />
legislação florestal a partir do gráfico <strong>de</strong> pontos individuais.<br />
Exemplificando:<br />
* O DAP= 44,25cm representa um outlier, <strong>de</strong>vendo-se eliminar este indivíduo.<br />
14<br />
Indivíduos que apresentam discrepâncias dos valores das variáveis superestimando ou subestimando o<br />
conjunto <strong>de</strong> dados.