Studiu privind disparitatile existente la nivelul Regiunii de dezvoltare ...
Studiu privind disparitatile existente la nivelul Regiunii de dezvoltare ...
Studiu privind disparitatile existente la nivelul Regiunii de dezvoltare ...

You also want an ePaper? Increase the reach of your titles
YUMPU automatically turns print PDFs into web optimized ePapers that Google loves.
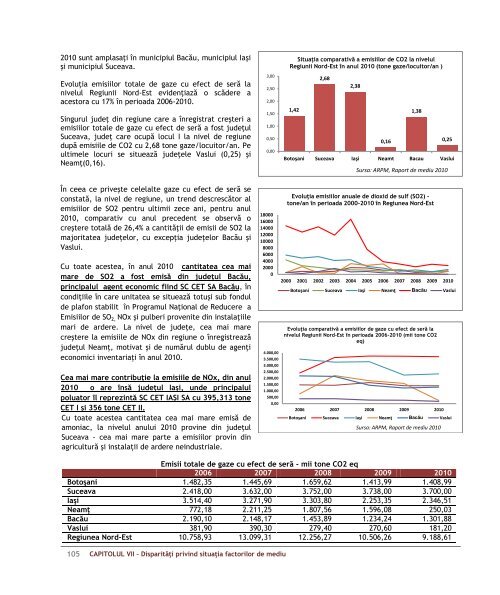
2010 sunt amp<strong>la</strong>saţi în municipiul Bacău, municipiul Iaşi<br />
şi municipiul Suceava.<br />
Evoluţia emisiilor totale <strong>de</strong> gaze cu efect <strong>de</strong> seră <strong>la</strong><br />
<strong>nivelul</strong> <strong>Regiunii</strong> Nord-Est evi<strong>de</strong>nţiază o scă<strong>de</strong>re a<br />
acestora cu 17% în perioada 2006-2010.<br />
Singurul ju<strong>de</strong>ţ din regiune care a înregistrat creşteri a<br />
emisiilor totale <strong>de</strong> gaze cu efect <strong>de</strong> seră a fost ju<strong>de</strong>ţul<br />
Suceava, ju<strong>de</strong>ţ care ocupă locul I <strong>la</strong> nivel <strong>de</strong> regiune<br />
după emisiile <strong>de</strong> CO2 cu 2,68 tone gaze/locuitor/an. Pe<br />
ultimele locuri se situează ju<strong>de</strong>ţele Vaslui (0,25) şi<br />
Neamţ(0,16).<br />
În ceea ce priveşte cele<strong>la</strong>lte gaze cu efect <strong>de</strong> seră se<br />
constată, <strong>la</strong> nivel <strong>de</strong> regiune, un trend <strong>de</strong>screscător al<br />
emisiilor <strong>de</strong> SO2 pentru ultimii zece ani, pentru anul<br />
2010, comparativ cu anul prece<strong>de</strong>nt se observă o<br />
creştere totală <strong>de</strong> 26,4% a cantităţii <strong>de</strong> emisii <strong>de</strong> SO2 <strong>la</strong><br />
majoritatea ju<strong>de</strong>ţelor, cu excepţia ju<strong>de</strong>ţelor Bacău şi<br />
Vaslui.<br />
Cu toate acestea, în anul 2010 cantitatea cea mai<br />
mare <strong>de</strong> SO2 a fost emisă din ju<strong>de</strong>ţul Bacău,<br />
principalul agent economic fiind SC CET SA Bacău, în<br />
condiţiile în care unitatea se situează totuşi sub fondul<br />
<strong>de</strong> p<strong>la</strong>fon stabilit în Programul Naţional <strong>de</strong> Reducere a<br />
Emisiilor <strong>de</strong> SO 2, NOx şi pulberi provenite din insta<strong>la</strong>ţiile<br />
mari <strong>de</strong> ar<strong>de</strong>re. La nivel <strong>de</strong> ju<strong>de</strong>ţe, cea mai mare<br />
creştere <strong>la</strong> emisiile <strong>de</strong> NOx din regiune o înregistrează<br />
ju<strong>de</strong>ţul Neamţ, motivat şi <strong>de</strong> numărul dublu <strong>de</strong> agenţi<br />
economici inventariaţi în anul 2010.<br />
Cea mai mare contribuţie <strong>la</strong> emisiile <strong>de</strong> NOx, din anul<br />
2010 o are însă ju<strong>de</strong>țul Iaşi, un<strong>de</strong> principalul<br />
poluator îl reprezintă SC CET IAŞI SA cu 395,313 tone<br />
CET I şi 356 tone CET II.<br />
Cu toate acestea cantitatea cea mai mare emisă <strong>de</strong><br />
amoniac, <strong>la</strong> <strong>nivelul</strong> anului 2010 provine din ju<strong>de</strong>ţul<br />
Suceava - cea mai mare parte a emisiilor provin din<br />
agricultură şi insta<strong>la</strong>ții <strong>de</strong> ar<strong>de</strong>re neindustriale.<br />
105 CAPITOLUL VII – Disparităţi <strong>privind</strong> situaţia factorilor <strong>de</strong> mediu<br />
3,00<br />
2,50<br />
2,00<br />
1,50<br />
1,00<br />
0,50<br />
0,00<br />
18000<br />
16000<br />
14000<br />
12000<br />
10000<br />
8000<br />
6000<br />
4000<br />
2000<br />
0<br />
4.000,00<br />
3.500,00<br />
3.000,00<br />
2.500,00<br />
2.000,00<br />
1.500,00<br />
1.000,00<br />
500,00<br />
0,00<br />
Situaţia comparativă a emisiilor <strong>de</strong> CO2 <strong>la</strong> <strong>nivelul</strong><br />
<strong>Regiunii</strong> Nord-Est în anul 2010 (tone gaze/locuitor/an )<br />
1,42<br />
2,68<br />
2,38<br />
0,16<br />
1,38<br />
0,25<br />
Botoşani Suceava Iaşi Neamt Bacau Vaslui<br />
Sursa: ARPM, Raport <strong>de</strong> mediu 2010<br />
Evoluţia emisiilor anuale <strong>de</strong> dioxid <strong>de</strong> sulf (SO2) -<br />
tone/an în perioada 2000-2010 în Regiunea Nord-Est<br />
2000 2001 2002 2003 2004 2005 2006 2007 2008 2009 2010<br />
Botoşani Suceava Iaşi Neamţ Bacău Vaslui<br />
Evoluţia comparativă a emisiilor <strong>de</strong> gaze cu efect <strong>de</strong> seră <strong>la</strong><br />
<strong>nivelul</strong> <strong>Regiunii</strong> Nord-Est în perioada 2006-2010 (mii tone CO2<br />
eq)<br />
2006 2007 2008 2009 2010<br />
Botoşani Suceava Iaşi Neamţ Bacău Vaslui<br />
Sursa: ARPM, Raport <strong>de</strong> mediu 2010<br />
Emisii totale <strong>de</strong> gaze cu efect <strong>de</strong> seră - mii tone CO2 eq<br />
2006 2007 2008 2009 2010<br />
Botoşani 1.482,35 1.445,69 1.659,62 1.413,99 1.408,99<br />
Suceava 2.418,00 3.632,00 3.752,00 3.738,00 3.700,00<br />
Iaşi 3.514,40 3.271,90 3.303,80 2.253,35 2.346,51<br />
Neamţ 772,18 2.211,25 1.807,56 1.596,08 250,03<br />
Bacău 2.190,10 2.148,17 1.453,89 1.234,24 1.301,88<br />
Vaslui 381,90 390,30 279,40 270,60 181,20<br />
Regiunea Nord-Est 10.758,93 13.099,31 12.256,27 10.506,26 9.188,61