

i
SSEInterims1617
SSEInterims1617

Create successful ePaper yourself
Turn your PDF publications into a flip-book with our unique Google optimized e-Paper software.
NETWORKS<br />
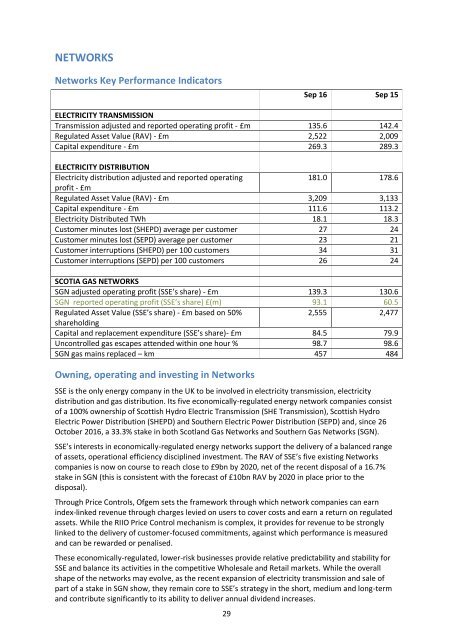
Networks Key Performance Indicators<br />
Sep 16 Sep 15<br />
ELECTRICITY TRANSMISSION<br />
Transmission adjusted and reported operating profit - £m 135.6 142.4<br />
Regulated Asset Value (RAV) - £m 2,522 2,009<br />
Capital expenditure - £m 269.3 289.3<br />
ELECTRICITY DISTRIBUTION<br />
Electricity distribution adjusted and reported operating<br />
181.0 178.6<br />
profit - £m<br />
Regulated Asset Value (RAV) - £m 3,209 3,133<br />
Capital expenditure - £m 111.6 113.2<br />
Electricity Distributed TWh 18.1 18.3<br />
Customer minutes lost (SHEPD) average per customer 27 24<br />
Customer minutes lost (SEPD) average per customer 23 21<br />
Customer interruptions (SHEPD) per 100 customers 34 31<br />
Customer interruptions (SEPD) per 100 customers 26 24<br />
SCOTIA GAS NETWORKS<br />
SGN adjusted operating profit (SSE’s share) - £m 139.3 130.6<br />
SGN reported operating profit (SSE’s share) £(m) 93.1 60.5<br />
Regulated Asset Value (SSE’s share) - £m based on 50%<br />
2,555 2,477<br />
shareholding<br />
Capital and replacement expenditure (SSE’s share)- £m 84.5 79.9<br />
Uncontrolled gas escapes attended within one hour % 98.7 98.6<br />
SGN gas mains replaced – km 457 484<br />
Owning, operating and investing in Networks<br />
SSE is the only energy company in the UK to be involved in electricity transmission, electricity<br />
distribution and gas distribution. Its five economically-regulated energy network companies consist<br />
of a 100% ownership of Scottish Hydro Electric Transmission (SHE Transmission), Scottish Hydro<br />
Electric Power Distribution (SHEPD) and Southern Electric Power Distribution (SEPD) and, since 26<br />
October 2016, a 33.3% stake in both Scotland Gas Networks and Southern Gas Networks (SGN).<br />
SSE’s interests in economically-regulated energy networks support the delivery of a balanced range<br />
of assets, operational efficiency disciplined investment. The RAV of SSE’s five existing Networks<br />
companies is now on course to reach close to £9bn by 2020, net of the recent disposal of a 16.7%<br />
stake in SGN (this is consistent with the forecast of £10bn RAV by 2020 in place prior to the<br />
disposal).<br />
Through Price Controls, Ofgem sets the framework through which network companies can earn<br />
index-linked revenue through charges levied on users to cover costs and earn a return on regulated<br />
assets. While the RIIO Price Control mechanism is complex, it provides for revenue to be strongly<br />
linked to the delivery of customer-focused commitments, against which performance is measured<br />
and can be rewarded or penalised.<br />
These economically-regulated, lower-risk businesses provide relative predictability and stability for<br />
SSE and balance its activities in the competitive Wholesale and Retail markets. While the overall<br />
shape of the networks may evolve, as the recent expansion of electricity transmission and sale of<br />
part of a stake in SGN show, they remain core to SSE’s strategy in the short, medium and long-term<br />
and contribute significantly to its ability to deliver annual dividend increases.<br />
29