Enrollment Management Strategic Plan 2012-2013 - Institutional ...
Enrollment Management Strategic Plan 2012-2013 - Institutional ...
Enrollment Management Strategic Plan 2012-2013 - Institutional ...

You also want an ePaper? Increase the reach of your titles
YUMPU automatically turns print PDFs into web optimized ePapers that Google loves.
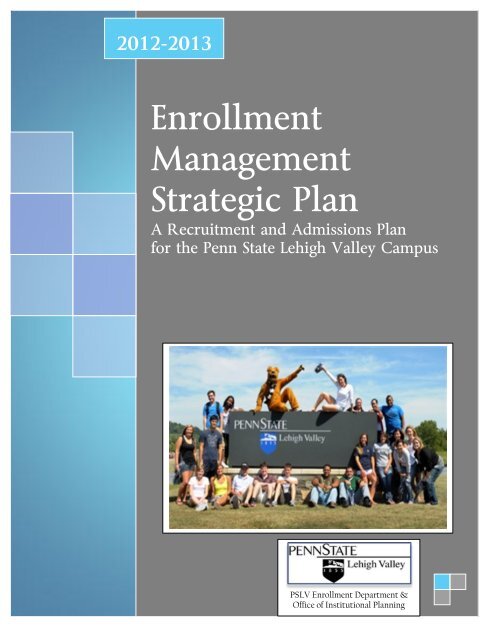
<strong>2012</strong>-<strong>2013</strong><br />
<strong>Enrollment</strong><br />
<strong>Management</strong><br />
<strong>Strategic</strong> <strong>Plan</strong><br />
A Recruitment and Admissions <strong>Plan</strong><br />
for the Penn State Lehigh Valley Campus<br />
Kristy Hove<br />
Penn State University<br />
PSLV <strong>Enrollment</strong> Department &<br />
1/1/<strong>2012</strong><br />
Office of <strong>Institutional</strong> <strong>Plan</strong>ning<br />
0
TABLE OF CONTENTS<br />
Mission Statement and Core Values 2<br />
Needs Assessment 3<br />
Service Area Population and High School <strong>Enrollment</strong> Data 4-5<br />
Penn State Lehigh Valley <strong>Enrollment</strong>: Trends and Projections 6-7<br />
Realistic Context: SWOT Analysis of <strong>Enrollment</strong> <strong>Management</strong> 8<br />
The Stages of the Admissions Process 9<br />
Overview of Goals 10<br />
Goal 1: Increase <strong>Enrollment</strong> 11<br />
Goal 2: Develop Awareness 14<br />
Goal 3: Create Communications 16<br />
Goal 4: Continuously Improve 18-19<br />
Performance Indicators 20-21<br />
Linkages to Campus <strong>Strategic</strong> <strong>Plan</strong>s 22-23<br />
Organizational Chart 24<br />
Appendices 25<br />
-Current Service Area Population Chart, by County and State<br />
-Visual: Population Projects for the Lehigh Valley<br />
-Population Projections 2010-40 from Lehigh Valley <strong>Plan</strong>ning Commission<br />
-National Graduation Trends for 2008-9 to 2020-21<br />
-High School <strong>Enrollment</strong> Figures for Lehigh and Northampton Counties<br />
-Visual: Growth in <strong>Enrollment</strong> of Selected School Districts, PSLV Service Area<br />
-Penn State Lehigh Valley <strong>Enrollment</strong> Trends Chart<br />
-Penn State Lehigh Valley Overall Minority <strong>Enrollment</strong> Trends and Comparisons Charts<br />
-Minority Break-out Tables (Hispanic, Black, and Asian)<br />
-Minority Breakdowns Related to Lehigh and Northampton Counties<br />
-Penn State <strong>Enrollment</strong> by County<br />
-Visual: Counties of Enrolled Students, PSLV, 2011<br />
-Freshmen Profile 2011, 2009, 2002: GPA, Class Rank, and SAT Scores<br />
-Minimum Evaluation Index (EI) 2009-2011<br />
-Retention and Graduation Rates/Trends<br />
-<strong>Enrollment</strong> Snapshot for <strong>2012</strong>-13 Incoming Class<br />
-Penn State Lehigh Valley Actual and Projected <strong>Enrollment</strong>s Table<br />
-Updated: <strong>Enrollment</strong> Data for <strong>2012</strong>, including Minority Population Figures<br />
1
ENROLLMENT MANAGEMENT<br />
MISSION STATEMENT<br />
The Penn State Lehigh Valley <strong>Enrollment</strong> <strong>Management</strong> Department will recruit,<br />
counsel, and enroll an academically-prepared, diverse student body through<br />
effective communication strategies, high-quality educational programming,<br />
student-centered services, and informed decision-making that integrates other<br />
campus departments to ensure collaboration and intentionality of enrollment<br />
policies and processes.<br />
CORE VALUES OF ENROLLMENT MANAGEMENT<br />
The Penn State Lehigh Valley <strong>Enrollment</strong> <strong>Management</strong> Department has articulated<br />
the following values to guide the work and processes of the department.<br />
‣ Individualized Attention<br />
Recruiting and counseling one-on-one within a small campus setting that is student-centered,<br />
welcoming, and accessible<br />
‣ Professionalism<br />
Exhibiting a wide-ranging knowledge base that is showcased through high quality<br />
programming and services<br />
‣ Clarity and Communication<br />
Establishing clear and targeted information for prospective and current students, their<br />
families, and others in the community<br />
‣ Intentionality and Purpose<br />
Focusing on work that is necessary, data-driven, and results-based<br />
‣ Resourcefulness<br />
Solving problems in a creative and innovative manner and using current resources to develop<br />
new ones<br />
‣ Ethics<br />
Maintaining a high level of integrity to ensure that the right decisions are being made and to<br />
illicit a sense of trust from those outside the department<br />
‣ Collaboration<br />
Working together as an enrollment team while creating an interconnectedness to other<br />
campus departments<br />
2
NEEDS ASSESSMENT<br />
The <strong>Enrollment</strong> <strong>Management</strong> Department outlines the following needs:<br />
-Comprehensive Action <strong>Plan</strong><br />
The department needs a framework and structure to conduct work that is targeted and focuses on<br />
specific performance indicators so that progress can be continually monitored and assessed.<br />
-Recruitment of Target Populations<br />
There is a recognized need to recruit students from the following populations:<br />
-High School Students (traditional)<br />
-Transfer Students (from local community colleges)<br />
-Adults (non-traditional)<br />
-Athletes<br />
-First Generation Students<br />
-Analysis of Current and Potential Offerings<br />
The Department recognizes that there are many positive factors of the current context in which it<br />
operates. There is a need to articulate and evaluate these strengths and opportunities.<br />
However, the department also believes that “more prospective students would enroll, if Penn State<br />
Lehigh Valley had……”<br />
-Additional Academic Programs that allow students to graduate from the local campus<br />
-Facilities that include athletic buildings and fields<br />
-Housing for students who cannot and do not desire to commute<br />
-Scholarships and financial aid options to recruit a wider range of student populations<br />
-Action within a Realistic Context<br />
The need to continually evaluate the current context of the department (what is working well, what<br />
needs to be changed) and to assess the external community (demographics, competition) becomes<br />
increasingly important. The use of data will aid in making decisions that are purposeful and<br />
intentional.<br />
-Collaboration and Support<br />
There exists a need to work with other campus departments to ensure a seamless transition of<br />
services. Communication towards students should be clear and professional- this should be achieved<br />
through collaborative meetings and trainings to ensure that each department supports the work of the<br />
others.<br />
-Creativity, Innovation, and the Enthusiasm to Thrive and Grow<br />
The Department needs to understand what it does have to offer to prospective and current students,<br />
and, that at times, this may present challenges and the need for innovation and resourcefulness.<br />
3
SERVICE AREA POPULATION AND HIGH SCHOOL ENROLLMENT DATA<br />
As part of the comprehensive needs assessment, the following is included as a current look at the Penn<br />
State Lehigh Valley campus in regards to enrollment management data and figures. Detailed<br />
information, charts, and figures can be found in the Appendices Section.<br />
Lehigh Valley Service Area Demographics<br />
The service area of Penn State Lehigh Valley is comprised primarily of Lehigh and<br />
Northampton counties. In recent years, the campus has extended its reach to various other<br />
counties, including Carbon, Bucks, Monroe, and Montgomery counties in PA, and Warren<br />
County in New Jersey. Each of these counties has seen an increase in population over the last<br />
several years.<br />
Projections from the Lehigh Valley <strong>Plan</strong>ning Commission show that the region will continue to<br />
grow. According to the Lehigh Valley <strong>Plan</strong>ning Commission, the Lehigh Valley population will<br />
increase by 226,722 people from 2010 to 2040, which represents a 35% increase over these<br />
three decades.<br />
In particular, Lehigh County will increase by 11.5% per decade and Northampton County will<br />
increase by 11.9% per decade.<br />
Additional information about Lehigh Valley population trends can be found on pages<br />
26-28.<br />
National Graduation Trends and High School <strong>Enrollment</strong> Projections<br />
National enrollment figures show that many public high schools across the country will<br />
witness a decrease in high school enrollment figures through the year 2020-21. The largest<br />
decrease will be in the Northeast (-13%) followed by the Midwest (-6%). Meanwhile, the<br />
South and West will see increases in enrollment (7% and 4%, respectively).<br />
The Lehigh Valley service area will witness a slight decrease in overall public high school<br />
enrollments. Total enrollments (factoring in both increases and decreases in school districts in<br />
Lehigh and Northampton counties) will decrease by 1.5%, or 319 enrollments. Total enrollment<br />
for the 2020-2021 is set at 21,448 students (10 th -12 th grades).<br />
Throughout the Lehigh Valley, enrollment decreases and increases will occur, depending on<br />
the individual school district. Decreases in enrollment numbers in certain districts, despite the<br />
growth in population in the area, are partly due to an aging population that will no longer be<br />
enrolled in school. Increases in districts are contributed to the projected population migration<br />
into their service areas, primarily of families moving into the area from New York and New<br />
Jersey.<br />
4
According to the Pennsylvania Department of Education’s <strong>Enrollment</strong> Projections Model,<br />
school districts in the Lehigh Valley (Lehigh and Northampton County) that will show a<br />
decrease in enrollments include:<br />
-Allentown City SD<br />
-Catasauqua Area SD<br />
-Northern Lehigh SD<br />
-Northwestern Lehigh SD<br />
-Salisbury Township SD<br />
-Whitehall-Coplay SD<br />
-Bangor Area SD<br />
-Bethlehem Area SD<br />
-Nazareth Area SD<br />
-Pen Argyl SD<br />
-Saucon Valley SD<br />
School districts that will show an increase in enrollments include:<br />
-East Penn SD<br />
-Easton Area SD<br />
-Parkland SD<br />
-Northampton SD<br />
-Southern Lehigh SD<br />
-Wilson Area SD<br />
Informational charts with detailed school district break-outs can be found on pages<br />
29-31.<br />
5
PENN STATE LEHIGH VALLEY ENROLLMENT:<br />
TRENDS AND PROJECTIONS<br />
<strong>Enrollment</strong> Benchmarks and Trends<br />
<strong>Enrollment</strong> for the Penn State Lehigh Valley campus continues to increase each year. A fiveyear<br />
look at enrollments shows this increase:<br />
2011: 942 (2.4% increase from 2010)<br />
2010: 920 (9.5% increase from 2009)<br />
2009: 840 (2.9% increase from 2008<br />
2008: 816 (1.9% increase from 2007)<br />
2007: 801 (5.7% increase from 2006)<br />
A comparison to 2002 (the 10 year comparison for the <strong>2012</strong>-13 school year) shows that the<br />
campus grew by 208 enrollments (28.3%). The official <strong>2012</strong> census enrollment will be released<br />
in October <strong>2012</strong>, and this figure will be used to show a complete 10-year comparison.<br />
Breakdowns in enrollment trends show the following:<br />
-Gender: From 2002 to 2010, the percentage of male students continually decreased at a slight<br />
rate (from 61.5% in 2002 to 53.4% in 2010), making the gender split on campus closer to an<br />
even 50-50 split. In 2011, the percentage of males increased again to 55.5%. Gender trends will<br />
continue to be analyzed for male/female breakdowns.<br />
-Minority: The enrollment of minority students has continued to increase. In 2002, 15.3% of<br />
the total campus enrollment was of minority status. In 2011, this figure rose to 27.5%, a 12.2%<br />
increase.<br />
-Residency: In recent years, the number of students residing outside of Pennsylvania has risen,<br />
particularly those from New Jersey and other Northeastern states, with small numbers also<br />
from states as far as California and Texas. In 2009, 3.6% of students enrolled from outside PA.<br />
In 2010 that number rose to 4.2%, and in 2011 to 4.5%. In 2002, the figure was 2.9%<br />
-Grade Point Average and SAT Scores: GPAs for incoming freshmen has remained relatively<br />
the same. In 2011, the average GPA was 2.87. In 2010, it was 2.89. These are slight increases<br />
from 2.82 in 2002. Average SAT scores show some variations. In 2011, the average math score<br />
was 500; in 2009 it was 490; and in 2002, it was 513. In 2011, the average verbal score was 480;<br />
in 2009 it was also 480; and in 2002, it was 513.<br />
Detailed informational charts and data tables can be found on pages 32-47 including:<br />
Penn State Lehigh Valley <strong>Enrollment</strong> Trends Chart<br />
Penn State Lehigh Valley Overall Minority <strong>Enrollment</strong> Trends and Comparisons Charts<br />
Penn State Lehigh Valley Minority Breakout Tables (Hispanic, Black, and Asian)<br />
Penn State Lehigh Valley Minority Population Related to Lehigh and Northampton Counties<br />
Penn State Lehigh Valley <strong>Enrollment</strong> by County<br />
6
Freshmen Profile 2011, 2009, 2002: GPA, Class Rank, and SAT Scores<br />
Minimum Evaluation Index (EI) 2009-2011<br />
<strong>Enrollment</strong> Snapshot for <strong>2012</strong>-13 Incoming Class<br />
Penn State Lehigh Valley Actual and Projected <strong>Enrollment</strong> Table<br />
<br />
Retention and Graduation Rates<br />
Retention rates for the campus have varied over recent years, with rates fluctuating between<br />
71% and 83%. The current retention rate (based on data for freshmen who entered in<br />
Summer/Fall 2010 and enrolled again in Fall 2011) stands at 76.2%. The campus goal, included<br />
in the Core Council Recommendations, is 80%.<br />
Graduation rates for the campus have also varied over recent years, with rates fluctuating<br />
between 44% and 59% (based on six-year graduation figures), with the current rate standing<br />
at 47.1% for those who entered in Fall 2005. The campus continues to study these rates in an<br />
effort to increase six-year figures through various retention strategies.<br />
A breakdown of retention and graduation rates can be found on page 41.<br />
<strong>Enrollment</strong> Projections<br />
Based on population projections, including high school enrollment data, and an analysis of past<br />
and current enrollment trends, Penn State Lehigh Valley’s goal is to increase enrollments by<br />
10% each year.<br />
Included in this <strong>Strategic</strong> <strong>Plan</strong> is an <strong>Enrollment</strong> Prospectus on pages 44-45.<br />
7
REALITISTIC CONTEXT:<br />
SWOT ANALYSIS OF ENROLLMENT MANAGEMENT<br />
To assess the current environment in which the <strong>Enrollment</strong> <strong>Management</strong> Department operates, the<br />
Department engaged in the following SWOT Analysis.<br />
Strengths:<br />
What does the <strong>Enrollment</strong> Department do well?<br />
What unique resources can the Department draw on?<br />
What do others see as the Department’s strengths?<br />
-Small, friendly campus environment<br />
-Student-centered services<br />
-2+2 model<br />
-Additional majors being acquired<br />
-Minority enrollment matches current LV<br />
demographics<br />
-Current dual enrollment programs are successful<br />
-Penn State recognition and alumni pride<br />
Weaknesses:<br />
What could the Department improve?<br />
What are some resources that are lacking?<br />
What would those outside PSLV clarify as weaknesses?<br />
-Decreasing local high school populations (based on<br />
projections)<br />
-Lack of dorms<br />
-Limited facilities, especially sports-related<br />
-Limited resources for marketing<br />
-Limited scholarships/financial aid<br />
Opportunities:<br />
What opportunities are open to the <strong>Enrollment</strong> Department?<br />
What trends are occurring that can be of advantage?<br />
Which strengths can be turned into opportunities?<br />
-Dedicated enrollment management staff<br />
-Growing LV minority population<br />
-Marketing, especially use of website and social media<br />
(takes staff resources, but no real “cost”)<br />
-Dual <strong>Enrollment</strong> Programs Model (create Emerging<br />
Business, Educators, etc.)<br />
-STEM-based programming options (grant funding<br />
availability)<br />
-LPN credit courses<br />
-RN to BSN Program (investigate the need and<br />
sustainability)<br />
Threats:<br />
Which factors in the environment could be harmful?<br />
What threats are exposed by the above weaknesses?<br />
Who is the competition?<br />
What are their strengths in comparison to our strengths?<br />
-Local community colleges offer numerous academic<br />
programs at a lesser cost<br />
-Penn State scandal<br />
-Perception and lack of information surrounding<br />
potential privatization<br />
8
THE STAGES OF THE ADMISSIONS PROCESS<br />
Awareness<br />
Application<br />
Acceptance<br />
Attendance<br />
Stage 1: Awareness<br />
Penn State Lehigh Valley’s <strong>Enrollment</strong> Department supports a variety of student and<br />
community awareness-based programs (such as High School Visits, Dual <strong>Enrollment</strong>, Student Athlete<br />
Leadership Program, Summer Camps, etc.) and develops a consistent marketing plan to showcase the<br />
offerings and options of the campus to prospective students.<br />
Stage 2: Application<br />
Penn State Lehigh Valley’s <strong>Enrollment</strong> Department encourages prospective students to apply<br />
to the campus through enrollment programs such as Application Nights, Open Houses, etc. and<br />
enhances this admission process through student-centered support and collaboration with other<br />
campus departments.<br />
Stage 3: Acceptance<br />
Penn State Lehigh Valley’s <strong>Enrollment</strong> Department welcomes new students to the campus via<br />
its acceptance process, including a comprehensive New Student Orientation supported by campus<br />
faculty and staff, while continually promoting the campus’ commitment to diversity and inclusion.<br />
Stage 4: Attendance<br />
Penn State Lehigh Valley’s <strong>Enrollment</strong> Department works with the Registrar’s Office and the<br />
Department of Academic Support Services to efficiently register students and then focuses on efforts<br />
to retain each and every student through student-centered services and programs.<br />
9
OVERVIEW OF GOALS<br />
Based on the comprehensive needs assessment, SWOT Analysis, and Application Model, the<br />
<strong>Enrollment</strong> <strong>Management</strong> Division has developed the following goals:<br />
GOAL ONE:<br />
Increase campus enrollment<br />
GOAL TWO:<br />
Develop awareness programming to reach and educate various members of<br />
the community<br />
GOAL THREE:<br />
Create a unified communications strategy that conveys clear, targeted<br />
information<br />
GOAL FOUR:<br />
Continuously improve processes and policies to ensure intentionality and<br />
purposefulness<br />
The subsequent pages outline each goal with strategies and action plans.<br />
10
GOAL 1:<br />
Increase campus enrollment<br />
Strategy 1.1:<br />
Develop strategies to increase applications to Penn State Lehigh Valley<br />
Actions Needed:<br />
Responsibility/Collaboration:<br />
+Set a target of 10% increase of enrollment each year, outlined by an <strong>Enrollment</strong><br />
Projection Sheet<br />
-<strong>Enrollment</strong> Department<br />
+ Aim for an increase from 450 applications to 800 applications in the next year<br />
+Improve yield rates (including the current 50% rate of direct applications and the<br />
15% rate of referral applications; target of 60% for direct applications)<br />
+Place a concentrated, yet realistic, emphasis on referral offers (target of<br />
approximately 20% from current 15%), by emphasizing “go to Penn State” and<br />
reaching out with additional information re: Honors Program, travel abroad<br />
options, research and labs, and alumni network<br />
+Set specific application dates with contests for application (see <strong>2012</strong>-13<br />
enrollment calendar)<br />
+Continue to expand service area to NY and NJ through community college<br />
recruitment and targeted marketing<br />
+Implement specific program and initiatives to increase applications<br />
Strategy 1.2:<br />
Improve application yield through specific enrollment programs<br />
Actions Needed:<br />
Responsibility/Collaboration:<br />
+Develop a comprehensive enrollment program schedule with events and<br />
workshops outlined in a calendar format, along with an event continuum that is<br />
shared among enrollment staff and accessible to the campus<br />
For all: Open Houses, Career Exploration Nights, Application Nights, Tours, etc.<br />
Others include:<br />
+For traditional high school students:<br />
-High School Visits<br />
-Academic Program Nights<br />
-Offer Programs<br />
-PSLV Program Invitation (ie. Battle of the Bands)<br />
-<strong>Enrollment</strong> Department<br />
-<strong>Enrollment</strong> Specialists and<br />
Transfer Admissions<br />
Specialist specifically (as part<br />
<strong>Enrollment</strong> Team)<br />
-Other campus departments<br />
(faculty and staff) to<br />
promote programs and<br />
assist in implementation<br />
11
+For transfer students:<br />
-Community College Visits<br />
-Articulation Agreement workshops<br />
+For adults/non-traditional students:<br />
-Awareness programs to showcase degree completion options at PSLV<br />
+For athletes:<br />
-Continue to offer SALT Program to showcase<br />
campus offerings and services<br />
-Offer awareness programs targeted at athletes at high school sites<br />
-Build on current athletes’ influence of campus support and pride<br />
-Ensure recruited athletes are academically qualified; aim at 100 recruited<br />
athletes<br />
continued from above<br />
+For first generation and/or low-income students:<br />
-Investigate free lunch lists from guidance counselors in order to waive the<br />
application fee<br />
-Work with guidance counselors to identify first generation students who may<br />
need application assistance<br />
-Work with the Hispanic Chamber and the Office of Minority Recruitment at<br />
UP to identify potential applicants and to support enrollment programming<br />
Strategy 1.3:<br />
Continue to offer program and degree-completion options that appeal to a range of<br />
populations<br />
Actions Needed:<br />
Responsibility/Collaboration:<br />
+Continue to market options:<br />
-2+2 options to start at LV and complete at UP<br />
-2+2 options for transfer students to complete at LV<br />
-4 year degree programs to complete at LV<br />
+Continually investigate program options based on student interest and labor<br />
market needs ; share these findings with administration and advocate for new<br />
programs<br />
Strategy 1.4:<br />
Provide excellent student services and quality information<br />
Actions Needed:<br />
+Provide ongoing training and professional development (at least one per PD<br />
program per semester per staff) for admissions/enrollment staff<br />
+Educate students on policies related to student aid by continuing the 2 Financial<br />
Aid Programs in the Spring and investigating the possibility of a workshop that can<br />
be offered at high schools in the Fall<br />
-<strong>Enrollment</strong> Department<br />
-Academic <strong>Management</strong><br />
Committee for program<br />
options<br />
-University Relations for<br />
marketing<br />
- <strong>Institutional</strong> <strong>Plan</strong>ning<br />
Responsibility/Collaboration:<br />
-<strong>Enrollment</strong> Department<br />
-Human Resources<br />
-Financial Aid (<strong>Enrollment</strong><br />
Department)<br />
12
+ Continue to work with Academic Support Services Department to coordinate<br />
student services and refine offerings, including the “What’s Next” Campaign in the<br />
spring semester<br />
+Administer a Student Satisfaction Survey to all current students that also looks at<br />
their transitional process from fall to spring semester (see Initiative 4.4)<br />
-Academic Support Services<br />
-Office of <strong>Institutional</strong><br />
<strong>Plan</strong>ning<br />
+Provide quality information about the Admissions Process<br />
+Respond efficiently to student questions<br />
Strategy 1.5:<br />
Increase retention rates, working towards a goal of 80%<br />
Actions Needed:<br />
+Recruit students that are educationally and socially prepared for college<br />
enrollment at PSLV<br />
+Increase local scholarships and student aid resources<br />
+Work in collaboration with Academic Support Services to offer the most suitable<br />
and beneficial programming for students, including Early Alert guidelines as an<br />
intervention for struggling/at-risk students and a check-in for provisional students<br />
+Monitor retention rates from year to year to identify trends and show increases<br />
Responsibility/Collaboration:<br />
-<strong>Enrollment</strong> Department<br />
-Financial Aid (as part of<br />
<strong>Enrollment</strong> Department)<br />
-Academic Support Services<br />
Department<br />
-Office of <strong>Institutional</strong><br />
<strong>Plan</strong>ning<br />
+Investigate the development of a Mentorship Program for special populations<br />
13
GOAL 2:<br />
Develop programming to reach and educate various members of the community<br />
Strategy 2.1: Maintain and develop options for high school students that may lead to increased<br />
enrollment at Penn State Lehigh Valley<br />
Actions Needed:<br />
+Continue to support Dual <strong>Enrollment</strong> Programs, High School Visits, College Fairs,<br />
and Financial Aid workshops for high school students<br />
+Continue to offer and increase participation in SALT (Student Athlete Leadership<br />
Training) Program<br />
+Continue to redevelop the Spend a Summer Evening , Open House, and Offer<br />
Programs to find formats that best showcases the programs and offerings of PSLV<br />
Responsibility/Collaboration:<br />
-<strong>Enrollment</strong> Department<br />
-Registrar’s Office and<br />
Continuing Education<br />
Department<br />
-Other campus departments<br />
involved with programming<br />
Strategy 2.2: Investigate the offering of parent programs to educate on the college admissions process,<br />
financial aid, and other pertinent information<br />
Actions Needed:<br />
+Seek out models of parent programs from other PSU campuses and other<br />
universities/colleges<br />
+Begin outlining a parent program with specific objectives and resources<br />
Responsibility/Collaboration:<br />
-<strong>Enrollment</strong> Department<br />
-Other PSU campuses<br />
-Office of <strong>Institutional</strong><br />
<strong>Plan</strong>ning<br />
Strategy 2.3: Offer high school guidance counselor functions<br />
Actions Needed:<br />
+Set-up meetings with guidance counselors at high school<br />
Responsibility/Collaboration:<br />
-<strong>Enrollment</strong> Department<br />
+Arrange for guidance counselors to visit PSLV for Guidance Counselor Luncheons<br />
or other events<br />
+Add guidance counselors to Constant Contact newsletter list so they can get<br />
pertinent, timely information about enrollment processes and PSLV<br />
programs/events, including a “Welcome Back” email in September and a<br />
notification about Career Exploration Nights<br />
14
Strategy 2.4: Collaborate with the Department of Continuing Education to offer 3 rd -8 th grade<br />
programming that begins to showcase the campus to students at an early age<br />
Actions Needed:<br />
+Hold a preliminary meeting with the Department of Continuing Education to<br />
discuss programs and initiatives that the <strong>Enrollment</strong> Department could support<br />
+Identify models of youth programming at other PSU campuses and other<br />
universities/colleges that are linked to campus enrollment initiatives<br />
Responsibility/Collaboration:<br />
-<strong>Enrollment</strong> Department<br />
-Department of Continuing<br />
Education<br />
-Office of <strong>Institutional</strong><br />
<strong>Plan</strong>ning<br />
15
GOAL 3:<br />
Create a unified communications strategy that conveys clear, targeted information<br />
Strategy 3.1: Increase awareness of academic programs, options, and offerings at Penn State Lehigh<br />
Valley<br />
Actions Needed:<br />
+ Further market 2+2 options including new programs in <strong>2012</strong>-13; Begin<br />
emphasizing 2+2 or stay for 4<br />
+ Showcase campus research and hands-on learning opportunities<br />
+Invite prospective students to service-learning events and on-campus programs<br />
+Publicize academic programs old and new through social media, including<br />
Facebook advertising that is targeted by age/location, etc.<br />
Responsibility/Collaboration:<br />
-<strong>Enrollment</strong> Department<br />
-University Relations<br />
-Academic Affairs<br />
-Career Services<br />
+ Build up the PSLV web presence by making academics and student life more<br />
visually appealing, updating homepage info, and providing teasers more frequently<br />
+ Develop a campaign targeting summer courses, ease, timeframe, transferability;<br />
emphasize minors, options and pair-ability (tie to job options)<br />
Strategy 3.2: Emphasize campus messages that carry throughout the year<br />
Actions Needed:<br />
+ Identify themes for particular programming (depending on audience and intent),<br />
including:<br />
-Unity/Community<br />
-Finding your place, Finding your voice<br />
-Explore, Experience Decide (DUS)<br />
-Can’t spell LOVE without LV<br />
-One building, 7 degrees, hundreds of possibilities<br />
-Who WE ARE (tie in history, faculty, students, research, personalities)<br />
Responsibility/Collaboration:<br />
-<strong>Enrollment</strong> Department<br />
-University Relations<br />
-Academic Support Services<br />
+ Emphasize these themes throughout the campus (posters, bulletin boards,<br />
giveaways, collaborations with other departments) to ensure the messages are<br />
widely distributed and used<br />
16
Strategy 3.3: Continue to enhance and increase the use of social media to spread awareness of the<br />
campus<br />
Actions Needed:<br />
+ Actively focus on web site design<br />
+ Offer a staff and faculty workshop, in collaboration with University Relations, on<br />
the uses and advantages of social media<br />
Responsibility/Collaboration:<br />
-<strong>Enrollment</strong> Department<br />
-University Relations<br />
+Continue to emphasize and use the We Are 2016 Campaign<br />
+Establish a schedule for social media postings (Facebook and Twitter- 3 postings<br />
a day) and continue to utilize the Instagram group (psulehighvalley)<br />
+ Investigate the potential usage of 4square and Pinterest<br />
+ Develop a series of YouTube videos that capture student experiences, including<br />
most challenging class, first day memories, advice from Career Services,<br />
international travel, new friends, first internship/internship advice, degree<br />
programs, and staying at PSLV or transitions to other campuses<br />
17
GOAL 4:<br />
Continuously improve processes and policies to ensure<br />
intentionality and purposefulness<br />
Strategy 4.1: Integrate and involve other campus committees and departments to ensure a continuum<br />
of services for prospective and current students<br />
Actions Needed:<br />
+ Continue to meet weekly in an <strong>Enrollment</strong> <strong>Management</strong> meeting with other key<br />
staff members and faculty to share updates, resources, and ideas<br />
+Add a representative from University Relations and Advising to the weekly<br />
<strong>Enrollment</strong> <strong>Management</strong> meetings<br />
+Continue to promote an open exchange of information among the enrollment<br />
team and other campus offices throughout all stages of the enrollment,<br />
registration, and retention process<br />
+Coordinate enrollment events with the Office of Alumni and Corporate Relations<br />
to widen the audience and scope of events/programs<br />
Responsibility/Collaboration:<br />
-<strong>Enrollment</strong> Department<br />
-<strong>Enrollment</strong> <strong>Management</strong><br />
Committee<br />
-Academic Support Services<br />
-Office of Alumni and<br />
Corporate Relations<br />
Strategy 4.2: Address admission processes, including transfer admissions, to achieve greater<br />
effectiveness<br />
Actions Needed:<br />
+Seek to hire an <strong>Enrollment</strong> Specialist to aid in enrollment programs and<br />
recruitment<br />
+Continue to work with the Office of Academic Affairs to define articulation<br />
agreements and work with University Park for the appropriate approvals<br />
Responsibility/Collaboration:<br />
-<strong>Enrollment</strong> Department<br />
-Office of Academic Affairs<br />
Strategy 4.3: Engage in regular strategic planning, reviews, and evaluations<br />
Actions Needed:<br />
+Actively utilize this strategic plan to guide enrollment work<br />
+ Utilize enrollment trends, enrollment data, population information, and external<br />
planning resources to inform campus enrollment planning decisions and program<br />
design<br />
Responsibility/Collaboration:<br />
-<strong>Enrollment</strong> Department<br />
-Office of <strong>Institutional</strong><br />
<strong>Plan</strong>ning<br />
18
Strategy 4.4: Engage in regular data collection to measure student satisfaction, climate, program<br />
effectiveness, and others to guide the work of enrollment management<br />
+ Establish focus groups to survey 1 st year students and transfer students to gauge<br />
their initial perspectives about Penn State Lehigh Valley<br />
+ Conduct a survey of the prospective pool of students (via email list) about college<br />
expectations, awareness of Penn State Lehigh Valley options and programs,<br />
marketing methods, and others<br />
+Follow-up to the 2010 Student Satisfaction Survey of all PSLV students with a<br />
<strong>2012</strong>-13 Student Satisfaction Survey to compare data, show improvements, and<br />
identify areas of improvement and guide future programming<br />
-<strong>Enrollment</strong> Team<br />
-First Year Experience (FYE)<br />
Instructors<br />
-Office of <strong>Institutional</strong><br />
<strong>Plan</strong>ning<br />
Strategy 4.5: Continue to advocate for improvements within the enrollment process<br />
Actions Needed:<br />
+ Keep campus administration abreast of enrollment data and request key changes<br />
to enrollment processes, as needed<br />
+ Regularly pass along enrollment updates and recommendations to campus<br />
committees with the authority to make changes and action plans (Senior<br />
<strong>Management</strong>, Academic <strong>Management</strong>, etc.)<br />
+ Link to other PSU campuses to review their enrollment processes and bring new<br />
ideas back to PSLV<br />
Responsibility/Collaboration:<br />
-<strong>Enrollment</strong> Team<br />
-Campus Administration,<br />
Senior <strong>Management</strong> and<br />
Academic <strong>Management</strong><br />
Teams<br />
-Other PSU campuses<br />
+Pass along new enrollment process ideas to University Park via university<br />
committees, councils, and events in order to advocate for University-wide<br />
enrollment process changes, as warranted and necessary<br />
19
Goal 1:<br />
Increase campus enrollment<br />
PERFORMANCE INDICATORS<br />
Indicator Target Data Source<br />
Increase in enrollment<br />
by 10% per year<br />
Goal for <strong>2012</strong>: 1008<br />
Goal for <strong>2013</strong>: 1091<br />
<strong>Enrollment</strong> Trends Chart with<br />
census numbers<br />
Increase in applications 800 applications (increase from 450) Review of application numbers<br />
Increase in application yield rates<br />
Calendar of Programming and<br />
Event Continuum<br />
<strong>Enrollment</strong> of NJ and<br />
NY residents<br />
Evidence of enrollment<br />
programming<br />
<strong>Enrollment</strong> data and labor market<br />
trends<br />
Professional development<br />
Financial Aid workshops<br />
Collaboration with Academic<br />
Support Services<br />
10% increase of direct applications<br />
to 60% yield; 4% increase of<br />
referrals to 20% yield<br />
Completed calendar; posted for<br />
campus use<br />
Increased enrollment of NJ/NY<br />
students from 2011 to <strong>2012</strong> and<br />
<strong>2012</strong> to <strong>2013</strong><br />
Programs held for each target<br />
group; program evaluations<br />
Ongoing compilation of trends and<br />
data; use of information<br />
1 PD opportunity per enrollment<br />
staff per semester<br />
2 in Spring semester; investigation<br />
of fall workshop<br />
Support of “What’s Next”<br />
Campaign and other retention<br />
programs<br />
Review of paid accept numbers<br />
Calendar and web link<br />
Official census numbers/breakdown<br />
of residency (refer to<br />
<strong>Enrollment</strong> Trends Chart)<br />
<strong>Enrollment</strong> Team Program<br />
Info/Calendar of Events<br />
<strong>Institutional</strong> <strong>Plan</strong>ning reports<br />
Staff reviews<br />
Financial Aid reports<br />
<strong>Enrollment</strong> Team/Academic<br />
Support Services reports<br />
Retention rate<br />
Increase in retention rate<br />
(current rate, 76.2%)<br />
Goal 2:<br />
Develop programming to reach and educate various members of the community<br />
<strong>Institutional</strong> <strong>Plan</strong>ning<br />
retention trends reports<br />
Indicator Target Data Source<br />
High school programming<br />
Parent program<br />
Continuation of Dual <strong>Enrollment</strong>,<br />
SALT, and others<br />
Creation of parent program (or<br />
plans for program)<br />
<strong>Enrollment</strong> reports and<br />
participation numbers<br />
Program plan<br />
20
HS guidance counselors functions<br />
Evidence of contact and programs<br />
for counselors<br />
Constant Contact records;<br />
participation figures<br />
Youth Programming Collaboration with CE Dept. Youth program plans<br />
Goal 3:<br />
Create a unified communications strategy that conveys clear, targeted information<br />
Indicator Target Data Source<br />
Community and prospective<br />
student awareness<br />
Integrated campus messages<br />
Social media schedule<br />
Increased awareness due to<br />
targeted campaigns demonstrated<br />
by surveys and data collection and<br />
increased applications/ enrollments<br />
Development of specific themes;<br />
usage of themes by various campus<br />
departments and on website<br />
At least 3 postings to Facebook and<br />
Twitter each day; addition of other<br />
social media venues<br />
University Relations and<br />
<strong>Enrollment</strong> data; survey responses<br />
Programs and products utilizing<br />
specific themes<br />
Social media records<br />
YouTube series<br />
Development of at least 3 YouTube<br />
Video links<br />
videos depicting student<br />
experiences<br />
Goal 4:<br />
Continuously improve processes and policies to ensure intentionality and purposefulness<br />
Indicator Target Data Source<br />
Collaboration with campus<br />
departments<br />
Weekly <strong>Enrollment</strong> <strong>Management</strong><br />
Team meeting; Collaboration with<br />
Academic Support Services,<br />
University Relations, and Alumni<br />
Relations<br />
<strong>Enrollment</strong> <strong>Management</strong> Notes<br />
and <strong>Strategic</strong> <strong>Plan</strong> log to document<br />
collaborations<br />
<strong>Enrollment</strong> Specialist Position Hiring of <strong>Enrollment</strong> Specialist HR records<br />
Ongoing pursuit of agreements; <strong>Enrollment</strong> and Academic Affairs<br />
Articulation agreements<br />
approval by UP<br />
records<br />
<strong>Strategic</strong> <strong>Plan</strong> progress<br />
Data Collection<br />
Advocacy<br />
Ongoing achievement of strategic<br />
initiatives<br />
Collection of enrollment trends;<br />
Implementation of Student Focus<br />
Groups, Prospect Pool Survey, and<br />
Student Satisfaction Survey<br />
Passing along of data, findings, and<br />
ideas to administration and UP<br />
<strong>Strategic</strong> plan progress log<br />
<strong>Enrollment</strong> Trends Table from<br />
<strong>Institutional</strong> <strong>Plan</strong>ning; Survey data<br />
and reports<br />
Communication and reports to<br />
administration and UP<br />
21
LINKAGES TO CAMPUS STRATEGIC PLANS<br />
Goal 1:<br />
Increase campus enrollment<br />
Linkages to 2008-13 Campus<br />
<strong>Strategic</strong> <strong>Plan</strong><br />
Direct linkages to all of the<br />
initiatives under Goal 3:<br />
Aggressively recruit and enhance the<br />
retention of quality students<br />
In support of Goal 4:<br />
Enhance a student-centered<br />
environment by providing<br />
appropriate support services to meet<br />
the demands of a growing and<br />
diverse population<br />
Others:<br />
1.4: Help students with financial<br />
need to have access to a quality Penn<br />
State education<br />
1.5: Address obstacles to education<br />
that relate to a growing an diverse<br />
population<br />
2.7: Identify new markets for<br />
Academic Programs<br />
2.8: Design part-time options for<br />
adult students interested in<br />
pursuing academic programs<br />
Linkages to 2010-2015<br />
Diversity <strong>Strategic</strong> <strong>Plan</strong><br />
Direct linkages to all of Challenge 3:<br />
Recruiting and retaining a diverse<br />
student body:<br />
3.1: Remain a leader within the Penn<br />
State system in regards to the<br />
enrollment of diverse populations<br />
3.2: Increase adult enrollment to foster<br />
a more diverse student body<br />
3.3: Retain adult students from<br />
enrollment to graduation<br />
3.4: Retain a diverse student body<br />
Goal 2:<br />
Develop awareness<br />
programming to reach and<br />
educate various members of<br />
the community<br />
In collaboration with other<br />
departments:<br />
3.7: Increase membership in the Blue<br />
and White Society in order to have<br />
an increased presence in the<br />
community<br />
5.5: Continue to grow the campus’<br />
summer camp offerings<br />
8.3: Collaborate with public<br />
education entities to offer Penn<br />
State resources and services<br />
Part of a broader linkage with Goal 3,<br />
below:<br />
1.1: Promote a shared and inclusive<br />
understanding of diversity throughout<br />
the Penn State Lehigh Valley campus<br />
and the community<br />
22
Goal 3:<br />
Create a unified<br />
communications strategy<br />
that conveys clear, targeted<br />
information<br />
Goal 4:<br />
Continuously improve<br />
processes and policies to<br />
ensure intentionality and<br />
purposefulness<br />
In conjunction with University<br />
Relations and the campus at-large:<br />
1.8: Create and implement an<br />
appropriate marketing plan to<br />
promote the campus and academic<br />
programs in the region<br />
3.9: Promote campus climate of<br />
inclusion and respect<br />
5.3: Promote the accomplishments of<br />
faculty, students, and staff<br />
throughout the local community<br />
Direct link:<br />
3.1: Coordinate efforts to analyze<br />
recruitment and retention trends<br />
and data to provide direction for<br />
recruitment/retention action plans<br />
Part of a broader linkage with Goal 2,<br />
above:<br />
1.1: Promote a shared and inclusive<br />
understanding of diversity throughout<br />
the Penn State Lehigh Valley campus<br />
and the community<br />
In conjunction with the campus atlarge:<br />
1.2.A: Institute diversity-themed<br />
professional development sessions for<br />
faculty and staff<br />
23
ORGANIZATIONAL CHART FOR ENROLLMENT MANAGEMENT<br />
Tiffany Cresswell-Yeager<br />
Director of Student<br />
and <strong>Enrollment</strong> Services<br />
Mary Ann Hubick Mike Damweber Elena Douvanis<br />
Coordinator of Assistant Director Coordinator of <strong>Enrollment</strong><br />
Student Aid of Admissions Marketing & Social Media<br />
Angela Caputo<br />
Admissions Counselor<br />
Maria Printz<br />
Administrative Assistant<br />
24
APPENDICES<br />
SERVICE AREA DATA<br />
-Current Service Area Population Chart, by County and State 26<br />
-Visual of Lehigh and Northampton Counties Population Projections 27<br />
-Population Projections 2010-2040 from the Lehigh Valley <strong>Plan</strong>ning Commission 28<br />
-National Graduation Trends for 2008-9 to 2020-21 29<br />
-High School <strong>Enrollment</strong> Figures for Lehigh and Northampton Counties: Actual and Projected 30<br />
-Visual of Projected <strong>Enrollment</strong> Growth at Selected School Districts 31<br />
PENN STATE LEHIGH VALLEY ENROLLMENT<br />
-Penn State Lehigh Valley <strong>Enrollment</strong> Trends Chart 32<br />
-Penn State Lehigh Valley Overall Minority <strong>Enrollment</strong> Trends and Comparisons Charts 33<br />
-Minority Break-out Tables (Hispanic, Black, and Asian) 34<br />
-Minority Breakdowns Related to Lehigh and Northampton Counties 35<br />
-Penn State Lehigh Valley <strong>Enrollment</strong> by County 36<br />
-Visual of Counties of Enrolled Students, PSLV, 2011 37<br />
-Freshman Profile 2011, 2009, 2002: GPA, Class Rank, and SAT Scores 38-39<br />
-Minimum Evaluation Index (EI) 2009-2011 40<br />
-Retention and Graduation Rates/Trends 41<br />
-<strong>Enrollment</strong> Snapshot for <strong>2012</strong>-<strong>2013</strong> Incoming Class 42-43<br />
-Penn State Lehigh Valley Actual and Projected <strong>Enrollment</strong>s Table 44-45<br />
-Updated: <strong>2012</strong> <strong>Enrollment</strong> Profile 46<br />
-Updated: <strong>2012</strong> Minority Figures 47<br />
25
County<br />
2010<br />
Population<br />
Population by County (US Census Bureau)<br />
Selected Counties and States of Penn State Lehigh Valley Service Area<br />
2000<br />
Population<br />
Change in<br />
Population<br />
2000-2010<br />
2010<br />
White<br />
2010<br />
Black<br />
2010<br />
Asian<br />
2010<br />
Hispanic<br />
*<br />
2010<br />
Under 18<br />
years old<br />
Below<br />
poverty<br />
level<br />
**<br />
Lehigh 349,497 312,090 12.0% 79.1% 6.1% 2.9% 18.8% 23.7% 11.9%<br />
Northampton 297,735 267,066 11.5% 86.3% 5.0% 2.4% 10.5% 21.9% 8.8%<br />
Carbon 65,249 58,802 11.0% 95.8% 1.5% 0.5% 3.3% 20.8% 10.5%<br />
Bucks 525,249 597,635 4.6% 89.2% 3.6% 3.8% 4.3% 23.0% 4.9%<br />
Montgomery 799,874 750,097 6.6% 81.1% 8.7% 6.4% 4.3% 22.9% 5.6%<br />
Monroe 169,842 138,687 22.5% 77.2% 13.2% 2.1% 13.1% 23.9% 10.4%<br />
All<br />
Pennsylvania<br />
12,702,379 12,281,054 3.4% 81.9% 10.8% 2.7% 5.7% 22.0% 12.4%<br />
Warren County,<br />
NJ<br />
108,692 102,437 6.1% 90.3% 3.5% 2.5% 7.0% 23.6% 6.8%<br />
*Those of Hispanic ethnicity may also appear in a race category (white, black, etc.) and therefore percentages of race/ethnicity will not total an even 100%.<br />
Additional minority groups are not included within this table but are available through the US Census Bureau.<br />
**For the period 2006-2010<br />
Notes:<br />
-Monroe County has seen the greatest population growth of the counties within the PSLV service area, followed by Lehigh and Northampton counties.<br />
-Lehigh and Monroe counties have the highest percentage of Hispanic residents (18.8% and 13.1%% respectively), higher than the percentage of Hispanics in PA (5.7%).<br />
-Monroe County has the largest percentage of Black residents (13.2%), which is higher than the percentage of Blacks in PA (10.8%).<br />
-Montgomery and Bucks Counties have the highest percentage of Asian residents (6.4% and 3.8%, respectively), both higher than all of PA (2.7%).<br />
-All counties are similar in the number of residents 18 years and younger (range of 20.8% to 23.9), which mirrors the PA percentage (22.0%).<br />
-Lehigh County has the largest percentage of residents living below the poverty level (11.9%), which is slightly lower than all of PA (12.4%).<br />
Data from US Census Bureau Quick Facts; Compiled by Campus <strong>Institutional</strong> <strong>Plan</strong>ning, June <strong>2012</strong><br />
26
Population Projections for the Penn State Lehigh Valley Service Area<br />
Lehigh County<br />
+11.5% per decade<br />
from 2010-2040<br />
Northampton County<br />
+11.9% per decade<br />
from 2010-2040<br />
Total Lehigh Valley Population Growth<br />
2010-2040<br />
+35%<br />
Figures from Lehigh Valley <strong>Plan</strong>ning Commission, May/June/July <strong>2012</strong> Newsletter<br />
27
LEHIGH VALLEY PLANNING COMMISSION POPULATION PROJECTIONS for 2010-2040: An Additional Look at the Data<br />
According to the May/June/July <strong>2012</strong> Newsletter of the Lehigh Valley <strong>Plan</strong>ning Commission:<br />
-The Lehigh Valley will increase by 35% from 2010 to 2040. Lehigh County will increase 11.5% per decade, while Northampton County will increase<br />
11.9% per decade.<br />
-Northampton County is expected to experience 1.33 times as much net migration as Lehigh County (due to its closer proximity to New York and New<br />
Jersey).<br />
-In regards to birth and death rates, Lehigh County will increase by more people due to a higher fertility rate, while Northampton County will decrease<br />
by 3,795 due to its birth and death rates. But, due to the migration into Northampton County (larger than the migration into Lehigh County), net<br />
growth among the two counties is projected to be: Lehigh, +119,935, and Northampton, +106,238<br />
-The population’s age distribution will change dramatically due to an aging baby boomer generation. All age levels will show an increase, however the<br />
two age groups with the highest increase will be the 70-74 age group and the 75+ age group (each showcasing almost 100% increases).<br />
28
NATIONAL GRADUATION TRENDS: National Center for Education Statistics<br />
-There is a projected 1% decrease in national public high school enrollments between 2008-9 and 2020-21.<br />
-Increases are projected for 23 states; while decreases are projected for 27 states and the District of Columbia.<br />
-Regionally, the following breakdowns are expected:<br />
Northeast (-13%) Midwest (-6%) South (+7%) West (+4%)<br />
Graphic Source: National Center for Education Statistics<br />
29
High School <strong>Enrollment</strong> Figures: Actual and Projections<br />
Lehigh County and Northampton County<br />
2010-2011<br />
(10-12 grades)<br />
2020-2021<br />
(10-12 grades)<br />
Number Change<br />
(from 2010/11 to<br />
2020/21)<br />
Percentage Change<br />
(from 2010/11 to<br />
2020/21)<br />
LEHIGH COUNTY<br />
Allentown City SD 3350 3140 -210 -6.3<br />
Catasauqua Area SD 380 324 -56 -14.7<br />
East Penn SD 1956 2164 208 10.6<br />
Northern Lehigh SD 496 380 -116 -23.4<br />
Northwestern Lehigh SD 433 376 -57 -13.2<br />
Parkland SD 2355 2503 148 6.3<br />
Salisbury Township SD 426 367 -59 -13.8<br />
Southern Lehigh SD 746 786 40 5.4<br />
Whitehall-Coplay SD 1073 1031 -42 -3.9<br />
Totals (Lehigh) 11,215 11,071 -144 -1.3%<br />
NORTHAMPTON COUNTY<br />
Bangor Area SD 850 707 -143 -16.8<br />
Bethlehem Area SD 3524 3473 -51 -1.4<br />
Easton Area SD 2022 2115 93 4.6<br />
Nazareth Area SD 1198 1184 -14 -1.2<br />
Northampton SD 1394 1410 16 1.1<br />
Pen Argyl SD 452 406 -46 -10.2<br />
Saucon Valley SD 597 546 -51 -8.5<br />
Wilson Area SD 515 536 21 4.1<br />
Totals (Northampton) 10,552 10,377 -175 -1.7<br />
Totals (Lehigh and Northampton) 21,767 21,448 -319 -1.5%<br />
-All School District Figures are credited towards PA Department of Education <strong>Enrollment</strong> Projections Model<br />
-Additional figures and data compiled by PSLV Office of <strong>Institutional</strong> <strong>Plan</strong>ning, June <strong>2012</strong><br />
30
Projected <strong>Enrollment</strong> Growths in Selected School Districts within the PSLV Service Area, from 2011-12 to 2020-2021<br />
NJ Schools =<br />
+4.4%<br />
(through 2016)<br />
Lehigh County<br />
Northampton County<br />
East Penn +10.6% Easton Area +4.6%<br />
Parkland +6.3% Wilson Area +4.1%<br />
Southern Lehigh +5.4% Northampton +1.1%<br />
Source: PA Department of Education<br />
NJ Figure: National Center for Education Statistics<br />
31
PENN STATE LEHIGH VALLEY:<br />
Year<br />
Total<br />
<strong>Enrollment</strong><br />
ENROLLMENT TRENDS<br />
Gender Minority Age Residency Level<br />
Male Female (non-white,<br />
% excludes “declined<br />
to report”)<br />
23 and<br />
below<br />
24 and<br />
above<br />
PA<br />
Resident<br />
Non-PA<br />
Resident<br />
Undergrad<br />
Grad<br />
2011<br />
942<br />
522<br />
55.5%<br />
420<br />
44.5%<br />
258<br />
Includes 4<br />
international students<br />
27.5%<br />
758<br />
80.5%<br />
184<br />
19.5%<br />
900<br />
95.5%<br />
42<br />
4.5%<br />
915<br />
97%<br />
27<br />
3%<br />
2011<br />
Comparison to<br />
2010 by<br />
Numbers of<br />
Students<br />
+22<br />
Total Students<br />
+31<br />
Male<br />
students<br />
-9<br />
Female<br />
students<br />
+24<br />
Minority<br />
students<br />
-4<br />
Trad.<br />
Students<br />
+26<br />
Non-trad.<br />
students<br />
+19<br />
PA<br />
residents<br />
+3<br />
Non-PA<br />
residents<br />
+1<br />
Undergrad<br />
students<br />
+21<br />
Graduate<br />
students<br />
2010<br />
(YR2 at CV)<br />
920 (491)<br />
53.4%<br />
(429)<br />
46.6%<br />
(234), includes 7<br />
international students<br />
25.4%<br />
(762)<br />
82.8%<br />
(158)<br />
17.2%<br />
(881)<br />
95.8%<br />
(39)<br />
4.2%<br />
(914)<br />
99.3%<br />
(6)<br />
.06%<br />
2009<br />
(YR1 at CV)<br />
840 (466)<br />
55.5%<br />
(374)<br />
44.5%<br />
(193) includes 4<br />
international students<br />
22.9%<br />
(670)<br />
79.8%<br />
(170)<br />
20.2%<br />
(810)<br />
96.4%<br />
(30)<br />
3.6%<br />
(824)<br />
98.1%<br />
(16)<br />
1.9%<br />
2008<br />
(Final YR at F)<br />
816 (476)<br />
58.3%<br />
(340)<br />
41.7%<br />
(185)<br />
22.6%<br />
(643)<br />
78.8%<br />
(173)<br />
21.2%<br />
(778)<br />
95.3%<br />
(38)<br />
4.7%<br />
(779)<br />
95.5%<br />
(37)<br />
4.5%<br />
2007 801 58.2% 41.8% 22.5% 80% 20% 95% 5% 96.5% 3.5%<br />
2006 758 56.5% 43.5% 18.1% 80% 20% 96.2% 3.8% 96.3% 3.7%<br />
2005 722 60% 40% 17.2% 73% 27% 96.3% 3.7% 93% 7%<br />
2004 680 62% 38% 16.9% 74% 26% 97.3% 2.7% 94.7% 5.3%
Minority <strong>Enrollment</strong> Trends for Penn State Lehigh Valley<br />
and Selected Local Penn State Campuses<br />
CAMPUS LEHIGH VALLEY BERKS HARRISBURG HAZLETON SCHUYLKILL WILKES-BARRE<br />
Current <strong>Enrollment</strong>:<br />
2011-<strong>2012</strong> School Year<br />
942 2873 4269 1172 1012 683<br />
Current Number of<br />
Minority Students<br />
Current Minority<br />
Percentage<br />
2010-2011<br />
Minority <strong>Enrollment</strong><br />
Percentage<br />
2009-10<br />
Minority <strong>Enrollment</strong><br />
Percentage<br />
258 660 1060 416 402 84<br />
27.5% 22.9% 24.8% 35.4% 39.7% 12.3%<br />
25.4% 20.1% 22.3% 34.2% 38.8% 10.6%<br />
22.9% 18.9% 19.6% 29.7% 34.4% 6.7%<br />
-Minority Student Population includes Hispanic/Latino; American Indian/Alaska Native; Asian; Black/African American; Native American/Other Pacific Islander; Two or<br />
More Races; and International.<br />
-Minority Population Figures do not include students who did not disclose a race (Unknown).<br />
33
MINORITY BREAK-OUT TABLES<br />
2011-<strong>2012</strong><br />
HISPANIC/LATINO<br />
<strong>Enrollment</strong><br />
Percentage of<br />
Total <strong>Enrollment</strong><br />
LEHIGH VALLEY BERKS HARRISBURG HAZLETON SCHUYLKILL WILKES-BARRE<br />
118 229 201 172 66 19<br />
12.5% 8.0% 4.7% 14.8% 6.5% 2.8%<br />
2011-<strong>2012</strong><br />
BLACK/AFRICAN<br />
AMERICAN <strong>Enrollment</strong><br />
Percentage of<br />
Total <strong>Enrollment</strong><br />
LEHIGH VALLEY BERKS HARRISBURG HAZLETON SCHUYLKILL WILKES-BARRE<br />
35 225 359 153 294 35<br />
3.7% 7.8% 8.4% 13% 29% 5.1%<br />
2011-<strong>2012</strong><br />
ASIAN<br />
<strong>Enrollment</strong><br />
Percentage of<br />
Total <strong>Enrollment</strong><br />
LEHIGH VALLEY BERKS HARRISBURG HAZLETON SCHUYLKILL WILKES-BARRE<br />
78 120 258 48 16 12<br />
8.2% 4.2% 6.0% 4.1% 1.6% 1.8%<br />
34
Minority Population Breakdown Tables<br />
Penn State Lehigh Valley Related to Service Area Counties<br />
Penn State<br />
Lehigh Valley<br />
Minority Percentage<br />
Lehigh Valley<br />
Service Area<br />
(Lehigh and<br />
Northampton Combined)<br />
Lehigh County<br />
Minority Percentage<br />
Northampton County<br />
Minority Percentage<br />
2011: 28%<br />
2010: 25.4%<br />
24% 28% 19%<br />
2009: 22.9%<br />
Penn State<br />
Lehigh Valley<br />
Lehigh Valley<br />
Service Area<br />
(Lehigh and Northampton<br />
Combined)<br />
Lehigh<br />
County<br />
Percentage<br />
Northampton<br />
County<br />
Percentage<br />
Hispanic 12.5% 14.9% 18.8% 10.5%<br />
African<br />
American/Black<br />
3.7% 5.5% 6.1% 5%<br />
Asian 8.2% 2.6% 2.9% 2.4%<br />
*Lehigh Valley, Lehigh County, and Northampton County data based on Census 2010.
County of Origin<br />
PENN STATE LEHIGH VALLEY ENROLLMENT BY COUNTY<br />
Number<br />
Percentage<br />
Fall 2011 at PSLV<br />
Number<br />
Percentage<br />
Fall 2010 at PSLV<br />
LEHIGH 495<br />
52.6%<br />
468<br />
50.8%<br />
NORTHAMPTON 259<br />
27.6%<br />
272<br />
29.6%<br />
BUCKS 69<br />
7.3%<br />
56<br />
6.0%<br />
MONROE 30<br />
3.2%<br />
19<br />
2.0%<br />
MONTGOMERY 18<br />
1.9%<br />
18<br />
2.0%<br />
CARBON 10<br />
1.0%<br />
10<br />
1.1%<br />
NJ Resident 11<br />
1.2%<br />
NY Resident 6<br />
0.6%<br />
-<strong>Enrollment</strong> numbers of students from Lehigh, Northampton, Bucks, and Monroe increased from 2010 to 2011. Numbers from Montgomery and Carbon remained the same.<br />
-The percentages of students from Lehigh and Northampton decreased slightly, while the percentages from Bucks and Monroe increased slightly from 2010-2011.<br />
-The percentages of students from Montgomery, Carbon and NJ/NY remained relatively the same from 2010 to 2011.<br />
14<br />
1.5%<br />
7<br />
0.8%<br />
36
Counties of Residence for Enrolled Students, Penn State Lehigh Valley, 2011<br />
1.0%<br />
%%<br />
52.6%<br />
%%<br />
3.2%<br />
%<br />
27.6%<br />
%%<br />
7.3%<br />
New Jersey 1.2%<br />
New York 0.6%<br />
Penn State<br />
Lehigh Valley<br />
1.9<br />
%%<br />
Data Source: EIS, Penn State, <strong>2012</strong><br />
37
Freshmen Profile: Grade Point Average, Class Rank, and SAT Scores<br />
-Incoming Freshmen for 2011, 2010 (1 year comparison), and 2006 (5 year comparison)<br />
AVERAGE GPA<br />
Incoming Year 2011 2010 2006<br />
Average GPA 2.87 2.89 2.93<br />
GPA BREAKDOWN<br />
Grade Point<br />
Average Category<br />
2011 2010 2006<br />
3.75 and higher 4.44% 3.5 or higher 6.67% 3.5 or higher 7.61% 3.5 or higher<br />
13.31%<br />
11.77%<br />
12.18%<br />
3.50 to 3.74 8.87% 5.1% 4.57%<br />
3.25 to 3.49 13.31% 15.56% 11.17%<br />
3.0 to 3.24 14.11% 14.44% 21.32%<br />
2.50 to 2.99 29.44% 31.85% 34.01%<br />
2.0 to 2.49 27.02% 2.49 or 22.22% 2.49 or below 19.29% 2.49 or lower<br />
below<br />
26.29%<br />
21.32%<br />
1.0 to 1.99 2.82% 29.84% 4.07% 2.03%<br />
38
CLASS RANK<br />
Percentage of High School<br />
Graduating Class 2011 2010 2006<br />
Top Tenth 4.93% 9.09% 8.70%<br />
Top Quarter 28.70% 26.09% 25.54%<br />
Top Half 65.92% 65.61% 71.74%<br />
Bottom Half 34.08% 34.39% 28.26%<br />
Bottom Quarter 8.97% 7.11% 9.24%<br />
Percentage submitting class rank 88.14% 93.36% 92.46%<br />
SAT SCORES<br />
SAT Range Critical Reading Math Writing<br />
2011 2010 2006 2011 2010 2006 2011 2010 2006<br />
700-800 2.64% 1.5% 1.55% 2.20% 1.98% 3.11% 0.44% 0.00% N/A<br />
600-699 9.96% 12.7% 12.95% 11.45% 16.67% 19.17% 7.96% 5.56% N/A<br />
500-599 34.36% 30.56 32.12% 37.00% 34.92% 35.23% 28.76% 31.75% N/A<br />
400-499 37.44% 40.08% 39.38% 37.44% 35.71% 31.61% 43.36% 45.63% N/A<br />
300-399 13.66% 13.49% 13.47% 11.45% 9.13% 9.84% 17.70% 15.48% N/A<br />
200-299 2.20% 1.59% 0.52% 0.44% 1.59% 1.04% 1.77% 1.59% N/A<br />
39
Minimum Evaluation Index (EI) Analysis<br />
Penn State Lehigh Valley<br />
2009-2011<br />
Total<br />
Between<br />
2.00-<br />
2.19<br />
NSCI<br />
American<br />
Indian or<br />
Alaskan<br />
Native<br />
Black<br />
American<br />
(Non-<br />
Hispanic)<br />
Asian<br />
American<br />
Native<br />
American<br />
or Other<br />
Pacific<br />
Islander<br />
Hispanic<br />
American<br />
or Puerto<br />
Rican<br />
White<br />
American<br />
(non-<br />
Hispanic,<br />
non-<br />
Puerto<br />
Rican)<br />
Foreign<br />
2011 18 0 2 4 0 3 9 0<br />
2010 18 0 0 4 0 2 11 0<br />
2009 17 0 1 4 0 5 7 0<br />
40
Retention Rates: Penn State Lehigh Valley<br />
For the cohort of all full-time bachelor's (or equivalent) degree-seeking undergraduate students who entered your institution as freshmen in fall XXX (or<br />
the preceding summer term), what percentage was enrolled at your institution as of the date your institution calculates it official enrollment in fall<br />
XXX?: ____%<br />
Year Retention Rate (Core Council Goal: 80%)<br />
Entered as freshmen in Summer/Fall 2010 and enrolled in Fall 2011 76.2%<br />
Entered as freshmen in Summer/ Fall 2009 and enrolled in Fall 2010 71.9%<br />
Entered as freshmen in Summer/Fall 2008 and enrolled in Fall 2009 77.9%<br />
Entered as freshmen in Summer/ Fall 2007 and enrolled in Fall 2008 76.2%<br />
Entered as freshman in Summer/ Fall 2006 and enrolled in Fall 2007 74.5%<br />
Entered as freshmen in Summer/Fall 2005 and enrolled in Fall 2006 71.6%<br />
Entered as freshmen in Summer/Fall 2004 and enrolled in Fall 2005 83.3%<br />
Graduation: Penn State Lehigh Valley (six year graduation rates)<br />
Year<br />
Entering<br />
PSLV<br />
Total<br />
Number<br />
Entering<br />
Completed<br />
in 4 years<br />
or less<br />
More<br />
than 4;<br />
5 or less<br />
More<br />
than 5;<br />
6 or<br />
less<br />
Total<br />
graduating<br />
within 6<br />
years<br />
Six year<br />
graduation<br />
rate<br />
Fall 2005 140 34 24 8 66 47.1%<br />
Fall 2004 156 40 37 7 84 53.8%<br />
Fall 2003 175 46 31 6 83 47.4%<br />
Fall 2002 174 45 40 10 95 54.6%<br />
Fall 2001 177 42 42 11 95 53.7%<br />
Fall 2000 158 39 33 5 77 48.7%<br />
Fall 1999 180 32 40 9 81 45.0%<br />
Core Council Goal:<br />
The Core Council recommends that the campus study its<br />
graduation rates to determine the reasons for the relatively<br />
lower graduation rates and the higher than average time-todegree,<br />
and to develop strategies to improve six-year<br />
graduation rates for students who remain at Lehigh Valley.<br />
*Students are counted in the cohort at the location where they<br />
began. Many students change locations in the process of<br />
completing their degree. Students are counted in the<br />
graduation rate regardless of the Penn State location where<br />
they graduate. (Source: Penn State Fact Book).<br />
41
<strong>Enrollment</strong> Snapshot for Fall <strong>2012</strong><br />
Incoming Undergraduate Freshman and Advanced Standing Students<br />
Total<br />
Number<br />
Fall <strong>2012</strong>*<br />
Gender Minority Residency Age Average<br />
High School GPA<br />
Average<br />
SAT Scores<br />
Male Female PA Non-PA 23 or < 24 or > (freshmen) Verbal Math<br />
Freshmen 242 63.2% 36.8% Combined<br />
figure<br />
Advanced Standing 54 42.6% 57.4% Combined<br />
figure<br />
92.6% 7.4% 99.6% 0.4% 3.10 482 504<br />
88.9% 11.1% 74.0% 26.0% N/A 506 506<br />
Total Incoming 296 59.5% 40.5% 28.9% 91.9% 8.1% 81.8% 18.2% 3.10 494 505<br />
*(Please Note: <strong>Enrollment</strong> figures for Fall <strong>2012</strong> are based on students in paid accept status; Official census figures will be recorded after the semester begins.)<br />
Comparison Years<br />
(Please Note: These figures are official census numbers for all students in each year and are not only incoming students as shown above.)<br />
2011 942 55.5% 44.5% 27.5% 95.5% 4.5% 80.5% 19.5% 2.87 480 500<br />
2009 (1 st year at CV) 840 55.5% 44.5% 22.9% 96.4% 3.6% 79.8% 20.2% 2.81 480 490<br />
2002 (10 years prior) 734 61.5% 38.5% 15.3% 97.1%% 2.9% 77.0% 23.0% 2.82 495 513<br />
Data Highlights<br />
-The total incoming class of <strong>2012</strong> has a slightly higher percentage of males than in recent previous years.<br />
-The minority rate continues to increase each year, with a nearly doubled minority rate over the last decade.<br />
-The number of students enrolling from outside of PA continues to grow.<br />
-The age breakdowns of the total incoming enrollments for <strong>2012</strong> have remained similar to 2011.<br />
-The average GPA of incoming freshmen for <strong>2012</strong> has increased since 2011.<br />
-The average SAT scores for incoming freshman and advanced standing students (for both the Verbal and Math components) have increased since 2011.<br />
42
States of Residency for Non-PA Residents<br />
Counties of Residency for PA Residents<br />
State of Residency<br />
Northeast<br />
Number of Incoming Non-PA<br />
Students<br />
(Freshmen and Advanced Standing)<br />
20 total<br />
Counties of Residency<br />
Number of PA Incoming Students<br />
(Freshmen and Advanced Standing)<br />
276 total<br />
New Jersey 9 Lehigh 117<br />
New York 1 Northampton 99<br />
Indiana 1 Bucks 23<br />
Southeast Montgomery 10<br />
Florida 1 Monroe 8<br />
North Carolina 1 Berks 7<br />
Mid West Philadelphia 3<br />
Illinois 1 Pike 3<br />
Minnesota 1 Lycoming 2<br />
West Chester 1<br />
California 2 Luzerne 1<br />
Westmoreland 1<br />
International 2 Wyoming 1<br />
Unknown 1<br />
Schools (1 st -6 th )<br />
Top 12 High Schools of Incoming Freshman for Fall <strong>2012</strong><br />
Number of Incoming<br />
Schools (7 th -12 th )<br />
Students<br />
Number of Incoming<br />
Students<br />
Parkland HS 27 Liberty HS 9<br />
Louis E. Dieruff HS 22 Northampton Area HS 8<br />
Emmaus HS 20 Southern Lehigh HS 8<br />
Easton Area HS 14 Quakertown Community HS 7<br />
Nazareth Area HS 12 Whitehall HS 7<br />
Freedom HS 11 Allentown Central Catholic HS 6<br />
43
PENN STATE LEHIGH VALLEY ENROLLMENT:<br />
ACTUAL AND PROJECTIONS<br />
<strong>Enrollment</strong> <strong>Plan</strong>ning<br />
P r o j e c t i o n s<br />
New 1st Year Students: Fall 02 Fall 03 Fall 04 Fall 05 Fall 06 Fall 07 Fall 08 Fall 09 Fall 10 Fall 11 Fall <strong>2012</strong> Fall <strong>2013</strong> Fall 2014<br />
Baccalaureate (Freshman Admits) 175 177 157 146 192 226 200 216 268 249 280 308 338<br />
Associate 15 15 8 6 8 16 12 9 8 9 15 15 0<br />
Provisional 18 13 12 11 15 11 12 14 13 17 15 15 15<br />
Graduate 0 0 0 0 0 0 0 0 0 0 0 0 0<br />
New Advanced Standing Students:<br />
Baccalaureate 31 47 30 42 40 35 44 34 62 58 60 66 73<br />
Associate 3 1 3 3 0 1 2 2 3 1 3 3 0<br />
Continuing Students:<br />
Baccalaureate 339 363 339 371 370 389 407 374 400 458 490 539 593<br />
Associate 46 30 28 24 18 18 11 14 18 10 15 15 0<br />
Provisional 10 8 10 8 6 12 7 7 7 11 10 10 10<br />
Graduate 0 0 0 0 0 0 0 0 0 0 0 0 0<br />
Nondegree Students 97 110 93 111 109 93 121 170 141 129 120 120 120<br />
Total Campus <strong>Enrollment</strong> 734 764 680 722 758 801 816 840 920 942 1008 1091 1149<br />
Full-Time Equivalent (FTE) 616.7 641.8 558.1 585.1 627.9 683.5 692.3 691.4 781.8 811.7 815.0 885.0 930.0<br />
FTE/Total Campus <strong>Enrollment</strong> (Ratio) 0.84 0.84 0.82 0.81 0.83 0.85 0.85 0.82 0.85 0.86 0.81 0.81 0.81<br />
Admissions <strong>Plan</strong>ning<br />
Freshman Baccalaureate Admissions Target (Su/Fa) 180 184 185 170 185 200 205 220 250 290 280 308 338<br />
Actual/Estimate Paid Accepts (Su/Fa) 176 178 159 147 193 229 201 229 274 255<br />
44
Change of Assignment<br />
Target Change of Assignment to UP 182 182 182 182 182 182 182 182 182 182 182 182 182<br />
Actual/Estimate (Fa/Sp) Change of Assignment to UP 84 90 97 74 90 92 93 128 125 127 125 125 125<br />
Change of Assignment to Other Penn State Campuses<br />
(except UP) 48 45 54 53 43 44 41 44 38 36 45 45 45<br />
Change of Assignment from UP to Your Campus 21 23 14 15 12 12 16 14 20 21 15 15 15<br />
Change of Assignment from All Other Campuses<br />
(except UP) to Your Campus 25 32 30 27 45 29 32 48 33 31 31 31 31<br />
<strong>Enrollment</strong> Indicators<br />
Upper Division <strong>Enrollment</strong> (1) 156 194 181 189 206 202 198 181 183 217 220 220 220<br />
Your College 89 118 121 127 126 115 109 58 118 158 140 140 140<br />
On Behalf of Another College 26 35 24 30 34 48 55 85 24 13 40 40 40<br />
Approved Exceptions 17 13 18 19 18 13 9 14 13 17 15 15 15<br />
Remaining Common Year/DUS 24 28 18 13 28 26 25 24 28 29 25 25 25<br />
Campus Baccalaureate Graduates<br />
(Fall/Spring/Summer) 63 76 72 90 74 84 89 64 89 80 80 80 80<br />
Campus Associate Graduates (Fall/Spring/Summer) 9 13 6 8 12 8 2 2 4 10 10 10 10<br />
PROJECTIONS IN RED<br />
1) Upper Division <strong>Enrollment</strong> - the total number of baccalaureate degree candidates with a semester classification of 05 and higher. There are four mutually exclusive subtotals provided.<br />
Your College - the number of students at this campus enrolled in a major authorized by your academic college.<br />
On Behalf of Another College - the number of students at this campus enrolled in a major of another college, where the program is designated to be offered at this campus (for example, IST).<br />
Approved Exceptions - the number of students at this campus enrolled in a major of another college, where the student has been given special permission to enroll at this campus.<br />
Example: a junior who has been given permission to remain for one additional semester; a senior who has been given permission to finish their last semester at the campus.<br />
Remaining Common Year/DUS - the number of students at this campus who have yet to enter a degree granting major.<br />
45
<strong>Enrollment</strong> Data: <strong>2012</strong><br />
with comparisons to 2011 and 2002 (1 year and 10 years)<br />
Year<br />
Total<br />
<strong>Enrollment</strong><br />
Gender Minority Age Residency Level<br />
Male Female (non-white,<br />
% excludes “declined<br />
to report”)<br />
23 and<br />
below<br />
24 and<br />
above<br />
PA<br />
Resident<br />
Non-PA<br />
Resident<br />
Undergrad<br />
Grad<br />
<strong>2012</strong> 945 55% 45% 32% 80% 20% 96% 4% 96% 4%<br />
Comparison to 2011<br />
(in student number)<br />
+3 -3 +6 +44 -5 +8 +6 -3 -8 +11<br />
2011 942 55.5% 44.5% 27.5% 80.5% 19.5% 95.5% 4.5% 97% 3%<br />
2002 734 61.5% 38.5% 15.5% 77% 23% 97% 3% 96% 4%<br />
Change in %<br />
distribution relative<br />
to total population<br />
from 2002 to <strong>2012</strong><br />
+211<br />
29% growth<br />
-6.5% +6.5% +16.5% +3% -3% -1% +1% 0% 0%<br />
Data Source: Penn State EIS, <strong>2012</strong><br />
46
Minority Population Data:<br />
Percentage of Total <strong>Enrollment</strong> or Total Population<br />
Hispanic/Latino Black/African American Asian/Asian American<br />
2011-<strong>2012</strong> PSLV 12.5% 3.7% 8.2%<br />
<strong>2012</strong>-<strong>2013</strong> PSLV 14.8% 5.2% 9.5%<br />
Lehigh Valley 14.9% 5.5% 2.6%<br />
Lehigh County 18.8% 6.1% 2.9%<br />
Northampton County 10.5% 5% 2.4%<br />
PSLV <strong>Enrollment</strong> Data Source: EIS, <strong>2012</strong><br />
Lehigh Valley and County Data Source: US Census Bureau, <strong>2012</strong><br />
47