valuacion de general motors usando un modelo de opciones reales
valuacion de general motors usando un modelo de opciones reales
valuacion de general motors usando un modelo de opciones reales

Create successful ePaper yourself
Turn your PDF publications into a flip-book with our unique Google optimized e-Paper software.
Universidad <strong>de</strong>l CEMA<br />
Maestría en Finanzas<br />
Law and Finance<br />
VALUACION DE GENERAL MOTORS USANDO UN MODELO DE<br />
OPCIONES REALES<br />
Javier Herrou<br />
Buenos Aires, Febrero 2009
Valuación GM<br />
RESUMEN EJECUTIVO<br />
El trabajo consiste f<strong>un</strong>damentalmente en bajar a <strong>un</strong> caso particular el mo<strong>de</strong>lo teórico <strong>de</strong><br />
<strong>opciones</strong> <strong>reales</strong> para valuar empresas con problemas financieros propuesto por Damodaran<br />
en su libro “Investment Valuation” <strong>de</strong> forma tal <strong>de</strong> po<strong>de</strong>r evaluar su efectiva instrumentación<br />
práctica.<br />
Dada la prof<strong>un</strong>da crisis <strong>de</strong> la industria automotriz americana y su complicada situación<br />
financiera opté por utilizar a General Motors para el caso práctico. La elección <strong>de</strong> esta<br />
compañía, con <strong>un</strong>a estructura <strong>de</strong> <strong>de</strong>uda muy compleja, <strong>de</strong>ntro <strong>de</strong> <strong>un</strong>a industria en la cual<br />
todos sus pares se encuentran en la misma situación y don<strong>de</strong> su continuidad se encuentra<br />
seriamente afectada por <strong>de</strong>cisiones políticas y económicas <strong>de</strong>l gobierno americano, puso en<br />
evi<strong>de</strong>ncia alg<strong>un</strong>as <strong>de</strong>bilida<strong>de</strong>s relevantes <strong>de</strong>l mo<strong>de</strong>lo.<br />
El mo<strong>de</strong>lo resulta ser <strong>de</strong>masiado sencillo en términos <strong>de</strong> inputs como para <strong>de</strong>terminar el valor<br />
<strong>de</strong> <strong>un</strong>a compañía <strong>de</strong> estas características. La estructura <strong>de</strong> <strong>de</strong>uda corporativa tan diversa,<br />
bonos emitidos en distintas monedas, don<strong>de</strong> raramente se encuentran bonos zero cupon,<br />
durations muy diferentes a sus vencimientos por altas tasas <strong>de</strong> <strong>de</strong>scuento y <strong>opciones</strong><br />
embebidas en los bonos, llevan a tener que simplificar en <strong>de</strong>masía la estructura <strong>de</strong> <strong>de</strong>uda <strong>de</strong><br />
la compañía. Por otro lado la necesidad <strong>de</strong> plantear <strong>un</strong> mo<strong>de</strong>lo <strong>de</strong> flujo <strong>de</strong> fondos <strong>de</strong>scontados<br />
para <strong>de</strong>terminar el valor <strong>de</strong> la firma e introducir el input en el mo<strong>de</strong>lo <strong>de</strong> Black & Scholes es<br />
prácticamente inevitable y por lo tanto es necesario tomar supuestos muy fuertes para hacer<br />
operativa la compañía y que terminan <strong>de</strong>bilitando fuertemente las conclusiones cuantitativas<br />
arrojadas por este mo<strong>de</strong>lo.<br />
Si bien presenta varias limitaciones prácticas para la valuación, no <strong>de</strong>beríamos <strong>de</strong>scartar la<br />
incorporación <strong>de</strong> este mo<strong>de</strong>lo como herramienta <strong>de</strong> análisis <strong>de</strong> alg<strong>un</strong>as variables ya que dada<br />
justamente su simplificación nos permite a partir <strong>de</strong> cinco inputs obtener <strong>un</strong> sexto parámetro<br />
que nos pue<strong>de</strong> ser <strong>de</strong> gran utilidad al momento <strong>de</strong> tomar <strong>de</strong>cisiones. Un claro ejemplo <strong>de</strong> esta<br />
aplicación es la obtención <strong>de</strong> la duración <strong>de</strong> toda su <strong>de</strong>uda implícita en el mercado.<br />
Javier Herrou Febrero 2009 Página 2 <strong>de</strong> 54
Valuación GM<br />
INDICE<br />
I. MARCO TEORICO PARA VALUACION DE EMPRESAS CON STRESS FINANCIERO4<br />
II. SITUACION DE LA INDUSTRIA AUTOMOTRIZ AMERICANA (Dic 08)......................... 5<br />
III. EL CASO GENERAL MOTORS ...................................................................................... 7<br />
A. METODO DE VALUACION ........................................................................................... 11<br />
1. Valor Actual <strong>de</strong> los Activos Subyacentes (S)............................................................. 12<br />
2. Valor <strong>de</strong> ejercicio, valor nominal <strong>de</strong> la <strong>de</strong>uda vigente (K) .......................................... 14<br />
3. Plazo <strong>de</strong> la opción, plazo <strong>de</strong> la <strong>de</strong>uda (t)................................................................... 17<br />
4. Varianza <strong>de</strong> los Activos Subyacentes , varianza <strong>de</strong> la firma (σ ^2 )............................. 18<br />
5. Tasa libre <strong>de</strong> riesgo (r)............................................................................................... 20<br />
B. VALUACION.................................................................................................................. 21<br />
IV. CONCLUSIONES.......................................................................................................... 23<br />
V. ANEXOS ....................................................................................................................... 25<br />
A. DESCRIPCION DE LOS BONOS EMITIDOS POR GM................................................ 25<br />
B. CURVAS DEL TIPO DE CAMBIO FORWARD.............................................................. 34<br />
C. PRINCIPALES COMPETIDORES................................................................................. 37<br />
D. ESTIMACION DE LA VIDA MEDIA ............................................................................... 38<br />
E. ESTIMACIONES DE ANALISTAS................................................................................. 50<br />
F. VOLATILADAD.............................................................................................................. 53<br />
VI. BIBLIOGRAFIA ............................................................................................................. 54<br />
Javier Herrou Febrero 2009 Página 3 <strong>de</strong> 54
Valuación GM<br />
I. MARCO TEORICO PARA VALUACION DE EMPRESAS CON STRESS<br />
FINANCIERO<br />
En situaciones especiales, las empresas con niveles <strong>de</strong> <strong>de</strong>uda muy alto tienen altas<br />
probabilida<strong>de</strong>s <strong>reales</strong> <strong>de</strong> entrar en bancarrota. En estos casos utilizar el mo<strong>de</strong>lo <strong>de</strong><br />
valuación <strong>de</strong> flujos <strong>de</strong>scontados resulta ina<strong>de</strong>cuado.<br />
Por lo tanto, los inversores <strong>de</strong> empresas con ingresos negativos, altos niveles <strong>de</strong><br />
activos y <strong>de</strong>uda, y cuya <strong>de</strong>uda únicamente se repaga con los bienes <strong>de</strong> la sociedad,<br />
siempre tienen la opción <strong>de</strong> liquidar la compañía y con esos fondos cancelar la<br />
<strong>de</strong>uda.<br />
Esta opción, interpretada como <strong>un</strong> CALL comprado sobre la compañía en cuestión,<br />
y especialmente cuando el valor <strong>de</strong> sus activos presenta muchas fluctuaciones,<br />
pue<strong>de</strong> agregar valor al accionista.<br />
El valor <strong>de</strong>l capital <strong>de</strong> <strong>un</strong>a compañía en todas las socieda<strong>de</strong>s con oferta publica y en<br />
muchas privadas, es <strong>un</strong> valor residual sobre las <strong>de</strong>udas y otros compromisos<br />
financieros. Por lo tanto, en caso <strong>de</strong> liquidación, los inversores recibirán el efectivo<br />
residual luego <strong>de</strong> hacer frente a todas sus obligaciones. Si el valor <strong>de</strong> la firma es<br />
inferior al valor residual <strong>de</strong> su <strong>de</strong>uda, los inversores no podrán per<strong>de</strong>r más que el<br />
capital invertido.<br />
Por lo tanto, el valor <strong>de</strong>l Capital al momento <strong>de</strong> la liquidación será:<br />
V – D si V > D<br />
0 si D > V<br />
Siendo<br />
V: Valor <strong>de</strong> liquidación <strong>de</strong> la compañía<br />
D: Valor nominal <strong>de</strong> la <strong>de</strong>uda y otros compromisos<br />
El valor <strong>de</strong>l Capital expuesto por lo tanto pue<strong>de</strong> interpretarse como <strong>un</strong> CALL<br />
Javier Herrou Febrero 2009 Página 4 <strong>de</strong> 54
Valuación GM<br />
II. SITUACION DE LA INDUSTRIA AUTOMOTRIZ AMERICANA (Dic 08)<br />
El sector automotriz enfrentaba <strong>un</strong>a situación complicada <strong>de</strong>rivada <strong>de</strong> la crisis financiera y la<br />
recesión económica en Estados Unidos <strong>de</strong>bido a que el nivel <strong>de</strong> consumo <strong>de</strong> autos se venía<br />
dando a través <strong>de</strong>l crédito, por lo que empresas <strong>de</strong>l ramo buscaban estrategias para salir<br />
libradas lo mejor posible.<br />
Durante el mes <strong>de</strong> diciembre <strong>de</strong>l 2008 se generaba <strong>un</strong> cúmulo <strong>de</strong> informaciones que<br />
revelaban <strong>un</strong> agravamiento <strong>de</strong> la situación financiera <strong>de</strong>l sector automotriz <strong>de</strong> los Estados<br />
Unidos.<br />
GM, Ford y Chrysler empleaban a casi 250.000 personas en forma directa, y <strong>un</strong>os 100.000<br />
empleos más en autopartistas estarían supeditados a la supervivencia <strong>de</strong> las automotrices.<br />
Las compañías sostenían que 1 <strong>de</strong> cada 10 empleos en Estados Unidos estaba relacionado<br />
con el sector automotor.<br />
La empresa automotriz Chrysler instaba al Congreso <strong>de</strong> Estados Unidos a que apruebe pronto<br />
<strong>un</strong> “préstamo puente” para que la compañía pueda continuar sus operaciones y sobrevivir a<br />
largo plazo, al tiempo que se ofrecían informes sobre drásticas caídas en las ventas <strong>de</strong><br />
automóviles.<br />
También General Motors presentaba ante el Congreso <strong>un</strong> plan <strong>de</strong> reestructuración y viabilidad<br />
a largo plazo, en el que solicitaba <strong>un</strong> préstamo necesario para mantener su liqui<strong>de</strong>z.<br />
Ford presentaba al Congreso <strong>un</strong> plan <strong>de</strong> reestructuración a fin <strong>de</strong> obtener <strong>un</strong> crédito <strong>de</strong> 9.000<br />
millones <strong>de</strong> dólares.<br />
Las ventas <strong>de</strong> General Motors en Estados Unidos se <strong>de</strong>splomaban <strong>un</strong> 41 por ciento en<br />
noviembre, en medio <strong>de</strong> la peor crisis financiera <strong>de</strong> su historia. La <strong>de</strong>manda <strong>de</strong> vehículos <strong>de</strong><br />
General Motors se reducía <strong>de</strong>bido a <strong>un</strong>a significante caída <strong>de</strong> la <strong>de</strong>manda <strong>de</strong> particulares y la<br />
continuada incertidumbre económica que impactaba negativamente la confianza <strong>de</strong> los<br />
consumidores. Por otro lado an<strong>un</strong>ciaba que cesarían sus operaciones <strong>de</strong> aviones ejecutivos<br />
en Detroit (Michigan) en enero <strong>de</strong> 2009 <strong>de</strong>bido a <strong>un</strong>a caída <strong>de</strong> volumen en el servicio <strong>de</strong><br />
transporte aéreo. GM exploraba varias alternativas para transferir sus operaciones <strong>de</strong> aviones<br />
corporativos a otra empresa, a<strong>de</strong>más <strong>de</strong> que tener previsto ven<strong>de</strong>r cuatro <strong>de</strong> sus aviones.<br />
La empresa estado<strong>un</strong>i<strong>de</strong>nse Ford confirmaba el cierre temporal <strong>de</strong> 11 plantas <strong>de</strong> ensamblaje<br />
en América <strong>de</strong>l Norte, incluidas sus operaciones en México, su fábrica ubicada en Hermosillo<br />
a partir <strong>de</strong>l 22 <strong>de</strong> diciembre, a fin <strong>de</strong> reducir inventarios ante la baja <strong>de</strong> ventas.<br />
Un plan para aprobar <strong>un</strong> rescate por 14.000 millones <strong>de</strong> dólares <strong>de</strong> la industria automotriz <strong>de</strong><br />
Estados Unidos se <strong>de</strong>rrumbaba el 11 <strong>de</strong> Diciembre en el Congreso (el monto era inferior a los<br />
34.000 millones <strong>de</strong> dólares solicitados por las empresas). Sin el préstamo, el colapso <strong>de</strong> las<br />
compañías agravaría la crisis económica con la pérdida <strong>de</strong> millones <strong>de</strong> empleos. GM era la<br />
Javier Herrou Febrero 2009 Página 5 <strong>de</strong> 54
Valuación GM<br />
que afrontaba la mayor urgencia, y Ford había dicho que no usaría los fondos a menos que<br />
empeore su situación.<br />
El precio <strong>de</strong> las acciones <strong>de</strong> General Motors en Estados Unidos se colocaba en su nivel más<br />
bajo en 60 años, lo que implicaba presiones importantes para su supervivencia.<br />
usd / accion<br />
45<br />
40<br />
35<br />
30<br />
25<br />
20<br />
15<br />
10<br />
5<br />
0<br />
1-Jan-2006<br />
20-Jul-2006<br />
EVOLUCION PRECIO GM - F<br />
5-Feb-2007<br />
GM F<br />
24-Aug-2007<br />
Evolución <strong>de</strong>l precio <strong>de</strong> GM y Ford Fuente: REUTERS<br />
11-Mar-2008<br />
27-Sep-2008<br />
Javier Herrou Febrero 2009 Página 6 <strong>de</strong> 54
Valuación GM<br />
III. EL CASO GENERAL MOTORS<br />
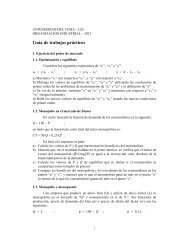
General Motors Corporation (NYSE: GM), también conocida como GM, es la empresa <strong>de</strong><br />
automóviles más gran<strong>de</strong> <strong>de</strong>l m<strong>un</strong>do. F<strong>un</strong>dada en 1908, GM hoy en día tiene 266.000<br />
empleados alre<strong>de</strong>dor <strong>de</strong>l m<strong>un</strong>do. Con la se<strong>de</strong> central en Detroit (Michigan), EE.UU., GM<br />
fabrica autos y camiones en 33 países. En 2007 GM vendió globalmente 9,37 millones <strong>de</strong><br />
autos y camiones bajo las marcas: Buick, Cadillac, Chevrolet, GMC, GM Daewoo (ahora<br />
disuelta, pero reemplazada por Chevrolet en Europa y en alg<strong>un</strong>os otros países), Hol<strong>de</strong>n,<br />
Hummer, Oldsmobile (ahora disuelta), Opel, Pontiac, Saab, Saturn Corporation, Vauxhall<br />
Motors.<br />
GM opera <strong>un</strong>a empresa <strong>de</strong> finanzas, GMAC Financial Services, que ofrece financiación y<br />
seguros <strong>de</strong> automóvil, resi<strong>de</strong>nciales y comerciales. La subsidiaria <strong>de</strong> GM OnStar es<br />
proveedora <strong>de</strong> servicios <strong>de</strong> información y seguridad <strong>de</strong> vehículos.<br />
GM es el accionista mayoritario <strong>de</strong> GM Daewoo Auto & Technology Co. <strong>de</strong> Corea <strong>de</strong>l Sur, y<br />
tiene colaboraciones <strong>de</strong> compras <strong>de</strong> productos y trenes <strong>de</strong> transmisión con Suzuki Motor<br />
Corp. e Isuzu Motors Ltd. <strong>de</strong> Japón. GM también tiene colaboraciones <strong>de</strong> tecnología avanzada<br />
con Toyota Motor Corporation <strong>de</strong> Japón, DaimlerChrysler AG y BMW AG <strong>de</strong> Alemania, y<br />
operaciones <strong>de</strong> fabricación <strong>de</strong> vehículos con varios fabricantes <strong>de</strong> automóviles alre<strong>de</strong>dor <strong>de</strong>l<br />
m<strong>un</strong>do, incluyendo Toyota, Suzuki, Shanghai Automotive Industry Corporation <strong>de</strong> China,<br />
AvtoVAZ <strong>de</strong> Rusia y Renault SA <strong>de</strong> Francia.<br />
Las partes y accesorios <strong>de</strong> GM se ven<strong>de</strong>n bajo las marcas <strong>de</strong> GM, GM Performance Parts,<br />
GM Goodwrench y ACDelco a través <strong>de</strong> GM Service and Parts Operations, que suministra<br />
concesiones y distribuidores m<strong>un</strong>diales <strong>de</strong> GM. Los motores y las transmisiones <strong>de</strong> GM son<br />
vendidos a través <strong>de</strong> GM Powertrain. El mercado nacional más gran<strong>de</strong> <strong>de</strong> GM son los Estados<br />
Unidos, seguidos <strong>de</strong> China, Canadá, el Reino Unido y Alemania.<br />
GM (8-Feb-09)<br />
Price 2,89<br />
Market Cap (USD MM): 1.730<br />
Beta: 1,56<br />
Enterprise Value USD MM 30.990<br />
Shares Outstanding MM 610<br />
Fuente: Yahoo Finance<br />
Javier Herrou Febrero 2009 Página 7 <strong>de</strong> 54
Valuación GM<br />
(USD in thousands)<br />
Balance Sheet<br />
PERIOD ENDING 30-Sep-08 30-J<strong>un</strong>-08 31-Mar-08 31-Dec-07<br />
Assets<br />
Current Assets<br />
Cash And<br />
Cash<br />
Equivalents 16,007,000 19,554,000 21,601,000 24,817,000<br />
Short Term<br />
Investments 67,000 1,150,000 1,831,000 2,139,000<br />
Net<br />
Receivables 9,461,000 8,946,000 10,071,000 9,659,000<br />
Inventory 21,226,000 22,413,000 21,741,000 20,222,000<br />
Other Current<br />
Assets 3,511,000 3,576,000 4,112,000 3,566,000<br />
Total Current Assets 50,272,000 55,639,000 59,356,000 60,403,000<br />
Long Term Investments 4,573,000 214,000 7,534,000 10,854,000<br />
Property Plant and Equipment 45,048,000 47,842,000 48,586,000 49,983,000<br />
Goodwill 676,000 1,070,000 1,093,000 736,000<br />
Intangible Assets 273,000 - - 330,000<br />
Accumulated Amortization - - - -<br />
Other Assets 8,676,000 30,267,000 27,501,000 24,461,000<br />
Deferred Long Term Asset<br />
Charges 907,000 1,014,000 1,671,000 2,116,000<br />
Total Assets 110,425,000 136,046,000 145,741,000 148,883,000<br />
Liabilities<br />
Current Liabilities<br />
Acco<strong>un</strong>ts<br />
Payable 61,798,000 67,470,000 64,529,000 64,291,000<br />
Short/Current<br />
Long Term<br />
Debt 7,208,000 8,008,000 5,968,000 6,047,000<br />
Other Current<br />
Liabilities - - - -<br />
Total Current Liabilities 69,006,000 75,478,000 70,497,000 70,338,000<br />
Long Term Debt 37,947,000 35,203,000 38,047,000 38,556,000<br />
Other Liabilities 62,466,000 80,959,000 76,871,000 72,502,000<br />
Deferred Long Term Liability<br />
Charges - - - 2,967,000<br />
Minority Interest 945,000 1,376,000 1,369,000 1,614,000<br />
Negative Goodwill - - - -<br />
Total Liabilities 170,364,000 193,016,000 186,784,000 185,977,000<br />
Stockhol<strong>de</strong>rs' Equity<br />
Misc Stocks Options Warrants - - - -<br />
Re<strong>de</strong>emable Preferred Stock - - - -<br />
Preferred Stock - - - -<br />
Javier Herrou Febrero 2009 Página 8 <strong>de</strong> 54
Valuación GM<br />
Common Stock 1,017,000 944,000 944,000 943,000<br />
Retained Earnings (61,014,000) (58,470,000) (42,847,000) (39,392,000)<br />
Treasury Stock - - - -<br />
Capital Surplus 15,732,000 15,335,000 15,327,000 15,319,000<br />
Other Stockhol<strong>de</strong>r Equity (15,674,000) (14,779,000) (14,467,000) (13,964,000)<br />
Total Stockhol<strong>de</strong>r Equity (59,939,000) (56,970,000) (41,043,000) (37,094,000)<br />
Net Tangible Assets ($60,888,000) ($58,040,000) ($42,136,000) ($38,160,000)<br />
Income Statement<br />
PERIOD ENDING 30-Sep-08 30-J<strong>un</strong>-08 31-Mar-08 31-Dec-07<br />
Total Revenue 37,941,000 37,975,000 42,670,000 46,897,000<br />
Cost of Revenue 35,996,000 43,365,000 38,333,000 44,457,000<br />
Gross Profit 1,945,000 (5,390,000) 4,337,000 2,440,000<br />
Operating Expenses<br />
Research<br />
Development<br />
Selling General<br />
and<br />
Administrative<br />
- - - -<br />
2,828,000 7,086,000 4,926,000 5,381,000<br />
Non Recurring - - - -<br />
Others - - - -<br />
Total Operating<br />
Expenses<br />
- - - -<br />
Operating Income or Loss -883 (12,476,000) -589 (2,941,000)<br />
Income from Continuing Operations<br />
Total Other<br />
Income/Expenses<br />
Net<br />
Earnings Before<br />
Interest And<br />
Taxes<br />
78,000 -231 318,000 1,623,000<br />
(2,040,000) (14,637,000) (1,883,000) (2,563,000)<br />
Interest Expense 542,000 721,000 774,000 646,000<br />
Income Before<br />
Tax<br />
Income Tax<br />
Expense<br />
(2,582,000) (15,358,000) (2,657,000) (3,209,000)<br />
68,000 308,000 653,000 (1,643,000)<br />
Minority Interest 58,000 67,000 -73 -406<br />
Net Income From<br />
Continuing Ops<br />
(2,542,000) (15,471,000) (3,251,000) (1,527,000)<br />
Javier Herrou Febrero 2009 Página 9 <strong>de</strong> 54
Valuación GM<br />
Non-recurring Events<br />
Discontinued<br />
Operations<br />
Extraordinary<br />
Items<br />
Effect Of<br />
Acco<strong>un</strong>ting<br />
Changes<br />
- - - 805,000<br />
- - - -<br />
- - - -<br />
Other Items - - - -<br />
Net Income (2,542,000) (15,471,000) (3,251,000) -722<br />
Preferred Stock And Other<br />
Adjustments<br />
Net Income Applicable To<br />
Common Shares<br />
- - - -<br />
($2,542,000) ($15,471,000) ($3,251,000) $ -722,00<br />
Cash Flow<br />
PERIOD ENDING 30-Sep-08 30-J<strong>un</strong>-08 31-Mar-08 31-Dec-07<br />
Net Income (2,542,000) (15,471,000) (3,251,000) -722<br />
Operating Activities, Cash Flows Provi<strong>de</strong>d By or Used In<br />
Depreciation - - - -<br />
Adjustments To Net Income - - - -<br />
Changes In Acco<strong>un</strong>ts<br />
Receivables<br />
- - - -<br />
Changes In Liabilities - - - -<br />
Changes In Inventories - - - -<br />
Changes In Other Operating<br />
Activities<br />
Total Cash Flow From<br />
Operating Activities<br />
Investing Activities, Cash Flows Provi<strong>de</strong>d By or Used In<br />
- - - -<br />
(7,473,000) -598 (1,590,000) 3,869,000<br />
Capital Expenditures (1,402,000) (2,180,000) (1,945,000) (2,603,000)<br />
Investments 961,000 674,000 295,000 (2,605,000)<br />
Other Cashflows from<br />
Investing Activities<br />
Total Cash Flows From<br />
Investing Activities<br />
Financing Activities, Cash Flows Provi<strong>de</strong>d By or Used In<br />
1,438,000 966,000 638,000 3,508,000<br />
997,000 -540 (1,012,000) (1,700,000)<br />
Divi<strong>de</strong>nds Paid - -141 -142 -142<br />
Sale Purchase of Stock - - - -<br />
Javier Herrou Febrero 2009 Página 10 <strong>de</strong> 54
Valuación GM<br />
USD Billions<br />
Net Borrowings 3,473,000 -868 -601 (1,964,000)<br />
Other Cash Flows from<br />
Financing Activities<br />
Total Cash Flows From<br />
Financing Activities<br />
Effect Of Exchange Rate<br />
Changes<br />
Change In Cash and Cash<br />
Equivalents<br />
Fuente: Yahoo Finance<br />
40,00<br />
30,00<br />
20,00<br />
10,00<br />
0,00<br />
-10,00<br />
-20,00<br />
-30,00<br />
20,40 21,60 22,90 20,40<br />
-13,8<br />
Q4 05<br />
-12,3<br />
Q1 06<br />
Fuente: General Motors<br />
A. METODO DE VALUACION<br />
- - - -<br />
3,473,000 (1,009,000) -743 (2,106,000)<br />
-544 100,000 129,000 24,000<br />
($3,547,000) ($2,047,000) ($3,216,000) $87,000<br />
Para valuar la Compañía con el mo<strong>de</strong>lo <strong>de</strong> <strong>opciones</strong> <strong>reales</strong> se necesitan los siguientes inputs:<br />
a) Valor Actual <strong>de</strong> los Activos Subyacentes (S)<br />
b) Valor <strong>de</strong> ejercicio, valor nominal <strong>de</strong> la <strong>de</strong>uda vigente (K)<br />
c) Plazo <strong>de</strong> la opción, plazo <strong>de</strong> la <strong>de</strong>uda (t)<br />
d) Varianza <strong>de</strong> los Activos Subyacentes , varianza <strong>de</strong> la firma (σ ^2 )<br />
e) Tasa libre <strong>de</strong> riesgo (r)<br />
-11,4<br />
Q2 06<br />
-14,2<br />
Q3 06<br />
26,40 24,70 27,20 30,00 27,30<br />
-12,3<br />
Net Liquidity<br />
Gross Cash<br />
Q4 06<br />
-13,3<br />
Q1 07<br />
Javier Herrou Febrero 2009 Página 11 <strong>de</strong> 54<br />
-12,1<br />
Q2 07<br />
-9,9<br />
Q3 07<br />
-12,1<br />
Q4 07<br />
23,90 21,00<br />
-16,2<br />
Q1 08<br />
-19,5<br />
Q2 08<br />
16,20<br />
-27,1<br />
Q3 08
Valuación GM<br />
Una vez obtenidos los inputs, el valor <strong>de</strong>l Call quedará <strong>de</strong>terminado por la siguiente<br />
fórmula:<br />
Valor <strong>de</strong>l Call = S * N(d1) – K* e ^(-r)*t * N(d2)<br />
1. Valor Actual <strong>de</strong> los Activos Subyacentes (S)<br />
Po<strong>de</strong>mos obtener el valor <strong>de</strong> la firma utilizando 3 criterios diferentes.<br />
Primero: consiste en obtener el valor <strong>de</strong> mercado <strong>de</strong> la <strong>de</strong>uda remanente y <strong>de</strong>l equity y<br />
sumarlos. El mo<strong>de</strong>lo por lo tanto realocará el valor <strong>de</strong> la firma en <strong>de</strong>uda y equity. Este enfoque<br />
si bien es muy sencillo resulta inconsistente ya que partimos <strong>de</strong> valores <strong>de</strong> mercado,<br />
asumiendo que son válidos para obtener otras proporciones <strong>de</strong> <strong>de</strong>uda y equity.<br />
⇒ Para el caso <strong>de</strong> GM, el Enterprise Value (EV) al 9 <strong>de</strong> Febrero <strong>de</strong>l 2009 ascendía a USD<br />
30.990MM según informaba Yahoo Finance.<br />
⇒<br />
Seg<strong>un</strong>do: consiste en estimar el valor <strong>de</strong> Mercado <strong>de</strong> los activos <strong>de</strong> la firma <strong>de</strong>scontando los<br />
flujos <strong>de</strong> caja estimados, al costo <strong>de</strong> capital. Tenemos que tener en cuenta que el valor <strong>de</strong> la<br />
firma que <strong>de</strong>bemos utilizar en el mo<strong>de</strong>lo <strong>de</strong> <strong>opciones</strong> es el que se obtiene en la liquidación y<br />
por lo tanto <strong>de</strong>bería ser inferior al que se obtiene suponiendo futuras inversiones. El mayor<br />
problema que presenta esta alternativa es que <strong>un</strong>a compañía en stress financiero sus<br />
resultados operativos se ven afectados y el valor que se obtiene pue<strong>de</strong> ser significativamente<br />
más bajo.<br />
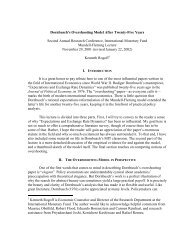
⇒ Dado que GM presentó durante el mes <strong>de</strong> febrero <strong>de</strong> 2009 al U.S. Department of the<br />
Treasury <strong>un</strong> plan <strong>de</strong> reestructuración global <strong>de</strong> la compañía con <strong>un</strong>a proyección <strong>de</strong> fondos<br />
hasta el año 2014 hemos adoptado como valor actual <strong>de</strong> los activos subyacentes (S) el<br />
obtenido teniendo en cuenta esta proyección <strong>de</strong> fondos.<br />
⇒ La valuación <strong>de</strong> la firma fue realizada por Evercore basada en la información otorgado por<br />
GM y utilizando <strong>un</strong> mo<strong>de</strong>lo <strong>de</strong> DCF. Para estimar el costo <strong>de</strong> capital para <strong>de</strong>scontar los<br />
flujos Evercore utilizó <strong>un</strong> promedio pon<strong>de</strong>rado <strong>de</strong>l costo <strong>de</strong>l equity y <strong>de</strong> la <strong>de</strong>uda neto <strong>de</strong><br />
impuestos. Para el costo <strong>de</strong>l equity se utilizó el mo<strong>de</strong>lo CAPM. El costo <strong>de</strong> la <strong>de</strong>uda se<br />
estimó teniendo en cuenta condiciones estables <strong>de</strong> mercado y tomando como referencia<br />
las siguientes compañías comparables: Daimler AG, Bayerische Motoren Werke AG,<br />
Javier Herrou Febrero 2009 Página 12 <strong>de</strong> 54
Valuación GM<br />
Volkswagen AG, PSA Peugeot Citroen, Fiat S.p.A., Toyota Motor Corporation, Honda<br />
Motor Co.,97 Ltd., Nissan Motor Co., Ltd., Hy<strong>un</strong>dai Motor Company, and Renault S.A. El<br />
rango <strong>de</strong> tasas utilizado para <strong>de</strong>scontar los flujos fue <strong>de</strong> 9.5% -11.5%.<br />
⇒ Para el cálculo <strong>de</strong>l valor Terminal se utilizó <strong>un</strong> múltiplo <strong>de</strong> EBITDA en el rango <strong>de</strong> 4.25x –<br />
4.75x consistente respecto a sus principales comparables.<br />
⇒ La tasa <strong>de</strong> impuesto a las ganancias se fijó en 35%<br />
⇒ La proyección utilizada por Evercore para la realizar la valuación fue la siguiente:<br />
Fuente: General Motors<br />
⇒ En f<strong>un</strong>ción al escenario base <strong>de</strong> reestructuración planteado, Evercore estimó <strong>un</strong><br />
Enterprise Value en el rango <strong>de</strong> los USD 59.000- 70.000MM, con <strong>un</strong> promedio <strong>de</strong> USD<br />
65.000 MM.<br />
Fuente: General Motors<br />
Javier Herrou Febrero 2009 Página 13 <strong>de</strong> 54
Valuación GM<br />
Tercero: consiste en estimar <strong>un</strong> múltiplo sobre ventas <strong>de</strong> compañías sanas <strong>de</strong>ntro <strong>de</strong>l mismo<br />
sector. Implícitamente estamos asumiendo que <strong>un</strong> potencial comprador, en <strong>un</strong>a situación <strong>de</strong><br />
liquidación estaría dispuesto a pagar ese valor. Po<strong>de</strong>mos utilizar este criterio para empresas<br />
con activos claramente i<strong>de</strong>ntificados que pue<strong>de</strong>n comercializarse en forma separada (por<br />
ejemplo <strong>un</strong>a empresa <strong>de</strong> real state).<br />
⇒ En nuestro caso, si bien estamos analizando el caso <strong>de</strong> GM, todo el sector en <strong>general</strong> se<br />
encuentra en condiciones financieras extremas y por lo tanto utilizar este criterio resulta<br />
muy complicado. El hecho <strong>de</strong> trabajar con <strong>un</strong> sector el cual se encuentra en su totalidad<br />
seriamente castigado dificulta no sólo la obtención <strong>de</strong>l valor actual <strong>de</strong> todos los activos<br />
subyacentes sino la aplicación <strong>de</strong> este mo<strong>de</strong>lo en su conj<strong>un</strong>to.<br />
2. Valor <strong>de</strong> ejercicio, valor nominal <strong>de</strong> la <strong>de</strong>uda vigente (K)<br />
Cuando <strong>un</strong>a compañía en stress financiero presenta múltiples <strong>de</strong>udas, tenemos tres <strong>opciones</strong><br />
para utilizar como valor nominal.<br />
Primero: <strong>un</strong>a alternativa es sumar la totalidad <strong>de</strong> los valores nominales <strong>de</strong> la <strong>de</strong>uda y<br />
asumirlo como <strong>un</strong> bono cero cupón. La limitación <strong>de</strong> este criterio es no consi<strong>de</strong>rar los cupones<br />
<strong>de</strong> intereses que pue<strong>de</strong>n tener los bonos.<br />
Seg<strong>un</strong>do: el otro criterio sería estimar los intereses y sumarlos al valor nominal <strong>de</strong> la <strong>de</strong>uda.<br />
En este caso se estarían mezclando flujos en distintos plazos, pero no <strong>de</strong>ja <strong>de</strong> ser la forma<br />
más sencilla y representativa en caso <strong>de</strong> tener flujos <strong>de</strong> interés intermedios.<br />
Tercero: <strong>un</strong> tercer criterio sería consi<strong>de</strong>rar únicamente el nominal <strong>de</strong> la <strong>de</strong>uda y los intereses<br />
en forma <strong>de</strong> porcentaje para introducir en el mo<strong>de</strong>lo como <strong>un</strong> divi<strong>de</strong>ndo. En <strong>de</strong>finitiva, cada<br />
año <strong>de</strong> permanencia tendremos <strong>un</strong>a disminución en el valor <strong>de</strong> la firma <strong>de</strong>bido al pago <strong>de</strong><br />
intereses.<br />
⇒ Para el caso <strong>de</strong> GM hemos i<strong>de</strong>ntificado en primera instancia todos los bonos emitidos bajo<br />
oferta pública con sus correspondientes intereses y monedas, y hemos computado <strong>un</strong><br />
único flujo teniendo en cuenta tanto el valor nominal como los intereses generados.<br />
Javier Herrou Febrero 2009 Página 14 <strong>de</strong> 54
Valuación GM<br />
⇒ Es importante resaltar que si bien contamos con <strong>un</strong>a gran cantidad <strong>de</strong> estos bonos<br />
instrumentos, los mismos representan menos <strong>de</strong>l 17% <strong>de</strong>l total <strong>de</strong> pasivos <strong>de</strong> la<br />
compañía.<br />
Maturity Date<br />
Outstanding Amo<strong>un</strong>t<br />
($ Million)<br />
Institutional Bonds<br />
Stated Interest<br />
Rate<br />
Settlement Date<br />
15-Ene-11 1.500 7,20% 11-Ene-01<br />
15-Jul-13 1.000 7,13% 03-Jul-03<br />
15-Abr-16 500 7,70% 15-Abr-96<br />
01-Mar-21 525 8,80% 12-Mar-91<br />
15-Jul-21 300 9,40% 22-Jul-91<br />
15-Jul-23 1.250 8,25% 03-Jul-03<br />
15-J<strong>un</strong>-24 400 8,10% 10-J<strong>un</strong>-96<br />
01-Sep-25 500 7,40% 11-Sep-95<br />
01-May-28 600 6,75% 29-Abr-98<br />
15-Jul-33 3.000 8,38% 03-Jul-03<br />
15-Mar-36 377 7,75% 20-Mar-96<br />
23-May-48 425 7,38% 23-May-03<br />
Maturity Date<br />
Outstanding<br />
Amo<strong>un</strong>t<br />
(Million)<br />
Foreign Currency Debt<br />
Stated Interest<br />
Rate<br />
Settlement Date CUSIP Number<br />
03-Jul-13 1,000 EUR 7,25% 03-Jul-03 17194275<br />
07-Dic-15 350 GBP 8,38% 10-Jul-03 17192264<br />
10-Jul-23 250 GBP 8,88% 10-Jul-03 17190806<br />
05-Jul-33 1,500 EUR 8,38% 03-Jul-03 17194364<br />
Perpetual 9 USD 6,50% 25-J<strong>un</strong>-86 1253808<br />
Javier Herrou Febrero 2009 Página 15 <strong>de</strong> 54
Valuación GM<br />
Maturity<br />
Date<br />
Outstanding<br />
Amo<strong>un</strong>t<br />
($ Million)<br />
Retail Bonds & Notes - USD<br />
Stated<br />
Interest<br />
Rate<br />
Settlement<br />
Date<br />
Symbol<br />
15-Abr-41 575 7,25% 30-Abr-01 GMW<br />
15-Jul-41 719 7,25% 09-Jul-01 XGM<br />
01-Jul-44 720 7,50% 30-J<strong>un</strong>-04 GMS<br />
15-May-48 1.115 7,38% 19-May-03 BGM<br />
Maturity<br />
Date<br />
01-Oct-51 690 7,38% 03-Oct-01 HGM<br />
15-Feb-52 875 7,25% 14-Feb-02 RGM<br />
Outstanding<br />
Amo<strong>un</strong>t<br />
($ Million)<br />
Stated<br />
Interest<br />
Rate<br />
Convertible Debentures - USD<br />
Settlement<br />
Date<br />
01-J<strong>un</strong>-09 1.002 1,50% 31-May-07<br />
06-Mar-32 39 4,50% 06-Mar-02<br />
06-Mar-32 2.600 5,25% 06-Mar-02<br />
Interest<br />
Payable<br />
Date<br />
Interest<br />
Record<br />
Date<br />
01-J<strong>un</strong> 15-May<br />
01-Dic 15-Nov<br />
01-Mar 15-Feb<br />
01-Sep 15-Ago<br />
01-Mar 15-Feb<br />
01-Sep 15-Ago<br />
Interest<br />
Payable<br />
Date<br />
Interest<br />
Record<br />
Date<br />
15-Ene 31-Dic<br />
15-Abr 31-Mar<br />
15-Jul 30-J<strong>un</strong><br />
15-Oct 30-Sep<br />
15-Ene 31-Dic<br />
15-Abr 31-Mar<br />
15-Jul 30-J<strong>un</strong><br />
15-Oct 30-Sep<br />
01-Ene 15-Dic<br />
01-Abr 15-Mar<br />
01-Jul 15-J<strong>un</strong><br />
01-Oct 15-Sep<br />
15-Feb 31-Ene<br />
15-May 30-Abr<br />
15-Ago 31-Jul<br />
15-Nov 31-Oct<br />
01-Ene 15-Dic<br />
01-Abr 15-Mar<br />
01-Jul 15-J<strong>un</strong><br />
01-Oct 15-Sep<br />
15-Feb 31-Ene<br />
15-May 30-Abr<br />
15-Ago 31-Jul<br />
15-Nov 31-Oct<br />
First Call<br />
Date<br />
Next Put<br />
Date<br />
N/A N/A<br />
06-Mar-07 06-Mar-12<br />
06-Mar-09 06-Mar-14<br />
Javier Herrou Febrero 2009 Página 16 <strong>de</strong> 54
Valuación GM<br />
15-Jul-33 4.300 6,25% 02-Jul-03<br />
Fuente: General Motors<br />
15-Ene<br />
15-Jul<br />
Last<br />
business<br />
day of the<br />
month<br />
preceding<br />
the interest<br />
payment<br />
20-Jul-10 15-Jul-18<br />
⇒ Para los bonos en distinta moneda hemos utilizado las curvas <strong>de</strong> conversión obtenidas <strong>de</strong><br />
REUTERS que se encuentran en el Anexo B.<br />
⇒ El monto total <strong>de</strong> los Institutional Bonds y <strong>de</strong> los Foreign Currency Debt ascien<strong>de</strong> a USD<br />
33.048MM.<br />
⇒ Por otro lado los Retail Bonds & Notes ascien<strong>de</strong>n a USD 1.115MM y los Convertible<br />
Debentures a USD 7.902MM.<br />
⇒ Adicionalmente la compañía presenta cuentas por pagar <strong>de</strong> USD 61.798MM y otros<br />
pasivos por USD 62.466MM.<br />
⇒ Teniendo en cuenta el plan <strong>de</strong> reestructuración presentado por la compañía <strong>de</strong>bemos<br />
incluir <strong>un</strong>a asistencia por parte <strong>de</strong>l gobierno americano <strong>de</strong> USD 18.000MM, <strong>de</strong> los cuales<br />
USD 12.000MM serán a término, USD 6.000MM como línea <strong>de</strong> crédito y otros USD<br />
4.500MM correspon<strong>de</strong>n a la renovación <strong>de</strong> <strong>un</strong>a facilidad crediticia hasta el 2011.<br />
⇒ Adicionalmente, el plan <strong>de</strong> reestructuración contempla otros USD 6.000MM <strong>de</strong> los<br />
gobiernos <strong>de</strong> Canadá, Alemania, Reino Unido, Suecia y Tailandia.<br />
⇒ El valor nominal <strong>de</strong> la <strong>de</strong>uda vigente (K), por lo tanto ascien<strong>de</strong> a USD 194.829MM.<br />
3. Plazo <strong>de</strong> la opción, plazo <strong>de</strong> la <strong>de</strong>uda (t)<br />
La mayoría <strong>de</strong> las compañías tiene más <strong>de</strong> <strong>un</strong>a <strong>de</strong>uda emitida y con cupones intermedios en<br />
su balance. Dado que el mo<strong>de</strong>lo permite <strong>un</strong> único valor para <strong>de</strong>finir el vencimiento, se <strong>de</strong>bería<br />
convertir todos los bonos y sus correspondientes cupones intermedios en <strong>un</strong> bono zero cupón<br />
equivalente.<br />
Una posible solución que toma en cuenta tanto el vencimiento <strong>de</strong> la <strong>de</strong>uda como los cupones<br />
intermedios es el <strong>de</strong> calcular la duración para cada pago y calcular <strong>un</strong>a duración promedio<br />
pon<strong>de</strong>rada por el valor nominal y utilizar este valor para introducir en el mo<strong>de</strong>lo.<br />
Javier Herrou Febrero 2009 Página 17 <strong>de</strong> 54
Valuación GM<br />
⇒ En <strong>un</strong>a primera instancia, y con el objetivo <strong>de</strong> llegar a <strong>un</strong>a valuación para el caso <strong>de</strong> GM<br />
se intentó <strong>un</strong>ificar todas las <strong>de</strong>udas en <strong>un</strong> único bono y po<strong>de</strong>r <strong>de</strong>terminar su duración.<br />
⇒ Dada la complejidad <strong>de</strong>l pasivo <strong>de</strong> GM, este p<strong>un</strong>to resultó ser <strong>un</strong> gran obstáculo para<br />
obtener <strong>un</strong>a valuación <strong>de</strong> la compañía que pudiera <strong>de</strong>fen<strong>de</strong>r consistentemente.<br />
⇒ He podido estimar en 13 años según el criterio expuesto anteriormente y expuesto en el<br />
Anexo D, la vida promedio correspondiente a los USD 33.048MM correspondientes al<br />
capital y a los intereses <strong>de</strong> los bonos institucionales y a los emitidos en moneda extranjera<br />
pero que sólo representa el 17% <strong>de</strong>l total <strong>de</strong> pasivos.<br />
4. Varianza <strong>de</strong> los Activos Subyacentes , varianza <strong>de</strong> la firma (σ ^2 )<br />
Este parámetro pue<strong>de</strong> <strong>de</strong>terminarse directamente si tanto la <strong>de</strong>uda como la acción cotizan en<br />
mercados relativamente líquidos.<br />
Si <strong>de</strong>finimos σe 2 como la varianza <strong>de</strong>l precio <strong>de</strong> la acción y a σd 2 como la varianza <strong>de</strong>l precio<br />
<strong>de</strong>l bono, we el peso relativo <strong>de</strong>l equity en el valor <strong>de</strong> la firma y a wd como el peso relativo <strong>de</strong><br />
la <strong>de</strong>uda, po<strong>de</strong>mos <strong>de</strong>finir la varianza <strong>de</strong> la firma como:<br />
Don<strong>de</strong> ρed es la correlación existente entre el precio <strong>de</strong> la acción y el precio <strong>de</strong> los bonos.<br />
Cuando los bonos no operan en el mercado podríamos tomar la varianza <strong>de</strong> bonos similares.<br />
Generalmente cuando las compañías enfrentan problemas financieros, tanto los bonos como<br />
las acciones presentan más volatilidad que pue<strong>de</strong>n distorsionar la verda<strong>de</strong>ra volatilidad <strong>de</strong>l<br />
negocio y por lo tanto se aconseja utilizar la varianza <strong>de</strong> otras empresas <strong>de</strong>l mismo sector<br />
pero que se encuentren en buena situación financiera.<br />
⇒ Por lo expuesto anteriormente, el hecho <strong>de</strong> encontrarnos <strong>de</strong>ntro <strong>de</strong> <strong>un</strong> sector muy<br />
castigado y don<strong>de</strong> las principales empresas comparables se encuentran en <strong>un</strong>a situación<br />
similar, resulta muy complicado po<strong>de</strong>r utilizar sus volatilida<strong>de</strong>s para el caso <strong>de</strong> GM. En el<br />
Anexo C se muestra <strong>un</strong> cuadro comparativo <strong>de</strong>l sector.<br />
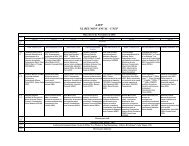
⇒ Para el caso <strong>de</strong> GM hemos calculado la volatilidad <strong>de</strong>l Enterprise Value trimestral <strong>de</strong> los<br />
últimos 10 años obtenida <strong>de</strong> Bloomberg. Dado el fuerte salto entre el FQ2 2006 y el FQ1<br />
2006 hemos eliminado esa variación <strong>de</strong> la muestra para calcular la volatilidad.<br />
⇒ La volatilidad anual estimada se encuentra en 14%.<br />
Javier Herrou Febrero 2009 Página 18 <strong>de</strong> 54
Valuación GM<br />
ENTERPRISE VALUE<br />
FQ3 2008 35.521,87<br />
FQ2 2008 30.393,87 -15,59%<br />
FQ1 2008 32.524,22 6,77%<br />
FQ4 2007 32.871,22 1,06%<br />
FQ3 2007 41.445,70 23,18%<br />
FQ2 2007 45.203,69 8,68%<br />
FQ1 2007 43.160,22 -4,63%<br />
FQ4 2006 42.289,39 -2,04%<br />
FQ3 2006 43.651,23 3,17%<br />
FQ2 2006 42.108,46 -3,60%<br />
FQ1 2006 237.563,40<br />
FQ4 2005 249.292,40 4,82%<br />
FQ3 2005 241.761,10 -3,07%<br />
FQ2 2005 246.913,10 2,11%<br />
FQ1 2005 253.775,20 2,74%<br />
FQ4 2004 263.523,20 3,77%<br />
FQ3 2004 254.118,90 -3,63%<br />
FQ2 2004 250.323,40 -1,50%<br />
FQ1 2004 253.439,40 1,24%<br />
FQ4 2003 247.303,70 -2,45%<br />
FQ3 2003 222.376,20 -10,62%<br />
FQ2 2003 203.540,70 -8,85%<br />
FQ1 2003 187.585,90 -8,16%<br />
FQ4 2002 183.960,10 -1,95%<br />
FQ3 2002 172.988,00 -6,15%<br />
FQ2 2002 175.874,50 1,65%<br />
FQ1 2002 169.414,20 -3,74%<br />
FQ4 2001 164.186,20 -3,13%<br />
FQ3 2001 151.539,40 -8,02%<br />
FQ2 2001 159.328,20 5,01%<br />
FQ1 2001 150.965,40 -5,39%<br />
FQ4 2000 152.382,30 0,93%<br />
FQ3 2000 157.673,80 3,41%<br />
FQ2 2000 150.698,40 -4,52%<br />
FQ1 2000 167.029,60 10,29%<br />
FQ4 1999 156.275,50 -6,66%<br />
FQ3 1999 142.180,00 -9,45%<br />
FQ2 1999 136.867,60 -3,81%<br />
FQ1 1999 149.046,90 8,52%<br />
FQ4 1998 144.605,90 -3,02%<br />
FQ3 1998 124.776,40 -14,75%<br />
Javier Herrou Febrero 2009 Página 19 <strong>de</strong> 54
Valuación GM<br />
FQ2 1998 128.236,80 2,74%<br />
ENTERPRISE VALUE Vol.Trimestral 7%<br />
EQUITY Vol. Historica 2008 -2006 Diaria 4%<br />
ENTERPRISE VALUE Vol. Anual 14%<br />
EQUITY Vol. Historica 2008 -2006 Anual 71%<br />
Fuente: Bloomberg<br />
⇒ En el Anexo F se ha adj<strong>un</strong>tado más información con respecto a la volatilidad <strong>de</strong> los<br />
activos.<br />
5. Tasa libre <strong>de</strong> riesgo (r)<br />
Como tasa libre <strong>de</strong> riesgo, y cuando utilizamos el USD como moneda se utilizan los<br />
rendimientos <strong>de</strong> los bonos <strong>de</strong>l tesoro americano para el plazo que corresponda.<br />
⇒ El hecho <strong>de</strong> <strong>de</strong>sconocer verda<strong>de</strong>ro el plazo <strong>de</strong> la opción dificulta en alg<strong>un</strong>a medida la tasa<br />
libre <strong>de</strong> riesgo a utilizar.<br />
⇒ Por otro lado, la poca pendiente que presenta la curva en estos momentos disminuye el<br />
impacto que pue<strong>de</strong> tener el hecho <strong>de</strong> utilizar <strong>un</strong>a tasa que no sea la correcta.<br />
⇒ El Treasury Note a 10 años al 12 <strong>de</strong> febrero rendía 2,71% mientras que el Treasury Bond<br />
a 30 años 3,45%.<br />
⇒ Dado que como único parámetro para el plazo contamos con el 13 años para el 17% <strong>de</strong>l<br />
pasivo utilicé el rendimiento promedio <strong>de</strong> 3.08%.<br />
Javier Herrou Febrero 2009 Página 20 <strong>de</strong> 54
B. VALUACION<br />
⇒ La i<strong>de</strong>a original <strong>de</strong> po<strong>de</strong>r valuar la compañía utilizando este mo<strong>de</strong>lo se vio amenazada por<br />
la compleja estructura <strong>de</strong> <strong>de</strong>uda <strong>de</strong> la compañía que no me permitió estimar <strong>un</strong> plazo<br />
estimado para la opción.<br />
⇒ Opté por lo tanto en utilizar este mo<strong>de</strong>lo para obtener justamente el plazo <strong>de</strong> la opción<br />
suponiendo como válido el precio por acción al cual se operaba el papel en el mercado<br />
(USD 2.89 al 9 <strong>de</strong> febrero 2009).<br />
⇒ La cantidad <strong>de</strong> acciones utilizado para la valuación fue <strong>de</strong> 610MM.<br />
⇒ Dado el rango para el Enterprise Value estimado por Evercore me pareció interesante ver<br />
la sensibilidad <strong>de</strong> este parámetro y <strong>de</strong> la volatilidad para la estimación <strong>de</strong>l plazo.<br />
⇒ Sorpresivamente, con la volatilidad <strong>de</strong>l 14%, y el EV promedio estimado por Evercore <strong>de</strong><br />
USD 65.000, la duración arrojada por el mo<strong>de</strong>lo ascien<strong>de</strong> a 13 años, el mismo valor que<br />
arrojó la vida media <strong>de</strong> los bonos que representan el 17% <strong>de</strong>l pasivo.<br />
Análisis <strong>de</strong> sensibilidad <strong>de</strong>l plazo calculado en años<br />
⇒ Realicé otro análisis <strong>de</strong> sensibilidad <strong>de</strong>l cálculo <strong>de</strong>l plazo en f<strong>un</strong>ción <strong>de</strong> la tasa libre <strong>de</strong><br />
riesgo utilizada y <strong>de</strong>jando los otros parámetros fijos, para verificar que el impacto no sea<br />
muy relevante. El hecho <strong>de</strong> que el plazo aumente en menos <strong>de</strong> 1 año para <strong>un</strong>a tasa <strong>de</strong>
Valuación GM<br />
2,71% (T 10Y) y disminuya en menos <strong>de</strong> 1 año para <strong>un</strong>a tasa <strong>de</strong> 3,45% (T 30Y) confirma<br />
lo supuesto.<br />
Análisis <strong>de</strong> sensibilidad <strong>de</strong>l plazo calculado en años<br />
⇒ En todos los análisis realizados anteriormente utilicé el precio <strong>de</strong> mercado para calcular el<br />
plazo <strong>de</strong> la opción. Dado que la mayoría <strong>de</strong> los analistas tienen <strong>un</strong>a recomendación<br />
negativa <strong>de</strong>l papel, como se observa en el Anexo E, e incluso el Deutsche Bank mantiene<br />
<strong>un</strong> target price <strong>de</strong> USD 0 por acción, opté por realizar el mismo cálculo <strong>de</strong>l plazo para<br />
distintos precios <strong>de</strong> la acción a<strong>un</strong>que manteniendo el EV calculado por Evercore. Este<br />
análisis también nos permitiría ver el impacto que pue<strong>de</strong> llegar a tener el precio <strong>de</strong> la<br />
acción en caso <strong>de</strong> que la empresa pue<strong>de</strong> refinanciar parte <strong>de</strong> sus pasivos.<br />
Análisis <strong>de</strong> sensibilidad <strong>de</strong>l plazo calculado en años<br />
Javier Herrou Febrero 2009 Página 22 <strong>de</strong> 54
Valuación GM<br />
IV. CONCLUSIONES<br />
⇒ El mo<strong>de</strong>lo claramente resulta ser <strong>de</strong>masiado sencillo en términos <strong>de</strong> inputs como para<br />
<strong>de</strong>terminar el valor <strong>de</strong> compañías tan complejas. Una <strong>de</strong> sus simplificaciones por ejemplo<br />
es consi<strong>de</strong>rar únicamente la existencia <strong>de</strong> <strong>de</strong>uda y acciones ordinarias y no contempla por<br />
ejemplo la incorporación <strong>de</strong> acciones preferidas.<br />
⇒ Los distintos tipos <strong>de</strong> <strong>de</strong>udas, <strong>un</strong>a duración muy diferente a su vencimiento por altas tasas<br />
<strong>de</strong> <strong>de</strong>scuento, emisiones en distinta moneda, la existencia <strong>de</strong> muy pocos bonos zero<br />
cupón corporativos y las <strong>opciones</strong> embebidas en alg<strong>un</strong>os <strong>de</strong> sus bonos llevan en la<br />
práctica a tener que simplificar muchísimo la estructura <strong>de</strong> la compañía. En nuestro caso<br />
particular, muchos <strong>de</strong> los bonos tenían <strong>opciones</strong> y no he podido incorporarlas y<br />
cuantificarlas en el mo<strong>de</strong>lo.<br />
⇒ El resto <strong>de</strong> los pasivos en muchos casos pue<strong>de</strong>n dificultar el cálculo <strong>de</strong> la duración al<br />
<strong>de</strong>sconocerse y en muchos casos no existir <strong>un</strong>a estructura <strong>de</strong>terminada y que <strong>de</strong> hecho<br />
pue<strong>de</strong>n representar <strong>un</strong> gran porcentaje <strong>de</strong> la <strong>de</strong>uda.<br />
⇒ El hecho <strong>de</strong> que <strong>un</strong>a crisis esté afectando a todo <strong>un</strong> sector económico y que el problema<br />
no sea particular <strong>de</strong> la empresa en cuestión dificulta seriamente la utilización práctica <strong>de</strong>l<br />
mo<strong>de</strong>lo y me resulta cuestionable su justificación teórica ya que los activos <strong>de</strong> la empresa<br />
en si no <strong>de</strong>berían tener mucha <strong>de</strong>manda en el mercado dada la gran capacidad exce<strong>de</strong>nte<br />
en toda la industria.<br />
⇒ En estas situaciones extremas y en grupos económicos tan relevantes para la economía<br />
<strong>de</strong> <strong>un</strong> país y <strong>de</strong>l m<strong>un</strong>do, el precio <strong>de</strong> las acciones se mueve más al ritmo <strong>de</strong> cuestiones<br />
políticas, noveda<strong>de</strong>s <strong>de</strong> rescates, refinanciaciones, reestructuraciones y otras medidas<br />
que terminan influyendo más que cualquier mo<strong>de</strong>lo y prácticamente imposibles <strong>de</strong><br />
cuantificar.<br />
⇒ Cuando valuamos la opción real, muchos <strong>de</strong> los inputs necesarios son difíciles <strong>de</strong> obtener<br />
y estimar <strong>un</strong> valor o <strong>un</strong>a varianza pue<strong>de</strong> ser <strong>un</strong>a tarea cuantitativa bastante complicada.<br />
⇒ Las <strong>opciones</strong> <strong>de</strong>rivan su valor <strong>de</strong> <strong>un</strong> activo subyacente y por la tanto para aplicar esta<br />
metodología, se <strong>de</strong>be valuar primero el activo, en nuestro caso por ejemplo utilizamos <strong>un</strong><br />
mo<strong>de</strong>lo <strong>de</strong> DCF para la valuación <strong>de</strong>l Enterprise Value. Por lo tanto resulta <strong>un</strong> enfoque<br />
que complementa o es complementada con otra metodología <strong>de</strong> valuación.<br />
⇒ La utilización <strong>de</strong> este mo<strong>de</strong>lo como herramienta para estimar alg<strong>un</strong>o <strong>de</strong> los parámetros<br />
existentes en f<strong>un</strong>ción al precio <strong>de</strong> la acción resultó ser muy apropiada en este caso<br />
particular.<br />
Javier Herrou Febrero 2009 Página 23 <strong>de</strong> 54
Valuación GM<br />
⇒ Si bien el mo<strong>de</strong>lo presenta gran<strong>de</strong>s dificulta<strong>de</strong>s, y por momentos pue<strong>de</strong> <strong>un</strong>o no sentirse<br />
cómodo con los inputs utilizados, finalmente la valuación particular ha sido muy<br />
consistente y los resultados obtenidos me han sorprendido favorablemente.<br />
⇒ Por otro lado el mo<strong>de</strong>lo <strong>de</strong> <strong>opciones</strong> nos provee <strong>de</strong> intuición sobre los parámetros que<br />
afectan su valor, por ejemplo, al incrementarse el riesgo incrementa su valor en lugar <strong>de</strong><br />
reducirlo, o en caso <strong>de</strong> lograr la compañía <strong>un</strong>a importante refinanciación <strong>de</strong> sus pasivos,<br />
<strong>un</strong>o podría estimar el impacto en el valor <strong>de</strong> la acción.<br />
Javier Herrou Febrero 2009 Página 24 <strong>de</strong> 54
Valuación GM<br />
V. ANEXOS<br />
A. DESCRIPCION DE LOS BONOS EMITIDOS POR GM<br />
Javier Herrou Febrero 2009 Página 25 <strong>de</strong> 54
Valuación GM<br />
Javier Herrou Febrero 2009 Página 26 <strong>de</strong> 54
Valuación GM<br />
Javier Herrou Febrero 2009 Página 27 <strong>de</strong> 54
Valuación GM<br />
Javier Herrou Febrero 2009 Página 28 <strong>de</strong> 54
Valuación GM<br />
Javier Herrou Febrero 2009 Página 29 <strong>de</strong> 54
Valuación GM<br />
Javier Herrou Febrero 2009 Página 30 <strong>de</strong> 54
Valuación GM<br />
Javier Herrou Febrero 2009 Página 31 <strong>de</strong> 54
Valuación GM<br />
Javier Herrou Febrero 2009 Página 32 <strong>de</strong> 54
Valuación GM<br />
Fuente: Bloomberg<br />
Javier Herrou Febrero 2009 Página 33 <strong>de</strong> 54
Valuación GM<br />
B. CURVAS DEL TIPO DE CAMBIO FORWARD<br />
EUR / USD FORWARD<br />
Javier Herrou Febrero 2009 Página 34 <strong>de</strong> 54
Valuación GM<br />
Fuente: Reuters<br />
GBP / USD FORWARD<br />
Javier Herrou Febrero 2009 Página 35 <strong>de</strong> 54
Valuación GM<br />
Fuente: Reuters<br />
USD / CHF FORWARD<br />
Javier Herrou Febrero 2009 Página 36 <strong>de</strong> 54
Valuación GM<br />
C. PRINCIPALES COMPETIDORES<br />
Fuente: Yahoo Finance<br />
COMPETIDORES<br />
DIRECT COMPETITOR COMPARISON<br />
GM Pvt1 F TM Industry<br />
Market Cap: 1.73B N/A 4.63B 108.76B 1.73B<br />
Employees: 252 66,4091 213 324,537 178.96K<br />
Qtrly Rev<br />
Growth (yoy):<br />
Revenue<br />
(ttm):<br />
Gross Margin<br />
(ttm):<br />
EBITDA<br />
(ttm):<br />
Oper Margins<br />
(ttm):<br />
Net Income<br />
(ttm):<br />
-13.20% N/A -33.80% -7.90% 11.90%<br />
166.10B 59.70B 1<br />
139.30B 276.55B 123.38B<br />
6.09% N/A -9.83% 16.39% 16.39%<br />
-1.41B N/A -162.00M 33.22B 19.68M<br />
-6.05% N/A -9.83% 6.21% 2.84%<br />
-22.79B N/A -14.58B 13.78B N/A<br />
EPS (ttm): -38.742 N/A -6.410 8.73 -0.11<br />
P/E (ttm): N/A N/A N/A 7.95 7.89<br />
PEG (5 yr<br />
expected):<br />
N/A N/A N/A N/A 1.00<br />
P/S (ttm): 0.01 N/A 0.03 0.39 0.37<br />
Pvt1 = Chrysler LLC (privately held)<br />
F = Ford Motor Co.<br />
TM = Toyota Motor Corp.<br />
Industry = Auto Manufacturers - Major<br />
1 = As of 2007<br />
Javier Herrou Febrero 2009 Página 37 <strong>de</strong> 54
Valuación GM<br />
D. ESTIMACION DE LA VIDA MEDIA<br />
Plazo (días) Fecha Flujo (USD) Flujo X Dias<br />
6 15-Feb-09 7.835.938 47.015.625<br />
20 1-Mar-09 41.590.980 831.819.600<br />
34 15-Mar-09 0 0<br />
65 15-Apr-09 19.250.000 1.251.250.000<br />
81 1-May-09 20.250.000 1.640.250.000<br />
95 15-May-09 7.835.938 744.414.063<br />
126 15-J<strong>un</strong>-09 16.200.000 2.041.200.000<br />
144 3-Jul-09 93.996.250 13.535.460.000<br />
146 5-Jul-09 162.872.813 23.779.430.625<br />
151 10-Jul-09 33.097.094 4.997.661.156<br />
156 15-Jul-09 280.902.865 43.820.846.940<br />
187 15-Aug-09 7.835.938 1.465.320.313<br />
204 1-Sep-09 41.590.980 8.484.559.920<br />
218 15-Sep-09 0 0<br />
248 15-Oct-09 19.250.000 4.774.000.000<br />
265 1-Nov-09 20.250.000 5.366.250.000<br />
279 15-Nov-09 7.835.938 2.186.226.563<br />
301 7-Dec-09 43.725.456 13.161.362.331<br />
306 12-Dec-09 670.186 205.077.047<br />
309 15-Dec-09 16.200.000 5.005.800.000<br />
340 15-Jan-10 280.902.865 95.506.974.100<br />
371 15-Feb-10 7.835.938 2.907.132.813<br />
385 1-Mar-10 41.590.980 16.012.527.300<br />
399 15-Mar-10 0 0<br />
430 15-Apr-10 19.250.000 8.277.500.000<br />
446 1-May-10 20.250.000 9.031.500.000<br />
460 15-May-10 7.835.938 3.604.531.250<br />
491 15-J<strong>un</strong>-10 16.200.000 7.954.200.000<br />
509 3-Jul-10 93.996.250 47.844.091.250<br />
511 5-Jul-10 162.872.813 83.228.007.188<br />
516 10-Jul-10 33.097.094 17.078.100.375<br />
521 15-Jul-10 280.902.865 146.350.392.665<br />
552 15-Aug-10 7.835.938 4.325.437.500<br />
569 1-Sep-10 41.590.980 23.665.267.620<br />
583 15-Sep-10 0 0<br />
613 15-Oct-10 19.250.000 11.800.250.000<br />
630 1-Nov-10 20.250.000 12.757.500.000<br />
644 15-Nov-10 7.835.938 5.046.343.750<br />
666 7-Dec-10 43.725.456 29.121.153.863<br />
671 12-Dec-10 670.186 449.695.094<br />
Javier Herrou Febrero 2009 Página 38 <strong>de</strong> 54
Valuación GM<br />
674 15-Dec-10 16.200.000 10.918.800.000<br />
705 15-Jan-11 1.780.902.865 1.255.536.519.825<br />
736 15-Feb-11 7.835.938 5.767.250.000<br />
750 1-Mar-11 41.590.980 31.193.235.000<br />
764 15-Mar-11 0 0<br />
795 15-Apr-11 19.250.000 15.303.750.000<br />
811 1-May-11 20.250.000 16.422.750.000<br />
825 15-May-11 7.835.938 6.464.648.438<br />
856 15-J<strong>un</strong>-11 16.200.000 13.867.200.000<br />
874 3-Jul-11 93.996.250 82.152.722.500<br />
876 5-Jul-11 162.872.813 142.676.583.750<br />
881 10-Jul-11 33.097.094 29.158.539.594<br />
886 15-Jul-11 226.902.865 201.035.938.390<br />
917 15-Aug-11 7.835.938 7.185.554.688<br />
934 1-Sep-11 41.590.980 38.845.975.320<br />
948 15-Sep-11 0 0<br />
978 15-Oct-11 19.250.000 18.826.500.000<br />
995 1-Nov-11 20.250.000 20.148.750.000<br />
1009 15-Nov-11 7.835.938 7.906.460.938<br />
1031 7-Dec-11 43.725.456 45.080.945.394<br />
1036 12-Dec-11 670.186 694.313.140<br />
1039 15-Dec-11 16.200.000 16.831.800.000<br />
1070 15-Jan-12 226.902.865 242.786.065.550<br />
1101 15-Feb-12 7.835.938 8.627.367.188<br />
1116 1-Mar-12 41.590.980 46.415.533.680<br />
1130 15-Mar-12 0 0<br />
1161 15-Apr-12 19.250.000 22.349.250.000<br />
1177 1-May-12 20.250.000 23.834.250.000<br />
1191 15-May-12 7.835.938 9.332.601.563<br />
1222 15-J<strong>un</strong>-12 16.200.000 19.796.400.000<br />
1240 3-Jul-12 93.996.250 116.555.350.000<br />
1242 5-Jul-12 162.872.813 202.288.033.125<br />
1247 10-Jul-12 33.097.094 41.272.075.906<br />
1252 15-Jul-12 226.902.865 284.082.386.980<br />
1283 15-Aug-12 7.835.938 10.053.507.813<br />
1300 1-Sep-12 41.590.980 54.068.274.000<br />
1314 15-Sep-12 0 0<br />
1344 15-Oct-12 19.250.000 25.872.000.000<br />
1361 1-Nov-12 20.250.000 27.560.250.000<br />
1375 15-Nov-12 7.835.938 10.774.414.063<br />
1397 7-Dec-12 43.725.456 61.084.462.381<br />
Javier Herrou Febrero 2009 Página 39 <strong>de</strong> 54
Valuación GM<br />
1402 12-Dec-12 670.186 939.601.373<br />
1405 15-Dec-12 16.200.000 22.761.000.000<br />
1436 15-Jan-13 226.902.865 325.832.514.140<br />
1467 15-Feb-13 7.835.938 11.495.320.313<br />
1481 1-Mar-13 41.590.980 61.596.241.380<br />
1495 15-Mar-13 0 0<br />
1526 15-Apr-13 19.250.000 29.375.500.000<br />
1542 1-May-13 20.250.000 31.225.500.000<br />
1556 15-May-13 7.835.938 12.192.718.750<br />
1587 15-J<strong>un</strong>-13 16.200.000 25.709.400.000<br />
1605 3-Jul-13 1.390.496.250 2.231.746.481.250<br />
1607 5-Jul-13 162.872.813 261.736.609.688<br />
1612 10-Jul-13 33.097.094 53.352.515.125<br />
1617 15-Jul-13 1.226.902.865 1.983.901.932.705<br />
1648 15-Aug-13 7.835.938 12.913.625.000<br />
1665 1-Sep-13 41.590.980 69.248.981.700<br />
1679 15-Sep-13 0 0<br />
1709 15-Oct-13 19.250.000 32.898.250.000<br />
1726 1-Nov-13 20.250.000 34.951.500.000<br />
1740 15-Nov-13 7.835.938 13.634.531.250<br />
1762 7-Dec-13 43.725.456 77.044.253.913<br />
1767 12-Dec-13 670.186 1.184.219.420<br />
1770 15-Dec-13 16.200.000 28.674.000.000<br />
1801 15-Jan-14 191.277.865 344.491.434.865<br />
1832 15-Feb-14 7.835.938 14.355.437.500<br />
1846 1-Mar-14 41.590.980 76.776.949.080<br />
1860 15-Mar-14 0 0<br />
1891 15-Apr-14 19.250.000 36.401.750.000<br />
1907 1-May-14 20.250.000 38.616.750.000<br />
1921 15-May-14 7.835.938 15.052.835.938<br />
1952 15-J<strong>un</strong>-14 16.200.000 31.622.400.000<br />
1972 5-Jul-14 162.872.813 321.185.186.250<br />
1977 10-Jul-14 33.097.094 65.432.954.344<br />
1982 15-Jul-14 191.277.865 379.112.728.430<br />
2013 15-Aug-14 7.835.938 15.773.742.188<br />
2030 1-Sep-14 41.590.980 84.429.689.400<br />
2044 15-Sep-14 0 0<br />
2074 15-Oct-14 19.250.000 39.924.500.000<br />
2091 1-Nov-14 20.250.000 42.342.750.000<br />
2105 15-Nov-14 7.835.938 16.494.648.438<br />
Javier Herrou Febrero 2009 Página 40 <strong>de</strong> 54
Valuación GM<br />
2127 7-Dec-14 43.725.456 93.004.045.444<br />
2132 12-Dec-14 670.186 1.428.837.467<br />
2135 15-Dec-14 16.200.000 34.587.000.000<br />
2166 15-Jan-15 191.277.865 414.307.855.590<br />
2197 15-Feb-15 7.835.938 17.215.554.688<br />
2211 1-Mar-15 41.590.980 91.957.656.780<br />
2225 15-Mar-15 0 0<br />
2256 15-Apr-15 19.250.000 43.428.000.000<br />
2272 1-May-15 20.250.000 46.008.000.000<br />
2286 15-May-15 7.835.938 17.912.953.125<br />
2317 15-J<strong>un</strong>-15 16.200.000 37.535.400.000<br />
2337 5-Jul-15 162.872.813 380.633.762.813<br />
2342 10-Jul-15 33.097.094 77.513.393.563<br />
2347 15-Jul-15 191.277.865 448.929.149.155<br />
2378 15-Aug-15 7.835.938 18.633.859.375<br />
2395 1-Sep-15 41.590.980 99.610.397.100<br />
2409 15-Sep-15 0 0<br />
2439 15-Oct-15 19.250.000 46.950.750.000<br />
2456 1-Nov-15 20.250.000 49.734.000.000<br />
2470 15-Nov-15 7.835.938 19.354.765.625<br />
2492 7-Dec-15 565.820.456 1.410.024.576.975<br />
2497 12-Dec-15 670.186 1.673.455.513<br />
2500 15-Dec-15 16.200.000 40.500.000.000<br />
2531 15-Jan-16 191.277.865 484.124.276.315<br />
2562 15-Feb-16 7.835.938 20.075.671.875<br />
2577 1-Mar-16 41.590.980 107.179.955.460<br />
2591 15-Mar-16 0 0<br />
2622 15-Apr-16 519.250.000 1.361.473.500.000<br />
2638 1-May-16 20.250.000 53.419.500.000<br />
2652 15-May-16 7.835.938 20.780.906.250<br />
2683 15-J<strong>un</strong>-16 16.200.000 43.464.600.000<br />
2703 5-Jul-16 162.872.813 440.245.212.188<br />
2708 10-Jul-16 33.097.094 89.626.929.875<br />
2713 15-Jul-16 191.277.865 518.936.847.745<br />
2744 15-Aug-16 7.835.938 21.501.812.500<br />
2761 1-Sep-16 41.590.980 114.832.695.780<br />
2775 15-Sep-16 14.623.359 40.579.820.531<br />
2822 1-Nov-16 20.250.000 57.145.500.000<br />
2836 15-Nov-16 7.835.938 22.222.718.750<br />
2863 12-Dec-16 670.186 1.918.743.746<br />
Javier Herrou Febrero 2009 Página 41 <strong>de</strong> 54
Valuación GM<br />
2866 15-Dec-16 16.200.000 46.429.200.000<br />
2897 15-Jan-17 191.277.865 554.131.974.905<br />
2928 15-Feb-17 7.835.938 22.943.625.000<br />
2942 1-Mar-17 41.590.980 122.360.663.160<br />
2956 15-Mar-17 14.623.359 43.226.648.465<br />
3003 1-May-17 20.250.000 60.810.750.000<br />
3017 15-May-17 7.835.938 23.641.023.438<br />
3048 15-J<strong>un</strong>-17 16.200.000 49.377.600.000<br />
3068 5-Jul-17 162.872.813 499.693.788.750<br />
3073 10-Jul-17 33.097.094 101.707.369.094<br />
3078 15-Jul-17 191.277.865 588.753.268.470<br />
3109 15-Aug-17 7.835.938 24.361.929.688<br />
3126 1-Sep-17 41.590.980 130.013.403.480<br />
3140 15-Sep-17 14.623.359 45.917.346.475<br />
3187 1-Nov-17 20.250.000 64.536.750.000<br />
3201 15-Nov-17 7.835.938 25.082.835.938<br />
3228 12-Dec-17 670.186 2.163.361.793<br />
3231 15-Dec-17 16.200.000 52.342.200.000<br />
3262 15-Jan-18 191.277.865 623.948.395.630<br />
3293 15-Feb-18 7.835.938 25.803.742.188<br />
3307 1-Mar-18 41.590.980 137.541.370.860<br />
3321 15-Mar-18 14.623.359 48.564.174.409<br />
3368 1-May-18 20.250.000 68.202.000.000<br />
3382 15-May-18 7.835.938 26.501.140.625<br />
3413 15-J<strong>un</strong>-18 16.200.000 55.290.600.000<br />
3433 5-Jul-18 162.872.813 559.142.365.313<br />
3438 10-Jul-18 33.097.094 113.787.808.313<br />
3443 15-Jul-18 191.277.865 658.569.689.195<br />
3474 15-Aug-18 7.835.938 27.222.046.875<br />
3491 1-Sep-18 41.590.980 145.194.111.180<br />
3505 15-Sep-18 14.623.359 51.254.872.419<br />
3552 1-Nov-18 20.250.000 71.928.000.000<br />
3566 15-Nov-18 7.835.938 27.942.953.125<br />
3593 12-Dec-18 670.186 2.407.979.839<br />
3596 15-Dec-18 16.200.000 58.255.200.000<br />
3627 15-Jan-19 191.277.865 693.764.816.355<br />
3658 15-Feb-19 7.835.938 28.663.859.375<br />
3672 1-Mar-19 41.590.980 152.722.078.560<br />
3686 15-Mar-19 14.623.359 53.901.700.353<br />
3733 1-May-19 20.250.000 75.593.250.000<br />
Javier Herrou Febrero 2009 Página 42 <strong>de</strong> 54
Valuación GM<br />
3747 15-May-19 7.835.938 29.361.257.813<br />
3778 15-J<strong>un</strong>-19 16.200.000 61.203.600.000<br />
3798 5-Jul-19 162.872.813 618.590.941.875<br />
3803 10-Jul-19 33.097.094 125.868.247.531<br />
3808 15-Jul-19 191.277.865 728.386.109.920<br />
3839 15-Aug-19 7.835.938 30.082.164.063<br />
3856 1-Sep-19 41.590.980 160.374.818.880<br />
3870 15-Sep-19 14.623.359 56.592.398.363<br />
3917 1-Nov-19 20.250.000 79.319.250.000<br />
3931 15-Nov-19 7.835.938 30.803.070.313<br />
3958 12-Dec-19 670.186 2.652.597.886<br />
3961 15-Dec-19 16.200.000 64.168.200.000<br />
3992 15-Jan-20 191.277.865 763.581.237.080<br />
4023 15-Feb-20 7.835.938 31.523.976.563<br />
4038 1-Mar-20 41.590.980 167.944.377.240<br />
4052 15-Mar-20 14.623.359 59.253.849.655<br />
4099 1-May-20 20.250.000 83.004.750.000<br />
4113 15-May-20 7.835.938 32.229.210.938<br />
4144 15-J<strong>un</strong>-20 16.200.000 67.132.800.000<br />
4164 5-Jul-20 162.872.813 678.202.391.250<br />
4169 10-Jul-20 33.097.094 137.981.783.844<br />
4174 15-Jul-20 191.277.865 798.393.808.510<br />
4205 15-Aug-20 7.835.938 32.950.117.188<br />
4222 1-Sep-20 41.590.980 175.597.117.560<br />
4236 15-Sep-20 14.623.359 61.944.547.665<br />
4283 1-Nov-20 20.250.000 86.730.750.000<br />
4297 15-Nov-20 7.835.938 33.671.023.438<br />
4324 12-Dec-20 670.186 2.897.886.119<br />
4327 15-Dec-20 16.200.000 70.097.400.000<br />
4358 15-Jan-21 191.277.865 833.588.935.670<br />
4389 15-Feb-21 7.835.938 34.391.929.688<br />
4403 1-Mar-21 566.385.980 2.493.797.469.940<br />
4417 15-Mar-21 14.623.359 64.591.375.599<br />
4464 1-May-21 20.250.000 90.396.000.000<br />
4478 15-May-21 7.835.938 35.089.328.125<br />
4509 15-J<strong>un</strong>-21 16.200.000 73.045.800.000<br />
4529 5-Jul-21 162.872.813 737.650.967.813<br />
4534 10-Jul-21 33.097.094 150.062.223.063<br />
4539 15-Jul-21 491.072.865 2.228.979.734.235<br />
4570 15-Aug-21 7.835.938 35.810.234.375<br />
Javier Herrou Febrero 2009 Página 43 <strong>de</strong> 54
Valuación GM<br />
4587 1-Sep-21 18.500.000 84.859.500.000<br />
4601 15-Sep-21 14.623.359 67.282.073.609<br />
4648 1-Nov-21 20.250.000 94.122.000.000<br />
4662 15-Nov-21 7.835.938 36.531.140.625<br />
4689 12-Dec-21 670.186 3.142.504.166<br />
4692 15-Dec-21 16.200.000 76.010.400.000<br />
4723 15-Jan-22 177.187.500 836.856.562.500<br />
4754 15-Feb-22 7.835.938 37.252.046.875<br />
4768 1-Mar-22 18.500.000 88.208.000.000<br />
4782 15-Mar-22 14.623.359 69.928.901.543<br />
4829 1-May-22 20.250.000 97.787.250.000<br />
4843 15-May-22 7.835.938 37.949.445.313<br />
4874 15-J<strong>un</strong>-22 16.200.000 78.958.800.000<br />
4894 5-Jul-22 162.872.813 797.099.544.375<br />
4899 10-Jul-22 33.097.094 162.142.662.281<br />
4904 15-Jul-22 177.187.500 868.927.500.000<br />
4935 15-Aug-22 7.835.938 38.670.351.563<br />
4952 1-Sep-22 18.500.000 91.612.000.000<br />
4966 15-Sep-22 14.623.359 72.619.599.553<br />
5013 1-Nov-22 20.250.000 101.513.250.000<br />
5027 15-Nov-22 7.835.938 39.391.257.813<br />
5054 12-Dec-22 670.186 3.387.122.212<br />
5057 15-Dec-22 16.200.000 81.923.400.000<br />
5088 15-Jan-23 177.187.500 901.530.000.000<br />
5119 15-Feb-23 7.835.938 40.112.164.063<br />
5133 1-Mar-23 18.500.000 94.960.500.000<br />
5147 15-Mar-23 14.623.359 75.266.427.486<br />
5194 1-May-23 20.250.000 105.178.500.000<br />
5208 15-May-23 7.835.938 40.809.562.500<br />
5239 15-J<strong>un</strong>-23 16.200.000 84.871.800.000<br />
5259 5-Jul-23 162.872.813 856.548.120.938<br />
5264 10-Jul-23 406.022.094 2.137.300.301.500<br />
5269 15-Jul-23 1.427.187.500 7.519.850.937.500<br />
5300 15-Aug-23 7.835.938 41.530.468.750<br />
5317 1-Sep-23 18.500.000 98.364.500.000<br />
5331 15-Sep-23 14.623.359 77.957.125.496<br />
5378 1-Nov-23 20.250.000 108.904.500.000<br />
5392 15-Nov-23 7.835.938 42.251.375.000<br />
5419 12-Dec-23 670.186 3.631.740.259<br />
5422 15-Dec-23 16.200.000 87.836.400.000<br />
Javier Herrou Febrero 2009 Página 44 <strong>de</strong> 54
Valuación GM<br />
5453 15-Jan-24 125.625.000 685.033.125.000<br />
5484 15-Feb-24 7.835.938 42.972.281.250<br />
5499 1-Mar-24 18.500.000 101.731.500.000<br />
5513 15-Mar-24 14.623.359 80.618.576.789<br />
5560 1-May-24 20.250.000 112.590.000.000<br />
5574 15-May-24 7.835.938 43.677.515.625<br />
5605 15-J<strong>un</strong>-24 416.200.000 2.332.801.000.000<br />
5625 5-Jul-24 162.872.813 916.159.570.313<br />
5635 15-Jul-24 125.625.000 707.896.875.000<br />
5666 15-Aug-24 7.835.938 44.398.421.875<br />
5683 1-Sep-24 18.500.000 105.135.500.000<br />
5697 15-Sep-24 14.623.359 83.309.274.799<br />
5744 1-Nov-24 20.250.000 116.316.000.000<br />
5758 15-Nov-24 7.835.938 45.119.328.125<br />
5785 12-Dec-24 670.186 3.877.028.492<br />
5819 15-Jan-25 125.625.000 731.011.875.000<br />
5850 15-Feb-25 7.835.938 45.840.234.375<br />
5864 1-Mar-25 18.500.000 108.484.000.000<br />
5878 15-Mar-25 14.623.359 85.956.102.733<br />
5925 1-May-25 20.250.000 119.981.250.000<br />
5939 15-May-25 7.835.938 46.537.632.813<br />
5990 5-Jul-25 162.872.813 975.608.146.875<br />
6000 15-Jul-25 125.625.000 753.750.000.000<br />
6031 15-Aug-25 7.835.938 47.258.539.063<br />
6048 1-Sep-25 518.500.000 3.135.888.000.000<br />
6062 15-Sep-25 14.623.359 88.646.800.743<br />
6109 1-Nov-25 20.250.000 123.707.250.000<br />
6123 15-Nov-25 7.835.938 47.979.445.313<br />
6150 12-Dec-25 670.186 4.121.646.538<br />
6184 15-Jan-26 125.625.000 776.865.000.000<br />
6215 15-Feb-26 7.835.938 48.700.351.563<br />
6243 15-Mar-26 14.623.359 91.293.628.676<br />
6290 1-May-26 20.250.000 127.372.500.000<br />
6304 15-May-26 7.835.938 49.397.750.000<br />
6355 5-Jul-26 162.872.813 1.035.056.723.438<br />
6365 15-Jul-26 125.625.000 799.603.125.000<br />
6396 15-Aug-26 7.835.938 50.118.656.250<br />
6427 15-Sep-26 14.623.359 93.984.326.686<br />
6474 1-Nov-26 20.250.000 131.098.500.000<br />
6488 15-Nov-26 7.835.938 50.839.562.500<br />
Javier Herrou Febrero 2009 Página 45 <strong>de</strong> 54
Valuación GM<br />
6515 12-Dec-26 670.186 4.366.264.585<br />
6549 15-Jan-27 125.625.000 822.718.125.000<br />
6580 15-Feb-27 7.835.938 51.560.468.750<br />
6608 15-Mar-27 14.623.359 96.631.154.620<br />
6655 1-May-27 20.250.000 134.763.750.000<br />
6669 15-May-27 7.835.938 52.257.867.188<br />
6720 5-Jul-27 162.872.813 1.094.505.300.000<br />
6730 15-Jul-27 125.625.000 845.456.250.000<br />
6761 15-Aug-27 7.835.938 52.978.773.438<br />
6792 15-Sep-27 14.623.359 99.321.852.630<br />
6839 1-Nov-27 20.250.000 138.489.750.000<br />
6853 15-Nov-27 7.835.938 53.699.679.688<br />
6880 12-Dec-27 670.186 4.610.882.632<br />
6914 15-Jan-28 125.625.000 868.571.250.000<br />
6945 15-Feb-28 7.835.938 54.420.585.938<br />
6974 15-Mar-28 14.623.359 101.983.303.923<br />
7021 1-May-28 620.250.000 4.354.775.250.000<br />
7035 15-May-28 7.835.938 55.125.820.313<br />
7086 5-Jul-28 162.872.813 1.154.116.749.375<br />
7096 15-Jul-28 125.625.000 891.435.000.000<br />
7127 15-Aug-28 7.835.938 55.846.726.563<br />
7158 15-Sep-28 14.623.359 104.674.001.933<br />
7219 15-Nov-28 7.835.938 56.567.632.813<br />
7246 12-Dec-28 670.186 4.856.170.865<br />
7280 15-Jan-29 125.625.000 914.550.000.000<br />
7311 15-Feb-29 7.835.938 57.288.539.063<br />
7339 15-Mar-29 14.623.359 107.320.829.866<br />
7400 15-May-29 7.835.938 57.985.937.500<br />
7451 5-Jul-29 162.872.813 1.213.565.325.938<br />
7461 15-Jul-29 125.625.000 937.288.125.000<br />
7492 15-Aug-29 7.835.938 58.706.843.750<br />
7523 15-Sep-29 14.623.359 110.011.527.876<br />
7584 15-Nov-29 7.835.938 59.427.750.000<br />
7611 12-Dec-29 670.186 5.100.788.911<br />
7645 15-Jan-30 125.625.000 960.403.125.000<br />
7676 15-Feb-30 7.835.938 60.148.656.250<br />
7704 15-Mar-30 14.623.359 112.658.355.810<br />
7765 15-May-30 7.835.938 60.846.054.688<br />
7816 5-Jul-30 162.872.813 1.273.013.902.500<br />
7826 15-Jul-30 125.625.000 983.141.250.000<br />
Javier Herrou Febrero 2009 Página 46 <strong>de</strong> 54
Valuación GM<br />
7857 15-Aug-30 7.835.938 61.566.960.938<br />
7888 15-Sep-30 14.623.359 115.349.053.820<br />
7949 15-Nov-30 7.835.938 62.287.867.188<br />
7976 12-Dec-30 670.186 5.345.406.958<br />
8010 15-Jan-31 125.625.000 1.006.256.250.000<br />
8041 15-Feb-31 7.835.938 63.008.773.438<br />
8069 15-Mar-31 14.623.359 117.995.881.754<br />
8130 15-May-31 7.835.938 63.706.171.875<br />
8181 5-Jul-31 162.872.813 1.332.462.479.063<br />
8191 15-Jul-31 125.625.000 1.028.994.375.000<br />
8222 15-Aug-31 7.835.938 64.427.078.125<br />
8253 15-Sep-31 14.623.359 120.686.579.764<br />
8314 15-Nov-31 7.835.938 65.147.984.375<br />
8341 12-Dec-31 670.186 5.590.025.004<br />
8375 15-Jan-32 125.625.000 1.052.109.375.000<br />
8406 15-Feb-32 7.835.938 65.868.890.625<br />
8435 15-Mar-32 14.623.359 123.348.031.056<br />
8496 15-May-32 7.835.938 66.574.125.000<br />
8547 5-Jul-32 162.872.813 1.392.073.928.438<br />
8557 15-Jul-32 125.625.000 1.074.973.125.000<br />
8588 15-Aug-32 7.835.938 67.295.031.250<br />
8619 15-Sep-32 14.623.359 126.038.729.066<br />
8680 15-Nov-32 7.835.938 68.015.937.500<br />
8707 12-Dec-32 670.186 5.835.313.237<br />
8741 15-Jan-33 125.625.000 1.098.088.125.000<br />
8772 15-Feb-33 7.835.938 68.736.843.750<br />
8800 15-Mar-33 14.623.359 128.685.557.000<br />
8861 15-May-33 7.835.938 69.434.242.188<br />
8912 5-Jul-33 2.107.622.813 18.783.134.505.000<br />
8922 15-Jul-33 3.125.625.000 27.886.826.250.000<br />
8953 15-Aug-33 7.835.938 70.155.148.438<br />
8984 15-Sep-33 14.623.359 131.376.255.010<br />
9045 15-Nov-33 7.835.938 70.876.054.688<br />
9072 12-Dec-33 670.186 6.079.931.284<br />
9137 15-Feb-34 7.835.938 71.596.960.938<br />
9165 15-Mar-34 14.623.359 134.023.082.944<br />
9226 15-May-34 7.835.938 72.294.359.375<br />
9318 15-Aug-34 7.835.938 73.015.265.625<br />
9349 15-Sep-34 14.623.359 136.713.780.954<br />
9410 15-Nov-34 7.835.938 73.736.171.875<br />
Javier Herrou Febrero 2009 Página 47 <strong>de</strong> 54
Valuación GM<br />
9437 12-Dec-34 670.186 6.324.549.330<br />
9502 15-Feb-35 7.835.938 74.457.078.125<br />
9530 15-Mar-35 14.623.359 139.360.608.888<br />
9591 15-May-35 7.835.938 75.154.476.563<br />
9683 15-Aug-35 7.835.938 75.875.382.813<br />
9714 15-Sep-35 14.623.359 142.051.306.898<br />
9775 15-Nov-35 7.835.938 76.596.289.063<br />
9802 12-Dec-35 670.186 6.569.167.377<br />
9867 15-Feb-36 7.835.938 77.317.195.313<br />
9896 15-Mar-36 392.000.359 3.879.235.550.190<br />
9957 15-May-36 7.835.938 78.022.429.688<br />
10049 15-Aug-36 7.835.938 78.743.335.938<br />
10141 15-Nov-36 7.835.938 79.464.242.188<br />
10168 12-Dec-36 670.186 6.814.455.610<br />
10233 15-Feb-37 7.835.938 80.185.148.438<br />
10322 15-May-37 7.835.938 80.882.546.875<br />
10414 15-Aug-37 7.835.938 81.603.453.125<br />
10506 15-Nov-37 7.835.938 82.324.359.375<br />
10533 12-Dec-37 670.186 7.059.073.657<br />
10598 15-Feb-38 7.835.938 83.045.265.625<br />
10687 15-May-38 7.835.938 83.742.664.063<br />
10779 15-Aug-38 7.835.938 84.463.570.313<br />
10871 15-Nov-38 7.835.938 85.184.476.563<br />
10898 12-Dec-38 670.186 7.303.691.703<br />
10963 15-Feb-39 7.835.938 85.905.382.813<br />
11052 15-May-39 7.835.938 86.602.781.250<br />
11144 15-Aug-39 7.835.938 87.323.687.500<br />
11236 15-Nov-39 7.835.938 88.044.593.750<br />
11263 12-Dec-39 670.186 7.548.309.750<br />
11328 15-Feb-40 7.835.938 88.765.500.000<br />
11418 15-May-40 7.835.938 89.470.734.375<br />
11510 15-Aug-40 7.835.938 90.191.640.625<br />
11602 15-Nov-40 7.835.938 90.912.546.875<br />
11629 12-Dec-40 670.186 7.793.597.983<br />
11694 15-Feb-41 7.835.938 91.633.453.125<br />
11783 15-May-41 7.835.938 92.330.851.563<br />
11875 15-Aug-41 7.835.938 93.051.757.813<br />
11967 15-Nov-41 7.835.938 93.772.664.063<br />
11994 12-Dec-41 670.186 8.038.216.029<br />
12059 15-Feb-42 7.835.938 94.493.570.313<br />
Javier Herrou Febrero 2009 Página 48 <strong>de</strong> 54
Valuación GM<br />
12148 15-May-42 7.835.938 95.190.968.750<br />
12240 15-Aug-42 7.835.938 95.911.875.000<br />
12332 15-Nov-42 7.835.938 96.632.781.250<br />
12359 12-Dec-42 670.186 8.282.834.076<br />
12424 15-Feb-43 7.835.938 97.353.687.500<br />
12513 15-May-43 7.835.938 98.051.085.938<br />
12605 15-Aug-43 7.835.938 98.771.992.188<br />
12697 15-Nov-43 7.835.938 99.492.898.438<br />
12724 12-Dec-43 670.186 8.527.452.123<br />
12789 15-Feb-44 7.835.938 100.213.804.688<br />
12879 15-May-44 7.835.938 100.919.039.063<br />
12971 15-Aug-44 7.835.938 101.639.945.313<br />
13063 15-Nov-44 7.835.938 102.360.851.563<br />
13090 12-Dec-44 670.186 8.772.740.356<br />
13155 15-Feb-45 7.835.938 103.081.757.813<br />
13244 15-May-45 7.835.938 103.779.156.250<br />
13336 15-Aug-45 7.835.938 104.500.062.500<br />
13428 15-Nov-45 7.835.938 105.220.968.750<br />
13455 12-Dec-45 670.186 9.017.358.402<br />
13520 15-Feb-46 7.835.938 105.941.875.000<br />
13609 15-May-46 7.835.938 106.639.273.438<br />
13701 15-Aug-46 7.835.938 107.360.179.688<br />
13793 15-Nov-46 7.835.938 108.081.085.938<br />
13820 12-Dec-46 670.186 9.261.976.449<br />
13885 15-Feb-47 7.835.938 108.801.992.188<br />
13974 15-May-47 7.835.938 109.499.390.625<br />
14066 15-Aug-47 7.835.938 110.220.296.875<br />
14158 15-Nov-47 7.835.938 110.941.203.125<br />
14185 12-Dec-47 670.186 9.506.594.495<br />
14250 15-Feb-48 7.835.938 111.662.109.375<br />
14340 15-May-48 432.835.938 6.206.867.343.750<br />
14551 12-Dec-48 14.779.374 215.054.677.011<br />
33.048.298.408 13,1<br />
Javier Herrou Febrero 2009 Página 49 <strong>de</strong> 54
Valuación GM<br />
E. ESTIMACIONES DE ANALISTAS<br />
RECOMMENDATION TRENDS<br />
Current<br />
Month<br />
Last Month<br />
Two Months<br />
Ago<br />
Three<br />
Months Ago<br />
Strong Buy 0 0 0 0<br />
Buy 0 0 0 1<br />
Hold 3 4 4 5<br />
Un<strong>de</strong>rperform 6 5 5 4<br />
Sell 3 3 2 2<br />
Date<br />
22-Dec-08<br />
10-Nov-08<br />
10-Nov-08<br />
UPGRADES & DOWNGRADES HISTORY<br />
Research<br />
Firm<br />
Credit<br />
Suisse<br />
Barclays<br />
Capital<br />
Deutsche<br />
Securities<br />
Action From To<br />
Downgra<strong>de</strong> Neutral Un<strong>de</strong>rperform<br />
Downgra<strong>de</strong> Equal Weight Un<strong>de</strong>rweight<br />
Downgra<strong>de</strong> Hold Sell<br />
08-Oct-08 Citigroup Downgra<strong>de</strong> Hold Sell<br />
27-May-08 Citigroup Downgra<strong>de</strong> Buy Hold<br />
25-Feb-08<br />
Deutsche<br />
Securities<br />
Downgra<strong>de</strong> Buy Hold<br />
06-Feb-08<br />
Bear<br />
Stearns<br />
Downgra<strong>de</strong> Peer Perform Un<strong>de</strong>rperform<br />
29-Nov-07<br />
Bear<br />
Stearns<br />
Upgra<strong>de</strong> Un<strong>de</strong>rperform Peer Perform<br />
30-Oct-07 UBS Upgra<strong>de</strong> Sell Buy<br />
16-Oct-07<br />
Bear<br />
Stearns<br />
Downgra<strong>de</strong> Peer Perform Un<strong>de</strong>rperform<br />
Javier Herrou Febrero 2009 Página 50 <strong>de</strong> 54
Valuación GM<br />
Analyst Estimates<br />
Earnings Est<br />
Current Qtr Next Qtr Current Year Next Year<br />
Dec-08 Mar-09 Dec-08 Dec-09<br />
Avg. Estimate -7.39 -3.75 -26.02 -19.69<br />
No. of<br />
Analysts<br />
10 3 11 12<br />
Low Estimate -11.33 -8.47 -30.50 -35.00<br />
High Estimate -5.32 -0.41 -19.19 -1.29<br />
Year Ago EPS 0.08 -0.62 -0.33 -26.02<br />
Revenue Est<br />
Current Qtr Next Qtr Current Year Next Year<br />
Dec-08 Mar-09 Dec-08 Dec-09<br />
Avg. Estimate 35.14B 29.23B 152.61B 135.68B<br />
No. of<br />
Analysts<br />
9 3 6 9<br />
Low Estimate 30.63B 24.54B 147.93B 112.97B<br />
High Estimate 39.93B 37.25B 158.70B 162.00B<br />
Year Ago<br />
Sales<br />
42.16B 42.13B 173.59B 152.61B<br />
Sales Growth<br />
(year/est)<br />
-16.6% -30.6% -12.1% -11.1%<br />
Earnings<br />
History<br />
Dec-07 Mar-08 J<strong>un</strong>-08 Sep-08<br />
EPS Est -0.59 -1.60 -2.62 -3.70<br />
EPS Actual 0.08 -0.62 -11.21 -7.35<br />
Difference 0.67 0.98 -8.59 -3.65<br />
Surprise % 113.6% 61.3% -327.9% -98.6%<br />
Growth Est GM Industry Sector S&P 500<br />
Current Qtr. -9337.5% -495.9% -35.4% -30.1%<br />
Next Qtr. -504.8% N/A 30.9% 28.1%<br />
Javier Herrou Febrero 2009 Página 51 <strong>de</strong> 54
Valuación GM<br />
This Year -7784.8% N/A 19.8% -8.5%<br />
Next Year 24.3% N/A 50.4% 26.6%<br />
Past 5 Years<br />
(per annum)<br />
Next 5 Years<br />
(per annum)<br />
Price/Earnings<br />
(avg. for<br />
comparison<br />
categories)<br />
PEG Ratio<br />
(avg. for<br />
comparison<br />
categories)<br />
-32.13% N/A N/A N/A<br />
7.25% 12.79% 9.88% N/A<br />
N/A N/A 18.73 13.41<br />
N/A N/A 1.9 N/A<br />
Javier Herrou Febrero 2009 Página 52 <strong>de</strong> 54
Valuación GM<br />
F. VOLATILADAD<br />
Fuente: Bloomberg<br />
Fuente: Deutsche Bank<br />
Javier Herrou Febrero 2009 Página 53 <strong>de</strong> 54
Valuación GM<br />
VI. BIBLIOGRAFIA<br />
⇒ Aswath Damodaran, “Investment Valuation”, CH 30 - VALUING EQUITY IN DISTRESSED<br />
FIRMS<br />
⇒<br />
Javier Herrou Febrero 2009 Página 54 <strong>de</strong> 54