- Page 1 and 2:
Danmarks Statistik STATISTISK ÅRBO
- Page 3 and 4:
Forord Statistisk Årbog er i forbi
- Page 5 and 6:
Indhoidsfortegnelse
- Page 7 and 8:
LIST OF CONTENTS Tables Pages 1-380
- Page 9 and 10:
Arresthuse 109, 112 Arveafgift, sta
- Page 11 and 12:
Døde, kvotient 19 -, prognose 45 -
- Page 13 and 14:
Fuelolie, se olie Fugtighedsgrad 9
- Page 15 and 16:
Industri, omsætning i 210, 219 -,
- Page 17 and 18:
Læder, omsætning i industri.. 210
- Page 19 and 20:
Pensioner, udgifter 94, 313, 340 Pe
- Page 21 and 22:
Statsskatter, ejendomsskatter, sels
- Page 23 and 24:
Vurderingskredse, antal 4 VVS-insta
- Page 25 and 26:
Afsnittet omfatter oplysninger om D
- Page 27 and 28:
Tabel 1. Danmarks areal, folketal o
- Page 29 and 30:
Tabel 3. Hele landet Byer og landdi
- Page 31 and 32:
Tabel 5. Arealer efter anvendelse.
- Page 33 and 34:
Tabel 8. Meteorologiske forhold. Ne
- Page 35 and 36:
Tabel 10. Luftens indhold af svæve
- Page 37 and 38:
Tabel 12. Luftens indhold af svovld
- Page 39 and 40:
Tabel 15. Vandforbrug. Water consum
- Page 41 and 42:
Tabel 19. Råstofproduktionen. Extr
- Page 43 and 44:
Tabel 23. Folketal, fødte, døde,
- Page 45 and 46:
Tabel 25. Folketal efter køn, alde
- Page 47 and 48:
Tabel 26. (s. 22 26) Kommunekode' N
- Page 49 and 50:
Tabel 26. Folketal i byer med over
- Page 51 and 52:
Tabel 27. Folketal og areal i de en
- Page 53 and 54:
Tabel 27. Folketal og areal i de en
- Page 55 and 56:
Tabet 29. Ændringerne i amtskommun
- Page 57 and 58:
ANM. De aldersbetingede fertilitets
- Page 59 and 60:
Under 1 år 10 l-4 år 11 5-14 år
- Page 61 and 62:
Tabel 37. Middel levetid efter død
- Page 63 and 64:
Tabel 41. Ind- og udvandring efter
- Page 65 and 66:
Tabel 44. Vielser efter ægtefælle
- Page 67 and 68:
Tabel 48. Husstande efter antal per
- Page 69 and 70:
Tabel 52. Befolkningsprognose 1985-
- Page 71 and 72:
Tabel 55. Befolkningens boligforsyn
- Page 73 and 74:
Tabel 57. Boliger regionalt fordelt
- Page 75 and 76:
ANM. 1. Tabellen omfatter kun husst
- Page 77 and 78:
Tabel 63. Folketingsvatgene. Oversi
- Page 79 and 80:
Tabel 65. Folketingsvalget den 10.
- Page 81 and 82:
Tabel 67. Folkeafstemninger. Refere
- Page 83 and 84:
Tabel 70. Valgene til Europa-parlam
- Page 85 and 86:
Anerkendte trossam fund står uden
- Page 87 and 88:
Tabel 73. Almene uddannelser. Gener
- Page 89 and 90:
Tabel 74. Erhvervsuddannelser og vi
- Page 91 and 92:
Tabel 74. Erhvervsuddannelser og vi
- Page 93 and 94:
Tabel 74. Erhvervsuddannelser og vi
- Page 95 and 96:
Elevbestand Tilgang Afgang me eksam
- Page 97 and 98:
Tabel 76. Videregående uddannelses
- Page 99 and 100:
Tabel 76. Videregående uddannelses
- Page 101 and 102:
Tabel 78. Amtskommunale enkeltfagsk
- Page 103 and 104:
Tabel 81. Statens Uddannelsesstøtt
- Page 105 and 106:
Tabel 85. Folkekirkens inddeling og
- Page 107 and 108:
Tabel 89. Rigsarkivet og landsarkiv
- Page 109 and 110:
Tabel 92. Danmarks Radio. The Danis
- Page 111 and 112:
Tabel 95. Statsstøttede teatre. Th
- Page 113 and 114:
Tabel 99. Besøg på museer og zool
- Page 115 and 116:
Afsnittet indeholder dels oplysning
- Page 117 and 118:
Tabel 102. Sociale institutioner og
- Page 119 and 120:
Tabel 104. Satser for kontante, soc
- Page 121 and 122:
Tabel 107. Bistand til børn og ung
- Page 123 and 124:
Tabel 111. Familier med kontanthjæ
- Page 125 and 126:
Tabel 115. Modtagere af social pens
- Page 127 and 128:
Formueafgift til staten. KILDE: År
- Page 129 and 130:
Tabel 121. Personale ved sygehuse o
- Page 131 and 132:
Anmeldte forbrydelser 1984 1985 107
- Page 133 and 134:
Tabel 127. Tiltalefrafald for overt
- Page 135 and 136:
Tabet 130. Domfældelser for overtr
- Page 137 and 138:
Tabel 133. Politiets virksomhed. Po
- Page 139 and 140:
Tabel 137. Den borgerlige retspleje
- Page 141 and 142:
ægtefæller. Antallet og klassific
- Page 143 and 144:
Tabel 140. Befolkningen efter køn,
- Page 145 and 146:
Tabel 142. Beskæftigede efter køn
- Page 147 and 148:
Restaurationsoghotelvirks. Trans- F
- Page 149 and 150:
Tabel 145. Det samlede personale i
- Page 151 and 152:
Ta bel 146. Lønmodtagerorganisatio
- Page 153 and 154:
Tabel 148. Den gennemsnitlige arbej
- Page 155 and 156:
Tabel 150. Den gennemsnitlige arbej
- Page 157 and 158:
1985 0,001- 0,200 i 0,201- 0,400 Le
- Page 159 and 160:
Afsnittet omfatter opgørelser af i
- Page 161 and 162:
Tabel 155. Bruttoind kornet for enl
- Page 163 and 164:
Tabel 158. Personlig indkomst for s
- Page 165 and 166:
Tabel 161. Personlig indkomst efter
- Page 167 and 168:
Indkomst og formue 143 Tabel 164. G
- Page 169 and 170:
Tabel 166. Gennemsnitsindkomster ef
- Page 171 and 172:
Tabel 168. Indkomst i de enkelte ko
- Page 173 and 174:
Tabel 168. Indkomst i de enkelte ko
- Page 175 and 176:
Tabel 168. Indkomst i de enkelte ko
- Page 177 and 178:
Tabel 170. Arbejdslønnen i forskel
- Page 179 and 180:
Tabel 172. Funktionærløn i forske
- Page 181 and 182:
Tabel 174. Lønstatistik for kommun
- Page 183 and 184:
Udgifter til: Bolig 8,4 Brændsel 5
- Page 185 and 186:
1981 RruttoRrutto- indkomst Direkte
- Page 187 and 188:
1981 telvstændige landmænd Selvst
- Page 189 and 190:
1981 1. Føde-, drikke- og tobaksva
- Page 191 and 192:
1981 Under 50000 kr. 50000- 99999 k
- Page 193 and 194:
(s.168-169) Consumption expenditure
- Page 195 and 196:
Tabel 187. Forbrug afdrikke-ogtobak
- Page 197 and 198:
Tabel 190. Engros- og råvarerprisi
- Page 199 and 200:
Tabel 190. Engros- og råvareprisin
- Page 201 and 202:
1980 = 100 Sammen- Sammen- vejnings
- Page 203 and 204:
Tabel 196. Reguleringspristallet i
- Page 205 and 206:
mandsforeningernes medlemmer. Det s
- Page 207 and 208:
Tabel 198. Landbrugsbedrifter efter
- Page 209 and 210:
Tabel 201. Landbrugsbedrifter med f
- Page 211 and 212:
Tabel 205. Høsten. Crop production
- Page 213 and 214:
Tabel 208. Landbrugets husdyrhold e
- Page 215 and 216:
Tabel 210. Pelsdyrhold. Fur farming
- Page 217 and 218:
Enhed 1980 2 193 Landbrug Tabel 213
- Page 219 and 220:
Tabel 215. Kapitelstakster for byg
- Page 221 and 222:
Tabel 218. Landbrugets bruttofaktor
- Page 223 and 224:
Enhed 1980 2 Fakturaværdier (fob.)
- Page 225 and 226:
Tabel 222. Saltvandsfiskeriet. Salt
- Page 227 and 228:
Tabel 225. Omsætning, im- og ekspo
- Page 229 and 230:
Oplysningerne til energibalancen og
- Page 231 and 232:
207 Industri og energi Tabel 227. I
- Page 233 and 234:
Antal virksomheder 1 Indehavere 2 2
- Page 235 and 236:
'SIC afd.' Industrigruppe 1983 1984
- Page 237 and 238:
Tabel 232. Industriens salg af vare
- Page 239 and 240:
Tabel 232. Industriens salg af vare
- Page 241 and 242:
31 Nærings- Linie nr. 29 Råstofud
- Page 243 and 244:
Tabel 235. Industriens produktionsv
- Page 245 and 246:
Tabel 237. Industriens energiforbru
- Page 247 and 248:
Tabel 238. Energibalance for Danmar
- Page 249 and 250:
Afsnittet omfatter oplysninger om s
- Page 251 and 252:
Tabel 241. Bygge-og anlægsvirksomh
- Page 253 and 254:
Construction employment. Quarterly
- Page 255 and 256:
Construction employment: salary ear
- Page 257 and 258:
Tabel 249. Boligbyggeriet. Resident
- Page 259 and 260:
Tabel 253. Bygningsbestanden. Build
- Page 261 and 262:
Tabel 255. Omsætning af bebyggede
- Page 263 and 264:
Kontantværdier Antal vurderinger 1
- Page 265 and 266:
1. januar 1981 Annual rent per mt b
- Page 267 and 268:
Bruttoregistertonnagen (BR T): Rumm
- Page 269 and 270:
Tabel 262. Skibsfarten på større
- Page 271 and 272:
Tabel 265. Søulykker og forlis af
- Page 273 and 274:
Tabel 269. Jernbanevæsenet. Railwa
- Page 275 and 276:
Tabel 270. Post- og telegrafvæsene
- Page 277 and 278:
Tabel 273. Bestanden af motorkøret
- Page 279 and 280:
Tabel 275. Bil- og passagertrafik p
- Page 281 and 282:
Tabel 280. National godstransport p
- Page 283 and 284:
Tabel 284. Færdselsuheld efter hov
- Page 285 and 286:
Tabel 287. S.A.S. produktion, trafi
- Page 287 and 288:
Tabel 290. Forud arrangerede ferie-
- Page 289 and 290:
Tabel 292. Overnatninger på campin
- Page 291 and 292:
ydelser. I den afgiftspligtige salg
- Page 293 and 294:
269 Generel erhvervsstatistik og ha
- Page 295 and 296:
Tabel 297. Momsregistrerede virksom
- Page 297 and 298:
Tabel 297. Momsregistrerede virksom
- Page 299 and 300:
275 Tabel 298. Regnskaber for aktie
- Page 301 and 302:
277 Generel erhvervsstatistik og ha
- Page 303 and 304:
279 1000 kr. Generel erhvervsstatis
- Page 305 and 306:
Tabel 302. Erhverv og dødelighed.
- Page 307 and 308:
Afsnittet omfatter opgørelser af i
- Page 309 and 310:
Tabel 304. Udenrigshandelens hovedt
- Page 311 and 312:
Tabel 306. Indførsel og udførsel
- Page 313 and 314:
289 Udenrigshandel Tabel 306. Indf
- Page 315 and 316:
291 Udenrigshandel Tabel 306. Indf
- Page 317 and 318:
1984 293 Udenrigshandel Tabel 307.
- Page 319 and 320:
295 Udenrigshandel Tabel 307. Udenr
- Page 321 and 322:
(efter produktionsgrene). Speciaiha
- Page 323 and 324:
og varegrupper (efter produktionsgr
- Page 325 and 326:
Afsnittet omfatter oplysninger om b
- Page 327 and 328:
Tabel 310. Danmarks internationale
- Page 329 and 330:
305 Penge- og kapitalmarked Tabel 3
- Page 331 and 332:
RealkreditinStitu terne' 1983 1984
- Page 333 and 334:
Tabel 318. Livsforsikringsselskaber
- Page 335 and 336:
Tabel 320. Skadesforsikring efter b
- Page 337 and 338:
Tabel 322. Pensionskasserne. Pensio
- Page 339 and 340:
Tabel 326. Tinglysninger af pantebr
- Page 341 and 342:
Tabel 330. Valutakurser i Københav
- Page 343 and 344:
Afsnittet omfatter oplysninger om D
- Page 345 and 346:
Tabel 334. Udviklingen på betaling
- Page 347 and 348:
eller tjenestestrøm, henføres til
- Page 349 and 350:
Tabel 336. Den offentlige sektors u
- Page 351 and 352:
Tabel 339. Den offentlige sektors f
- Page 353 and 354:
Tabel 342. Den offentlige sektors i
- Page 355 and 356: Tabel 344. Den offentlige sektors u
- Page 357 and 358: Tabel 347. Statens finanser. Sammen
- Page 359 and 360: Tabel 349. Statens finanser. Specif
- Page 361 and 362: Tabel 349. Statens finanser. Specif
- Page 363 and 364: Tabel 349. Statens finanser. Specif
- Page 365 and 366: Tabel 349. Statens finanser. Specif
- Page 367 and 368: Tabel 349. Statens finanser. Specif
- Page 369 and 370: Tabel 349. Statens finanser. Specif
- Page 371 and 372: Tabel 349. Statens finanser. Specif
- Page 373 and 374: Tabel 349. Statens finanser. Specif
- Page 375 and 376: Tabel 352. Primær- og amtskommuner
- Page 377 and 378: Tabel 354. Den kommunale sektors fi
- Page 379 and 380: Tabel 356. Primærkommunernes regns
- Page 381 and 382: Tabel 356. Primærkommunernes regns
- Page 383 and 384: Tabel 356. Primærkommunernes regns
- Page 385 and 386: Tabel 358. Folkekirkesektorens udgi
- Page 387 and 388: Tabel 362. Den samlede beskatning.
- Page 389 and 390: Indkomst- og formueskatter Personli
- Page 391 and 392: Tabel 367. Personindkomster og skat
- Page 393 and 394: Tabel 368. Don kommunale beskatning
- Page 395 and 396: Tabel 368. Den kommunale beskatning
- Page 397 and 398: Tabel 368. Den kommunale beskatning
- Page 399 and 400: Tabel 370. Bogførte told- og forbr
- Page 401 and 402: Tabel 372. Bilateral bistand fordel
- Page 403 and 404: Forbrug af fast realkapital skal an
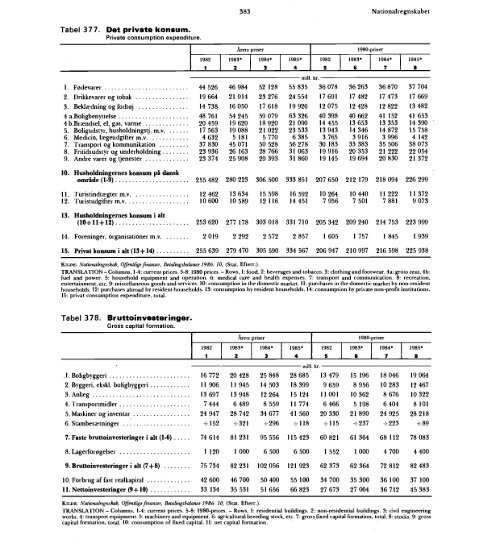
- Page 405: Tabel 375. Bruttofaktorindkometen,
- Page 409 and 410: Årets priser Bruttonationalprodukt
- Page 411 and 412: 1. Areal i km2 1984 2. Folkemængde
- Page 413 and 414: Tabel 385. Fertilitets- og reproduk
- Page 415 and 416: Tabel 389. Boligforholdene 22. sept
- Page 417 and 418: Tabel 393. Sociale udgifter i finan
- Page 419 and 420: Tabel 398. Færøernes fiskeri. The
- Page 421 and 422: SITC afsnit Imports into the Faroe
- Page 423 and 424: Driftsregnskab Indtægter Føroya B
- Page 425 and 426: Main items of the Faroese balance o
- Page 427 and 428: 1969 1970 ANM. Se anm. til tabel 41
- Page 429 and 430: 00 0 00 200 300 400 600 Reproducere
- Page 431 and 432: Tabel 416. Folketal for Grønland.
- Page 433 and 434: Tabel 419. Vielser, fødte og døde
- Page 435 and 436: Tabel 422. Døde pr. 1 000 personer
- Page 437 and 438: Tabel 426. Skolen i Grønland. Scho
- Page 439 and 440: Gnstl. timefortjeneste ekskl. overt
- Page 441 and 442: 1984 ANM. I opgørelsen indgår ale
- Page 443 and 444: Tabel 438. Produktion af de vigtigs
- Page 445 and 446: Tabel 441. Registrerede skibe i Gr
- Page 447 and 448: SITC vare-nr. Exports from Greenlan
- Page 449 and 450: ANM. Landskassen administreres af G
- Page 451 and 452: Virksomhedsform 1979 Kom- Enkeliman
- Page 453 and 454: Internationale oversigter 430 Tabel
- Page 455 and 456: Internationale oversigter 432 Tabel
- Page 457 and 458:
Internationale oversigter 434 Tabel
- Page 459 and 460:
Internationale oversigter 436 Tabel
- Page 461 and 462:
Internationale oversigter 438 Tabel
- Page 463 and 464:
Internationale oversigter 440 Tabel
- Page 465 and 466:
Internationale oversigter 442 Tabel
- Page 467 and 468:
Internationale oversigter 444 Tabel
- Page 469 and 470:
Internationale oversigter 446 Tabel
- Page 471 and 472:
Internationale oversigter 448 Tabel
- Page 473 and 474:
Internationale oversigter 450 Tabel
- Page 475 and 476:
Internationale oversigter 452 Tabel
- Page 477 and 478:
Internationale oversigter 454 Tabel
- Page 479 and 480:
Internationale oversigter 456 Tabel
- Page 481 and 482:
Internationale oversigter 458 Tabel
- Page 483 and 484:
Internationale oversigter 460 Tabel
- Page 485 and 486:
Internationale oversigter 462 Tabel
- Page 487 and 488:
Internationale oversigter 464 Tabel
- Page 489 and 490:
Internationale oversigter 466 Tabel
- Page 491 and 492:
Internationale oversigter 468 Tabel
- Page 493 and 494:
Internationale oversigter 470 Tabel
- Page 495 and 496:
Internationale oversigter 472 Tabel
- Page 497 and 498:
Internationale oversigter 474 Tabel
- Page 499 and 500:
Internationale oversigter 476 Tabel
- Page 501 and 502:
Internationale oversigter 478 Tabel
- Page 503 and 504:
Referencer Erhvervsgrupperingsbilag
- Page 505 and 506:
Referencer Erhvervsgrupperingsbilag
- Page 507 and 508:
Referencer 492 Erhvervsgrupperingsb
- Page 509 and 510:
Varenomenklatur-bilag
- Page 511 and 512:
Referencer Varenomenklatur-bilag (S
- Page 513 and 514:
Referencer Varenomenklatur-bilag (S
- Page 515 and 516:
Referencer 501 Varenomenklatur-bila
- Page 517 and 518:
Omsætningsforhold mellem dansk og
- Page 519 and 520:
482 DANMARKS STATISTIKS PUBLIKATION
- Page 521 and 522:
For at give brugerne mulighed for a
- Page 523 and 524:
Serien omfatter følgende publikati
- Page 525 and 526:
Building materials, imports 286 -,
- Page 527 and 528:
Furniture, price index 175 -, produ
- Page 529 and 530:
Petrol, duty 375 -, imports 286-287
- Page 531:
Value added, see also National acco


