UserContent/Shop/Tab 1_28 D.pdf - Erdöl-Vereinigung
UserContent/Shop/Tab 1_28 D.pdf - Erdöl-Vereinigung
UserContent/Shop/Tab 1_28 D.pdf - Erdöl-Vereinigung

Sie wollen auch ein ePaper? Erhöhen Sie die Reichweite Ihrer Titel.
YUMPU macht aus Druck-PDFs automatisch weboptimierte ePaper, die Google liebt.
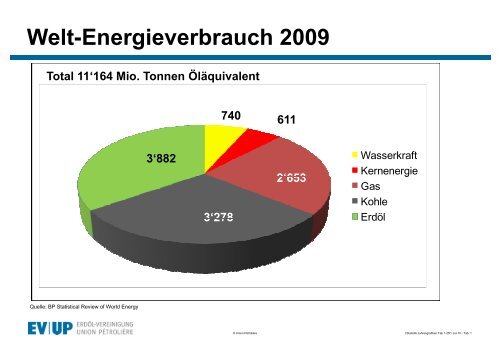
Welt-Energieverbrauch 2009<br />
Total 11‘164 Mio. Tonnen Öläquivalent<br />
Quelle: BP Statistical Review of World Energy<br />
3‘882<br />
3‘278 3 278<br />
740 611<br />
© Union Pétrolière<br />
2‘653<br />
Wasserkraft<br />
Kernenergie g<br />
Gas<br />
Kohle<br />
<strong>Erdöl</strong><br />
I:Statistik:Jahresgrafiken:<strong>Tab</strong> 1-25f / Jul-10 - <strong>Tab</strong>. 1
Energieverbrauch pro Kopf (kg Öläquivalent pro Tag)<br />
18 18.00 00<br />
16.00<br />
14.00<br />
12.00<br />
10.00<br />
800 8.00<br />
6.00<br />
4.00 00<br />
2.00<br />
0.00<br />
16,0<br />
10,6 10,5<br />
3,2 ,<br />
Nordamerika Schweiz EU- 27 Rest der Welt<br />
Quelle: BP Statistical Review of World Energy Energy, CIA –The The world Factbook Statistics<br />
© Union Pétrolière<br />
I:Statistik:Jahresgrafiken:<strong>Tab</strong> 1-25f / Jul-10 - <strong>Tab</strong>. 2
Welt-<strong>Erdöl</strong>produktion nach Regionen 2009<br />
in Mio. Tonnen<br />
Nordamerika<br />
6<strong>28</strong>,5<br />
Süd- und<br />
Zentral-<br />
Amerika<br />
Afrika<br />
459,3<br />
Europa<br />
217,3<br />
338,5 Mittlerer<br />
Osten<br />
1‘156,4<br />
Total<br />
Quelle: BP Statistical Review of World Energy<br />
Ehemalige<br />
Sowjetunion<br />
637,5<br />
Asien und<br />
Pazifik<br />
383,1<br />
1400<br />
1200<br />
1000<br />
800<br />
600<br />
3‘820,5 OECD: 22.5%<br />
OPEC: 41.2%<br />
© Union Pétrolière<br />
400<br />
200<br />
0<br />
I:Statistik:Jahresgrafiken:<strong>Tab</strong> 1-25f / Jul-10 - <strong>Tab</strong>. 3
Welt-<strong>Erdöl</strong>verbrauch nach Regionen 2009<br />
in Mio. Tonnen<br />
Nordamerika<br />
1‘025,5<br />
Süd- und<br />
Zentral-<br />
Amerika<br />
Afrika<br />
144,2<br />
Europa<br />
740,6<br />
256,0 Mittlerer<br />
Osten<br />
336,3<br />
Total<br />
Quelle: BP Statistical Review of World Energy<br />
Ehemalige<br />
Sowjetunion<br />
173,3<br />
Asien und<br />
Pazifik<br />
1‘206,2<br />
1400<br />
1200<br />
1000<br />
800<br />
600<br />
3‘882,1 OECD: 53,4%<br />
EU 27: 17,3%<br />
© Union Pétrolière<br />
400<br />
200<br />
0<br />
I:Statistik:Jahresgrafiken:<strong>Tab</strong> 1-25f / Jul-10 - <strong>Tab</strong>. 4
Nachgewiesene <strong>Erdöl</strong>reserven nach Regionen 2009<br />
in Mia. Tonnen<br />
Nordamerika<br />
10,2<br />
Süd- und<br />
Zentral-<br />
Amerika<br />
Afrika<br />
16,9<br />
Europa<br />
1,9<br />
<strong>28</strong>,5 Mittlerer<br />
Osten<br />
102,0<br />
Ehemalige<br />
Sowjetunion<br />
16,6<br />
Asien und<br />
Pazifik<br />
5,6<br />
120<br />
100<br />
80<br />
60<br />
Total<br />
0<br />
181,7 OECD: 6,8%<br />
OPEC: 77,2%<br />
Quelle: BP Statistical Review of World Energy<br />
© Union Pétrolière<br />
40<br />
20<br />
I:Statistik:Jahresgrafiken:<strong>Tab</strong> 1-25f / Jul-10 - <strong>Tab</strong>. 5
Reichweite der <strong>Erdöl</strong>reserven (in Jahren)<br />
50<br />
45<br />
40<br />
35<br />
30<br />
25<br />
20<br />
15<br />
10<br />
5<br />
0<br />
1970 1975 1980 1985 1990 1995 2000 2005 2008 2009<br />
Quelle: BP Statistical Review of World Energy<br />
© Union Pétrolière<br />
I:Statistik:Jahresgrafiken:<strong>Tab</strong> 1-25f / Jul-10 - <strong>Tab</strong>. 6
Wirtschaftliche Nutzung der <strong>Erdöl</strong>ressourcen<br />
IEA, Resources to Reserves, 2005<br />
© Union Pétrolière<br />
I:Statistik:Jahresgrafiken:<strong>Tab</strong> 1-25f / Jul-10 - <strong>Tab</strong>. 7
Auswirkungen der Technologiefortschritte<br />
Nordseeproduktion, IEA, Resources to Reserves, 2005<br />
© Union Pétrolière<br />
I:Statistik:Jahresgrafiken:<strong>Tab</strong> 1-25f / Jul-10 - <strong>Tab</strong>. 8
Investitionsbedarf bis 2030<br />
IEA, Resources to Reserves, 2005<br />
© Union Pétrolière<br />
I:Statistik:Jahresgrafiken:<strong>Tab</strong> 1-25f / Jul-10 - <strong>Tab</strong>. 9
Nachgewiesene Erdgasreserven nach Regionen<br />
(in Bio. m3) 1990 2000 2009 % 2009<br />
Nordamerika<br />
9,6 7,3 9,2 4,9<br />
Europa<br />
5,5 , 5,2 , 4,8 , 2,4 ,<br />
Ehemalige Sowjetunion 45,3 56,7 58,3 31,2<br />
Süd- und Zentralamerika 4,9 6,9 8,0 4,3<br />
Afrika<br />
81 8,1 11 11,2 2 14 14,8 8 79 7,9<br />
Mittlerer Osten<br />
37,6 52,5 76,2 40,6<br />
Asien und Australasien 8,4 10,3 16,2 8,7<br />
TTotall 119,4 150,2 187,5 100,0<br />
Welt-Verbrauch<br />
(in Mio Mio. Tonnen OE*) OE )<br />
1‘771,5 1 771,5 2‘164,0 2 164,0 2‘653,1 2 653,1<br />
Reichweite (in Jahren)<br />
* Öläquivalent q<br />
Quelle: BP Statistical Review of World Energy<br />
60,7 62,5 63,6<br />
© Union Pétrolière<br />
I:Statistik:Jahresgrafiken:<strong>Tab</strong> 1-25f / Jul-10 - <strong>Tab</strong>. 10
Entwicklung des Rohölpreises (in US$/Fass)<br />
© Union Pétrolière<br />
I:Statistik:Jahresgrafiken:<strong>Tab</strong> 1-25f / Jul-10 - <strong>Tab</strong>. 11
<strong>Erdöl</strong>verbrauch Schweiz (in 1'000 Tonnen)<br />
14'000<br />
12'000<br />
Treibstoffe<br />
10'000 Brennstoffe<br />
8'000<br />
6'000<br />
4'000 4 000<br />
2'000<br />
übrige<br />
0<br />
1999 2000 2001 2002 2003 2004 2005 2006 2007 2008 2009<br />
Quelle: Schweiz. Schweiz Gesamtenergiestatistik, Gesamtenergiestatistik Jahresbericht der <strong>Erdöl</strong> <strong>Erdöl</strong>-<strong>Vereinigung</strong><br />
<strong>Vereinigung</strong><br />
© Union Pétrolière<br />
I:Statistik:Jahresgrafiken:<strong>Tab</strong> 1-25f / Jul-10 - <strong>Tab</strong>. 12
Verbrauch der wichtigsten Produkte (in 1'000 t)<br />
6'000<br />
5'000<br />
4'000<br />
3'000<br />
2'000<br />
1'000<br />
0<br />
Autobenzine<br />
Flugtreibstoffe<br />
Dieselöl<br />
Heizöl EL<br />
1999 2000 2001 2002 2003 2004 2005 2006 2007 2008 2009<br />
Quelle: Jahresbericht der <strong>Erdöl</strong> <strong>Erdöl</strong>-<strong>Vereinigung</strong><br />
<strong>Vereinigung</strong><br />
© Union Pétrolière<br />
I:Statistik:Jahresgrafiken:<strong>Tab</strong> 1-25f / Jul-10 - <strong>Tab</strong>. 13
Verbrauch und Absatz von Heizöl EL (in 1'000 t)<br />
5'500 5 500<br />
5'000<br />
514<br />
186<br />
10<br />
503<br />
546<br />
375<br />
Verbrauch<br />
Lager Aufbau<br />
4'500 694<br />
4'000<br />
3'500<br />
3'000<br />
Quelle: Schweiz. Schweiz Gesamtenergiestatistik, Gesamtenergiestatistik Carbura (Grosshandelsabsatz)<br />
4<br />
Absatz<br />
Lager Abbau<br />
375 185<br />
2000 2001 2002 2003 2004 2005 2006 2007 2008 2009<br />
© Union Pétrolière<br />
I:Statistik:Jahresgrafiken:<strong>Tab</strong> 1-25f / Jul-10 - <strong>Tab</strong>. 14
Endverbrauch der Energieträger (in Petajoules)<br />
900<br />
800<br />
700<br />
600<br />
500<br />
400<br />
300<br />
200 00<br />
100<br />
0<br />
<strong>Erdöl</strong> Strom<br />
Erdgas<br />
Total<br />
Übrige<br />
1999 2000 2001 2002 2003 2004 2005 2006 2007 2008 2009<br />
Quelle: Schweiz. Schweiz Gesamtenergiestatistik<br />
© Union Pétrolière<br />
I:Statistik:Jahresgrafiken:<strong>Tab</strong> 1-25f / Jul-10 - <strong>Tab</strong>. 15
Anteil der Energieträger am Endverbrauch 2009<br />
<strong>Erdöl</strong><br />
Strom<br />
Erdgas<br />
Holz<br />
Fernwärme<br />
KKohle hl<br />
Übrige<br />
Quelle: Schweiz. Gesamtenergiestatistik<br />
07% 0,7%<br />
12,1%<br />
41% 4,1%<br />
1,8%<br />
2,6%<br />
23,6%<br />
55,1%<br />
0 10 20 30 40 50 60<br />
© Union Pétrolière<br />
I:Statistik:Jahresgrafiken:<strong>Tab</strong> 1-25f / Jul-10 - <strong>Tab</strong>. 16
Preise für Heizenergie (in Rp./kWh)<br />
Basis: Jahresverbrauch 3‘000-6‘000 Liter<br />
Quelle: Landesindex der Konsumentenpreise Konsumentenpreise, Berechnung: <strong>Erdöl</strong> <strong>Erdöl</strong>-<strong>Vereinigung</strong><br />
<strong>Vereinigung</strong><br />
© Union Pétrolière<br />
I:Statistik:Jahresgrafiken:<strong>Tab</strong> 1-25f / Jul-10 - <strong>Tab</strong>. 17
Tankstellenpreise (in Rp./Liter)<br />
2000 2001 2002 2003 2004 2005 2006 2007 2008 2009<br />
Quelle: Landesindex der Konsumentenpreise<br />
© Union Pétrolière<br />
2010<br />
I:Statistik:Jahresgrafiken:<strong>Tab</strong> 1-25f / Jul-10 - <strong>Tab</strong>. 18
Fiskalbelastung (in Rp./Liter)<br />
200<br />
180<br />
160<br />
140<br />
120<br />
100<br />
80<br />
60<br />
40<br />
20<br />
0<br />
64.0% 6<br />
63,9% 6<br />
Bleifrei 95<br />
Anteil der Fiskalbelastung<br />
666,9%<br />
62,5% 6<br />
64,3% 6<br />
61,3%<br />
53,2% %<br />
54,6% %<br />
48,4% 4<br />
63,9%<br />
54,4% %<br />
00 01 02 03 04 05 06 07 08 09 10<br />
Quelle: Landesindex der Konsumentenpreise Konsumentenpreise, Jahresbericht der <strong>Erdöl</strong> <strong>Erdöl</strong>-<strong>Vereinigung</strong><br />
<strong>Vereinigung</strong><br />
63,7%<br />
Di Diesel l %<br />
Anteil der Fiskalbelastung<br />
60,7% %<br />
64,6%<br />
62,9% %<br />
63,0% %<br />
577,4%<br />
52,0%<br />
52,2%<br />
46,7%<br />
57,2% 5<br />
54,2%<br />
00 01 02 03 04 05 06 07 08 09 10<br />
© Union Pétrolière<br />
I:Statistik:Jahresgrafiken:<strong>Tab</strong> 1-25f / Jul-10 - <strong>Tab</strong>. 19
Fiskalerträge auf <strong>Erdöl</strong>produkten (in Mia. Fr.)<br />
Quelle: Oberzolldirektion, Oberzolldirektion Jahresbericht der <strong>Erdöl</strong> <strong>Erdöl</strong>-<strong>Vereinigung</strong><br />
<strong>Vereinigung</strong><br />
© Union Pétrolière<br />
I:Statistik:Jahresgrafiken:<strong>Tab</strong> 1-25f / Jul-10 - <strong>Tab</strong>. 20
Entwicklung NO 2-Immissionen (Jahresmittelwerte in µg/m 3 )<br />
2<br />
70<br />
60<br />
50<br />
40<br />
30<br />
Grenzwert LRV<br />
Bern (Stadtzentrum)<br />
20 Dübendorf (Agglomeration)<br />
10<br />
0<br />
Quelle: NABEL<br />
Davos (Land oberhalb 1000 m)<br />
1999 2000 2001 2002 2003 2004 2005 2006 2007 2008 2009<br />
© Union Pétrolière<br />
I:Statistik:Jahresgrafiken:<strong>Tab</strong> 1-25f / Jul-10 - <strong>Tab</strong>. 21
Entwicklung SO 2-Immissionen (Jahresmittelwerte in µg/m 3 )<br />
2<br />
40<br />
30<br />
20<br />
10<br />
0<br />
Grenzwert LRV<br />
Zürich (Stadtzentrum)<br />
Basel (Agglomeration)<br />
Rigi (Land oberhalb 1000 m)<br />
1999 2000 2001 2002 2003 2004 2005 2006 2007 2008 2009<br />
Quelle: NABEL<br />
© Union Pétrolière<br />
I:Statistik:Jahresgrafiken:<strong>Tab</strong> 1-25f / Jul-10 - <strong>Tab</strong>. 22
40<br />
30<br />
20<br />
Feinstaub-Immissionen (Jahresmittelwerte in µg/m 3 )<br />
10 Zürich (Stadtzentrum)<br />
0<br />
Quelle: NABEL<br />
Basel (Agglomeration)<br />
Grenzwert LRV<br />
Rigi (Land oberhalb 1000 m)<br />
1999 2000 2001 2002 2003 2004 2005 2006 2007 2008 2009<br />
Vor 1997: TSP-Messungen; seit 1997: PM10-Messungen<br />
© Union Pétrolière<br />
I:Statistik:Jahresgrafiken:<strong>Tab</strong> 1-25f / Jul-10 - <strong>Tab</strong>. 23
Energetische CO 2-Emissionen (in Mio. t)<br />
2<br />
50<br />
45<br />
40<br />
35<br />
Stand 1990<br />
-10% 10%<br />
30<br />
1990 1992 1994 1996 1998 2000 2002 2004 2006 2008 2010<br />
Quelle: BAFU (Emissionen gemäss CO CO2-Gesetz) Gesetz)<br />
© Union Pétrolière<br />
I:Statistik:Jahresgrafiken:<strong>Tab</strong> 1-25f / Jul-10 - <strong>Tab</strong>. 24
Entwicklung CO 2-Emissionen Treibstoffe<br />
20<br />
18<br />
16<br />
14<br />
12<br />
10<br />
in Mio. t<br />
Stand 1990<br />
-8%<br />
1990 1992 1994 1996 1998 2000 2002 2004 2006 2008 2010<br />
Quelle: BAFU (Emissionen gemäss CO 2-Gesetz)<br />
© Union Pétrolière<br />
I:Statistik:Jahresgrafiken:<strong>Tab</strong> 1-25f / Jul-10 - <strong>Tab</strong>. 25
Entwicklung CO 2-Emissionen Brennstoffe<br />
30<br />
<strong>28</strong><br />
26<br />
24<br />
22<br />
20<br />
in Mio. t<br />
Stand 1990<br />
-15% 15%<br />
1990 1992 1994 1996 1998 2000 2002 2004 2006 2008 2010<br />
Quelle: BAFU (Emissionen gemäss CO CO2-Gesetz) Gesetz)<br />
© Union Pétrolière<br />
I:Statistik:Jahresgrafiken:<strong>Tab</strong> 1-25f / Jul-10 - <strong>Tab</strong>. 26
Einfuhr von Rohöl und Fertigprodukten<br />
2008<br />
2009<br />
60 60,4% 4% Fertigprodukte<br />
39,6% Rohöl<br />
63 63,9% 9% Fertigprodukte<br />
36,1% Rohöl<br />
41 41,8% 8% Pipelines<br />
26 26,2% 2% Schiene<br />
24,7% Rheinschiffahrt<br />
Quelle: Jahresbericht der <strong>Erdöl</strong>-<strong>Vereinigung</strong><br />
© Union Pétrolière<br />
7,3% Strasse<br />
I:Statistik:Jahresgrafiken:<strong>Tab</strong> 1-25f / Jul-10 - <strong>Tab</strong>. 27
Herkunft von Rohöl und Fertigprodukten 2009<br />
<strong>Erdöl</strong><br />
Fertigprodukte<br />
aus der EU<br />
Strom<br />
Rohöl aus<br />
Afrika Erdgas<br />
Rohöl aus Holz dem 0%<br />
Mittleren Osten<br />
Fern Fernwärme ärme<br />
Übrige<br />
Kohle<br />
Quelle: Jahresbericht der <strong>Erdöl</strong>-<strong>Vereinigung</strong><br />
<strong>Erdöl</strong> <strong>Vereinigung</strong><br />
18%<br />
18%<br />
64%<br />
Übrige 0 10 20 30 40 50 60 70<br />
© Union Pétrolière<br />
I:Statistik:Jahresgrafiken:<strong>Tab</strong> 1-25f / Jul-10 - <strong>Tab</strong>. <strong>28</strong>