Immobilienmarkt Ostdeutschland Jahresvergleich 2006 – 2012
Immobilienmarkt Ostdeutschland Jahresvergleich 2006 – 2012
Immobilienmarkt Ostdeutschland Jahresvergleich 2006 – 2012

Erfolgreiche ePaper selbst erstellen
Machen Sie aus Ihren PDF Publikationen ein blätterbares Flipbook mit unserer einzigartigen Google optimierten e-Paper Software.
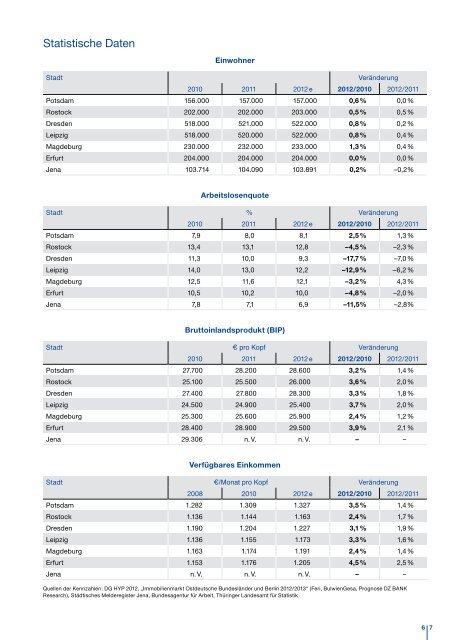
Statistische Daten<br />
Einwohner<br />
Stadt<br />
Veränderung<br />
2010 2011 <strong>2012</strong> e <strong>2012</strong>/2010 <strong>2012</strong>/2011<br />
Potsdam 156.000 157.000 157.000 0,6 % 0,0 %<br />
Rostock 202.000 202.000 203.000 0,5 % 0,5 %<br />
Dresden 518.000 521.000 522.000 0,8 % 0,2 %<br />
Leipzig 518.000 520.000 522.000 0,8 % 0,4 %<br />
Magdeburg 230.000 232.000 233.000 1,3 % 0,4 %<br />
Erfurt 204.000 204.000 204.000 0,0 % 0,0 %<br />
Jena 103.714 104.090 103.891 0,2% <strong>–</strong>0,2%<br />
Arbeitslosenquote<br />
Stadt % Veränderung<br />
2010 2011 <strong>2012</strong> e <strong>2012</strong>/2010 <strong>2012</strong>/2011<br />
Potsdam 7,9 8,0 8,1 2,5 % 1,3 %<br />
Rostock 13,4 13,1 12,8 <strong>–</strong>4,5% <strong>–</strong>2,3 %<br />
Dresden 11,3 10,0 9,3 <strong>–</strong>17,7 % <strong>–</strong>7,0 %<br />
Leipzig 14,0 13,0 12,2 <strong>–</strong>12,9 % <strong>–</strong>6,2 %<br />
Magdeburg 12,5 11,6 12,1 <strong>–</strong>3,2% 4,3 %<br />
Erfurt 10,5 10,2 10,0 <strong>–</strong>4,8% <strong>–</strong>2,0 %<br />
Jena 7,8 7,1 6,9 <strong>–</strong>11,5% <strong>–</strong>2,8%<br />
Bruttoinlandsprodukt (BIP)<br />
Stadt € pro Kopf Veränderung<br />
2010 2011 <strong>2012</strong> e <strong>2012</strong>/2010 <strong>2012</strong>/2011<br />
Potsdam 27.700 28.200 28.600 3,2 % 1,4 %<br />
Rostock 25.100 25.500 26.000 3,6 % 2,0 %<br />
Dresden 27.400 27.800 28.300 3,3 % 1,8 %<br />
Leipzig 24.500 24.900 25.400 3,7 % 2,0 %<br />
Magdeburg 25.300 25.600 25.900 2,4 % 1,2 %<br />
Erfurt 28.400 28.900 29.500 3,9 % 2,1 %<br />
Jena 29.306 n. V. n. V. <strong>–</strong>% <strong>–</strong>%<br />
Verfügbares Einkommen<br />
Stadt €/Monat pro Kopf Veränderung<br />
2008 2010 <strong>2012</strong> e <strong>2012</strong>/2010 <strong>2012</strong>/2011<br />
Potsdam 1.282 1.309 1.327 3,5 % 1,4 %<br />
Rostock 1.136 1.144 1.163 2,4 % 1,7 %<br />
Dresden 1.190 1.204 1.227 3,1 % 1,9 %<br />
Leipzig 1.136 1.155 1.173 3,3 % 1,6 %<br />
Magdeburg 1.163 1.174 1.191 2,4 % 1,4 %<br />
Erfurt 1.153 1.176 1.205 4,5 % 2,5 %<br />
Jena n. V. n. V. n. V. <strong>–</strong> % <strong>–</strong> %<br />
Quellen der Kennzahlen: DG HYP <strong>2012</strong>, „<strong>Immobilienmarkt</strong> Ostdeutsche Bundesländer und Berlin <strong>2012</strong>/2013“ (Feri, BulwienGesa, Prognose DZ BANK<br />
Research), Städtisches Melderegister Jena, Bundesagentur für Arbeit, Thüringer Landesamt für Statistik<br />
6 7