Head-Up-Guidance-Systeme und Mensch-Maschine - Zeitschrift für ...
Head-Up-Guidance-Systeme und Mensch-Maschine - Zeitschrift für ...
Head-Up-Guidance-Systeme und Mensch-Maschine - Zeitschrift für ...

Erfolgreiche ePaper selbst erstellen
Machen Sie aus Ihren PDF Publikationen ein blätterbares Flipbook mit unserer einzigartigen Google optimierten e-Paper Software.
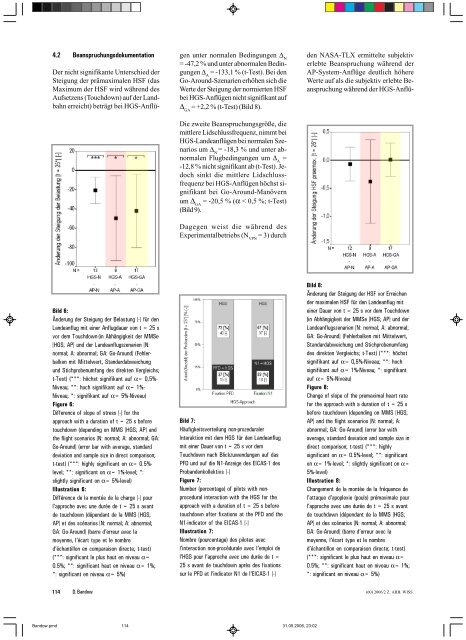
4.2 BeanspruchungsdokumentationDer nicht signifikante Unterschied derSteigung der prämaximalen HSF (dasMaximum der HSF wird während desAufsetzens (Touchdown) auf der Landbahnerreicht) beträgt bei HGS-Anflügenunter normalen Bedingungen Δ Ν= -47,2 % <strong>und</strong> unter abnormalen BedingungenΔ Α= -133,1 % (t-Test). Bei denGo-Aro<strong>und</strong>-Szenarien erhöhen sich dieWerte der Steigung der normierten HSFbei HGS-Anflügen nicht signifikant aufΔ GA= +2,2 % (t-Test) (Bild 8).Die zweite Beanspruchungsgröße, diemittlere Lidschlussfrequenz, nimmt beiHGS-Landeanflügen bei normalen Szenariosum Δ Ν= -18,3 % <strong>und</strong> unter abnormalenFlugbedingungen um Δ A=-12,8 % nicht signifikant ab (t-Test). Jedochsinkt die mittlere Lidschlussfrequenzbei HGS-Anflügen höchst signifikantbei Go-Aro<strong>und</strong>-Manövernum Δ GA= -20,5 % (α < 0,5 %; t-Test)(Bild 9).Dagegen weist die während desExperimentalbetriebs (N VPN= 3) durchden NASA-TLX ermittelte subjektiverlebte Beanspruchung während derAP-System-Anflüge deutlich höhereWerte auf als die subjektiv erlebte Beanspruchungwährend der HGS-Anflü-Bild 6:Änderung der Steigung der Belastung [-] für denLandeanflug mit einer Anflugdauer von t = 25 svor dem Touchdown (in Abhängigkeit der MMSe[HGS; AP] <strong>und</strong> der Landeanflugszenarien [N:normal; A: abnormal; GA: Go-Aro<strong>und</strong>] (Fehlerbalkenmit Mittelwert, Standardabweichung<strong>und</strong> Stichprobenumfang des direkten Vergleichs;t-Test) (***: höchst signifikant auf α= 0,5%-Niveau; **: hoch signifikant auf α= 1%-Niveau; *: signifikant auf α= 5%-Niveau)Figure 6:Difference of slope of stress [-] for theapproach with a duration of t = 25 s beforetouchdown (depending on MMS [HGS; AP] andthe flight scenarios [N: normal; A: abnormal; GA:Go-Aro<strong>und</strong>] (error bar with average, standarddeviation and sample size in direct comparison;t-test) (***: highly significant on α= 0.5%-level; **: significant on α= 1%-level; *:slightly significant on α= 5%-level)Illustration 6:Différence de la montée de la charge [-] pourl’approche avec une durée de t = 25 s avantde touchdown (dépendant de la MMS [HGS;AP] et des scénarios [N: normal; A: abnormal;GA: Go-Aro<strong>und</strong>] (barre d’erreur avec lamoyenne, l’écart type et le nombred’échantillon en comparaison directe; t-test)(***: significant le plus haut en niveau α=0.5%; **: significant haut en niveau α= 1%;*: significant en niveau α= 5%)Bild 7:Häufigkeitsverteilung non-prozeduralerInteraktion mit dem HGS für den Landeanflugmit einer Dauer von t = 25 s vor demTouchdown nach Blickzuwendungen auf dasPFD <strong>und</strong> auf die N1-Anzeige des EICAS-1 desProbandenkollektivs [-]Figure 7:Number (percentage) of pilots with nonproceduralinteraction with the HGS for theapproach with a duration of t = 25 s beforetouchdown after fixations at the PFD and theN1-indicator of the EICAS-1 [-]Illustration 7:Nombre (pourcentage) des pilotes avecl’interaction non-procédurale avec l’emploi del’HGS pour l’approche avec une durée de t =25 s avant de touchdown après des fixationssur le PFD et l’indicator N1 de l’EICAS-1 [-]Bild 8:Änderung der Steigung der HSF vor Erreichender maximalen HSF für den Landeanflug miteiner Dauer von t = 25 s vor dem Touchdown(in Abhängigkeit der MMSe [HGS; AP] <strong>und</strong> derLandeanflugszenarien [N: normal; A: abnormal;GA: Go-Aro<strong>und</strong>] (Fehlerbalken mit Mittelwert,Standardabweichung <strong>und</strong> Stichprobenumfangdes direkten Vergleichs; t-Test) (***: höchstsignifikant auf α= 0,5%-Niveau; **: hochsignifikant auf α= 1%-Niveau; *: signifikantauf α= 5%-Niveau)Figure 8:Change of slope of the premaximal heart ratefor the approach with a duration of t = 25 sbefore touchdown (depending on MMS [HGS;AP] and the flight scenarios [N: normal; A:abnormal; GA: Go-Aro<strong>und</strong>] (error bar withaverage, standard deviation and sample size indirect comparison; t-test) (***: highlysignificant on α= 0.5%-level; **: significanton α= 1%-level; *: slightly significant on α=5%-level)Illustration 8:Changement de la montée de la fréquence del’attaque d’apoplexie (pouls) prémaximale pourl’approche avec une durée de t = 25 s avantde touchdown (dépendant de la MMS [HGS;AP] et des scénarios [N: normal; A: abnormal;GA: Go-Aro<strong>und</strong>] (barre d’erreur avec lamoyenne, l’écart type et le nombred’échantillon en comparaison directe; t-test)(***: significant le plus haut en niveau α=0.5%; **: significant haut en niveau α= 1%;*: significant en niveau α= 5%)114 D. Bandow(60) 2006/2 Z. ARB. WISS.Bandow.pmd 11431.05.2006, 23:02