ASEAN - Beschaffungsmarkt mit Potenzial
ASEAN - Beschaffungsmarkt mit Potenzial
ASEAN - Beschaffungsmarkt mit Potenzial

Sie wollen auch ein ePaper? Erhöhen Sie die Reichweite Ihrer Titel.
YUMPU macht aus Druck-PDFs automatisch weboptimierte ePaper, die Google liebt.
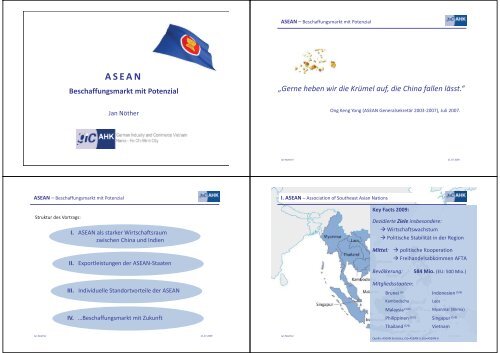
<strong>ASEAN</strong><br />
<strong>Beschaffungsmarkt</strong> <strong>mit</strong> <strong>Potenzial</strong><br />
Jan Nöther<br />
Jan Noether 21.07.2009<br />
<strong>ASEAN</strong> – <strong>Beschaffungsmarkt</strong> <strong>mit</strong> <strong>Potenzial</strong><br />
Struktur des Vortrags:<br />
I. <strong>ASEAN</strong> als starker Wirtschaftsraum<br />
zwischen China und Indien<br />
II. Exportleistungen der <strong>ASEAN</strong>-Staaten<br />
III. Individuelle Standortvorteile der <strong>ASEAN</strong><br />
IV. …<strong>Beschaffungsmarkt</strong> <strong>mit</strong> Zukunft<br />
Jan Noether 21.07.2009<br />
<strong>ASEAN</strong> – <strong>Beschaffungsmarkt</strong> <strong>mit</strong> <strong>Potenzial</strong><br />
„Gerne heben wir die Krümel auf, die China fallen lässt.“<br />
Ong Keng Yong (<strong>ASEAN</strong> Generalsekretär 2003-2007), Juli 2007.<br />
Jan Noether 21.07.2009<br />
I. <strong>ASEAN</strong> – Association of Southeast Asian Nations<br />
Key Facts 2009:<br />
Dezidierte Ziele insbesondere:<br />
� Wirtschaftswachstum<br />
� Politische Stabilität in der Region<br />
Mittel: � politische Kooperation<br />
� Freihandelsabkommen AFTA<br />
Bevölkerung: 584 Mio. (EU: 500 Mio.)<br />
Mitgliedsstaaten:<br />
Brunei (6) Indonesien (5/6)<br />
Kambodscha Laos<br />
Malaysia (5/6) Myanmar (Birma)<br />
Philippinen (5/6) Singapur (5/6)<br />
Thailand (5/6) Vietnam<br />
Jan Noether 21.07.2009<br />
Quelle: <strong>ASEAN</strong> Statistics. (5)=<strong>ASEAN</strong>-5, (6)=<strong>ASEAN</strong>-6
15%<br />
10%<br />
-5%<br />
-10%<br />
I. <strong>ASEAN</strong> – Wirtschaftliche Dynamik<br />
5%<br />
0%<br />
Reales BIP-Wachstum<br />
7,12 %<br />
2000 2001 2002 2003 2004 2005 2006 2007 2008 2009 2010 2011 2012 2013 2014<br />
China Indien Deutschland <strong>ASEAN</strong> Durchschnitt<br />
Quelle: IMF WEO.<br />
Für <strong>ASEAN</strong> ungewichteter Durchschnitt der Länderdaten zu konstanten<br />
Preisen. Fein/grob gestrichelte Werte vollständig/teilweise geschätzt.<br />
Jan Noether 21.07.2009<br />
I. <strong>ASEAN</strong> – Wirtschaftliche Entwicklung<br />
High<br />
Human Development<br />
Medium<br />
Human Development<br />
1<br />
0,9<br />
0,8<br />
0,7<br />
0,6<br />
0,5<br />
0,4<br />
Entwicklungsstand der <strong>ASEAN</strong>-Staaten 2006<br />
(gemessen an UN Human Development Index HDI)<br />
Kambodscha Myanmar<br />
Laos<br />
Vietnam<br />
Indonesien Philippinen<br />
Indien<br />
Jan Noether 21.07.2009<br />
China<br />
Singapur<br />
Thailand<br />
Malaysia<br />
Brunei Deutschland<br />
Quelle: UNDP.<br />
I. <strong>ASEAN</strong> – Wirtschaftliche Stärke und Entwicklung<br />
2657,6<br />
BIP 2008<br />
(PPP, in Mrd. US$)<br />
3288,4<br />
7916,4<br />
<strong>ASEAN</strong>-6 + Vietnam Indien China<br />
Quelle: IMF WEO.<br />
Werte teilweise geschätzt.<br />
<strong>ASEAN</strong>-5: Indonesien, Malaysia, Philippinen,<br />
Singapur, Thailand<br />
<strong>ASEAN</strong>-6: <strong>ASEAN</strong>-5 und Brunei<br />
ABER<br />
5280,7<br />
BIP pro Kopf 2008<br />
(PPP, in US$)<br />
2762,3<br />
5962,7<br />
<strong>ASEAN</strong>-6 + Vietnam Indien China<br />
UN Human Development Index (HDI) 2006<br />
<strong>ASEAN</strong>-6 + Vietnam Indien China<br />
Quelle: UNDP.<br />
<strong>ASEAN</strong> HDI: <strong>mit</strong> Bevölkerung gewichteter Durchschnitt.<br />
Jan Noether 21.07.2009<br />
<strong>ASEAN</strong> – <strong>Beschaffungsmarkt</strong> <strong>mit</strong> <strong>Potenzial</strong><br />
0,743<br />
I. <strong>ASEAN</strong> als starker Wirtschaftsraum<br />
zwischen China und Indien<br />
II. Exportleistungen der <strong>ASEAN</strong>-Staaten<br />
III. Individuelle Standortvorteile der <strong>ASEAN</strong><br />
IV. …<strong>Beschaffungsmarkt</strong> <strong>mit</strong> Zukunft<br />
(Lebenserwartung, Bildung, BIP pro Kopf)<br />
0,609<br />
Jan Noether 21.07.2009<br />
0,762
II. <strong>ASEAN</strong> – Exportleistungen der <strong>ASEAN</strong>-Staaten<br />
Gesamte Exporte <strong>ASEAN</strong> 2008:<br />
873,5 Mrd. US $<br />
davon in die EU-25:<br />
85,53 Mrd. US$<br />
fast bzw. 60%<br />
des deutschen 9,79 Exportvolumens<br />
%<br />
(994,9 Mrd. € bzw. 1530 Mrd. US$; 57%)<br />
Exportstruktur des <strong>ASEAN</strong>-Außenhandels<br />
Andere (Nicht-Top-10)<br />
28%<br />
1%<br />
3%<br />
1%<br />
2%<br />
2% 3% 3%<br />
Elektrotechnik, ,<br />
Elektronik<br />
206,84 Mrd. US US$ S$<br />
27%<br />
Mineralische<br />
Kraftstoffe, Öle etc.<br />
107,02 Mrd. US$<br />
$<br />
14%<br />
Reaktoren, Kess Kessel, sel,<br />
Maschinen und -teile t<br />
117,67 Mrd. US US$ S$<br />
16%<br />
Elektrotechnik, Elektronik Mineralische Kraftstoffe, Öle etc. Reaktoren, Kessel, Maschinen und Maschinenteile<br />
Kunststofferzeugnisse Organische Chemikalien Fahrzeuge (ohne Schiene), Fahrzeugteile<br />
Optik, Mess- und Regel-, Medizintechnik Eisen und Stahl Kautschukerzeugnisse<br />
Edel-, Schmucksteine, Edelmetalle, Perlen Andere (Nicht-Top-10)<br />
Quelle: <strong>ASEAN</strong> Statistics, Statistisches Bundesamt Deutschland, CIA World Factbook.<br />
Gütergruppenbezogene Daten von 2006 (nicht direkt vergleichbar <strong>mit</strong> Daten links).<br />
Jan Noether 21.07.2009<br />
II. <strong>ASEAN</strong> – Exportleistungen der <strong>ASEAN</strong>-Staaten<br />
Exporte nach Deutschland aus...<br />
(= dt. Importe)<br />
1<br />
Kambodscha<br />
Laos<br />
Bedeutung einzelner <strong>ASEAN</strong>-Staaten für den deutschen Außenhandel 2008<br />
(Perspektive Ausland, in Mrd. US$)<br />
8<br />
7<br />
6<br />
5<br />
4<br />
3<br />
2<br />
0<br />
Vietnam<br />
5,0<br />
Myanmar<br />
Indonesien<br />
7,2<br />
Philippinen<br />
3,9<br />
Thailand<br />
8,7<br />
Malaysia<br />
12,3<br />
Singapur<br />
13,4<br />
<strong>ASEAN</strong>-Exporte: 28,18 Mrd. US$<br />
<strong>ASEAN</strong>-Importe: 22,93 Mrd. US$<br />
0 1 2 3 4 5 6 7 8 9 10<br />
Brunei Darussalam<br />
Importe aus Deutschland nach... (= dt. Exporte)<br />
Quelle: Statistisches Bundesamt Deutschland.<br />
US$-Werte aus € zum Monatskurs.<br />
Jan Noether 21.07.2009<br />
II. <strong>ASEAN</strong> – Exportleistungen der <strong>ASEAN</strong>-Staaten<br />
Exporte nach Deutschland aus der <strong>ASEAN</strong><br />
(= dt. Importe)<br />
35<br />
30<br />
25<br />
20<br />
15<br />
10<br />
5<br />
Bedeutung der <strong>ASEAN</strong> für den deutschen Außenhandel 2002-2008<br />
(Perspektive Ausland, in Mrd. US$)<br />
2002<br />
25,8<br />
2004<br />
36,4<br />
2006<br />
41,4<br />
2008<br />
51,1<br />
Gesamtes<br />
Handelsvolumen<br />
5 10 15 20 25 30<br />
Importe aus Deutschland in die <strong>ASEAN</strong> (= dt. Exporte)<br />
Quelle: Statistisches Bundesamt Deutschland.<br />
US$-Werte aus € zum Monatskurs.<br />
Jan Noether 21.07.2009<br />
<strong>ASEAN</strong> – <strong>Beschaffungsmarkt</strong> <strong>mit</strong> <strong>Potenzial</strong><br />
I. <strong>ASEAN</strong> als starker Wirtschaftsraum<br />
zwischen China und Indien<br />
II. Exportleistungen der <strong>ASEAN</strong>-Staaten<br />
III. Individuelle Standortvorteile der <strong>ASEAN</strong><br />
IV. …<strong>Beschaffungsmarkt</strong> <strong>mit</strong> Zukunft<br />
Jan Noether 21.07.2009
III. <strong>ASEAN</strong> – Individuelle Standortvorteile: Lohnkosten<br />
Jan Noether 21.07.2009<br />
III. <strong>ASEAN</strong> – Individuelle Standortvorteile: unterschiedliche Risiken<br />
Risiken bei Geschäften in asiatischen Ländern (cont‘d)<br />
(Anteil befragter japanischer Investoren, die den jeweiligen Punkt als als zu berücksichtigendes Risiko empfanden)<br />
Jan Noether 21.07.2009<br />
Quelle: Japanese External Trade Organization (JETRO).<br />
III. <strong>ASEAN</strong> – Individuelle Standortvorteile: unterschiedliche Risiken<br />
Risiken bei Geschäften in asiatischen Ländern<br />
(Anteil befragter japanischer Investoren, die den jeweiligen Punkt als zu berücksichtigendes Risiko empfanden)<br />
Jan Noether 21.07.2009<br />
III. <strong>ASEAN</strong> – Individuelle Standortvorteile: unterschiedliche Risiken<br />
Jan Noether 21.07.2009<br />
Zahl in Klammern zeigt Rang 2007 an. Stichprobenumfang 2008: China 595,<br />
Thailand 376, Indonesien 278, Malaysia 264, Philippinen 193, Singapur 271,<br />
Vietnam 260, Indien 250. Bereiche Manufacturing, Trade & Wholesale, Retail.<br />
Quelle: Japanese External Trade Organization (JETRO).
III. <strong>ASEAN</strong> – Individuelle Standortvorteile<br />
Jan Noether 21.07.2009<br />
III. <strong>ASEAN</strong> – Individuelle Standortvorteile: Exportspezialisierung<br />
Exportspezialisierung: Chemische Erzeugnisse<br />
Singapur (*)<br />
Thailand<br />
Malaysia<br />
Indonesien<br />
Singapur (*)<br />
Thailand<br />
Malaysia<br />
Indonesien<br />
Exporte<br />
(weltweit, in Mrd. US$)<br />
0 5 10 15 20 25 30 35<br />
Exportanteil<br />
(in % der eigenen Gesamt-Exporte)<br />
0% 5% 10% 15% 20% 25%<br />
Quelle: gtai, Singapore Ministry of Trade and Industry.<br />
(*) absoluter Wert = Exporte minus Re-Exporte; relativer Wert =<br />
abs.Wert/domestic exports .<br />
Jan Noether 21.07.2009<br />
III. <strong>ASEAN</strong> – Individuelle Standortvorteile: Exportspezialisierung<br />
Exportspezialisierung: Elektronik, Elektrotechnik<br />
Malaysia<br />
Singapur(*)<br />
Thailand<br />
Philippinen<br />
Indonesien<br />
Malaysia<br />
Singapur(*)<br />
Thailand<br />
Philippinen<br />
Indonesien<br />
Exporte<br />
(weltweit, in Mrd. US$)<br />
0 10 20 30 40 50 60<br />
Exportanteil<br />
(in % der eigenen Gesamtexporte)<br />
0% 10% 20% 30% 40%<br />
Quelle: gtai, Singapore Ministry of Trade and Industry.<br />
(*) absoluter Wert = domestic exports electronics; relativer<br />
Wert = abs.Wert/domestic exports<br />
Jan Noether 21.07.2009<br />
III. <strong>ASEAN</strong> – Individuelle Standortvorteile: Exportspezialisierung<br />
Exportspezialisierung: Maschinen<br />
Thailand<br />
Singapur (*)<br />
Malaysia<br />
Indonesien<br />
Thailand<br />
Singapur (*)<br />
Malaysia<br />
Indonesien<br />
Exporte<br />
(weltweit, in Mrd. US$)<br />
0 2 4 6 8 10 12 14<br />
Exportanteil<br />
(in % der eigenen Gesamt-Exporte)<br />
0% 2% 4% 6% 8% 10%<br />
Quelle: gtai, Singapore Ministry of Trade and Industry.<br />
(*) domestic exports geschätzt <strong>mit</strong> 2/5 Re-Export (abgezogen).<br />
Jan Noether 21.07.2009
III. <strong>ASEAN</strong> – Individuelle Standortvorteile: Exportspezialisierung<br />
Exportspezialisierung: Kfz und -teile<br />
Thailand<br />
Indonesien<br />
Thailand<br />
Indonesien<br />
Exporte<br />
(weltweit, in Mrd. US$)<br />
0 2 4 6 8 10 12 14<br />
Exportanteil<br />
(in % der eigenen Gesamt-Exporte)<br />
0% 2% 4% 6% 8% 10%<br />
Jan Noether 21.07.2009<br />
<strong>ASEAN</strong> – <strong>Beschaffungsmarkt</strong> <strong>mit</strong> <strong>Potenzial</strong><br />
I. <strong>ASEAN</strong> als starker Wirtschaftsraum<br />
zwischen China und Indien<br />
II. Exportleistungen der <strong>ASEAN</strong>-Staaten<br />
III. Individuelle Standortvorteile<br />
IV. …<strong>Beschaffungsmarkt</strong> <strong>mit</strong> Zukunft<br />
Jan Noether 21.07.2009<br />
Quelle: gtai.<br />
III. <strong>ASEAN</strong> – Individuelle Standortvorteile: Exportspezialisierung<br />
Exportspezialisierung: Textilien, Bekleidung, Schuhe<br />
Indonesien<br />
Vietnam<br />
Vietnam inkl. Schuhe<br />
Kambodscha (inkl. Schuhe)<br />
Philippinen<br />
Myanmar (nur Textilien)<br />
Vietnam inkl. Schuhe<br />
Kambodscha (inkl. Schuhe)<br />
Myanmar (nur Textilien)<br />
Exporte<br />
(weltweit, in Mrd. US$)<br />
Indonesien<br />
Vietnam<br />
Philippinen<br />
0 2 4 6 8 10 12 14<br />
Exportanteil<br />
(in % der eigenen Gesamt-Exporte)<br />
0% 20% 40% 60% 80%<br />
Quelle: gtai.<br />
Jan Noether 21.07.2009<br />
IV. <strong>ASEAN</strong> – <strong>Beschaffungsmarkt</strong> <strong>mit</strong> Zukunft<br />
Umfrage unter den AHK-Geschäftsführern im Juni 2009:<br />
„Für die Produktion welcher Produktgruppen sehen Sie in Ihrem Standortland die größten Zukunftschancen?“<br />
Jan Noether 21.07.2009
IV. <strong>ASEAN</strong> – <strong>Beschaffungsmarkt</strong> <strong>mit</strong> Zukunft<br />
Jan Noether 21.07.2009<br />
A. Appendix<br />
Singapur<br />
Malaysia<br />
China<br />
Thailand<br />
Brunei Darussalam<br />
Indien<br />
Indonesien<br />
Globaler Mittelwert<br />
Vietnam<br />
Philippinen<br />
World Economic Forum Global Competitiveness Index (GCN)<br />
Score 2008-2009, 134 Länder<br />
4,54 Rang 39<br />
4,33 Rang 50<br />
4,25 Rang 55<br />
4,10 Rang 70<br />
4,09 Rang 71<br />
4,70 Rang 30<br />
4,60 Rang 34<br />
Jan Noether 21.07.2009<br />
4,20<br />
5,04 Rang 21<br />
5,53 Rang 5<br />
0 1 2 3 4 5 6<br />
Der GCN-Score errechnet sich aus 113 Werten der folgenden 12 Säulen:<br />
- Institutionen<br />
- Infrastruktur<br />
- Makroökonomische Stabilität<br />
- Gesundheit und Grundschulbildung<br />
- Höhere Bildung und Weiterbildung<br />
- Gütermarkteffizienz<br />
Quelle: World Economic Forum.<br />
- Arbeitsmarkteffizienz<br />
- Entwicklungsstand des Finanzmarktsystems<br />
- Technologische Entwicklung<br />
- Marktgröße<br />
- Entwicklungstand des Geschäftslebens („business<br />
sophistication“)<br />
- Innovationen<br />
IV. <strong>ASEAN</strong> – <strong>Beschaffungsmarkt</strong> <strong>mit</strong> Zukunft<br />
… Sie erinnern sich?<br />
„Gerne heben wir die Krümel auf, die China fallen lässt.“<br />
Jan Noether 21.07.2009<br />
A. Appendix<br />
<strong>ASEAN</strong> (innerhalb)<br />
27,63%<br />
Exporte der <strong>ASEAN</strong>-Staaten 2008 nach...<br />
Andere<br />
Pakistan<br />
Neuseeland<br />
Japan<br />
11,97%<br />
Südkorea<br />
Indien Australien 3,99%<br />
3,44% 3,84%<br />
USA<br />
12,84%<br />
China<br />
11,35%<br />
EU-25<br />
85,53 Mrd. US $<br />
9,79%<br />
Jan Noether 21.07.2009<br />
Kanada<br />
Russland<br />
Quelle: <strong>ASEAN</strong> Statistics; Statistisches Bundesamt Deutschland.
A. Appendix<br />
Vietnam inkl. Schuhe<br />
Kambodscha inkl. Schuhe<br />
Philippinen<br />
Myanmar (nur Textilien)<br />
Vietnam<br />
Kambodscha<br />
Textilien und Bekleidung<br />
Exporte (in Mrd. US$)<br />
Singapur<br />
Indonesien<br />
Vietnam<br />
0 5 10 15<br />
Textilien, Bekleidung und Schuhe<br />
Exporte (in Mrd. US$)<br />
0 2 4 6 8 10 12 14<br />
Singapur<br />
Indonesien<br />
Vietnam<br />
Vietnam inkl. Schuhe<br />
Kambodscha inkl. Schuhe<br />
Philippinen<br />
Myanmar (nur Textilien)<br />
Vietnam<br />
Kambodscha<br />
Textilien und Bekleidung<br />
Exportanteil (in %)<br />
0% 20% 40% 60% 80%<br />
Textilien, Bekleidung und Schuhe<br />
Exportanteil (in %)<br />
0% 20% 40% 60% 80%<br />
Textil = Vorerzeugnis<br />
Bekleidung/Schuhe = Fertigprodukt Quelle: gtai.<br />
Jan Noether 21.07.2009<br />
A. Appendix<br />
Malaysia<br />
Singapur(*)<br />
Thailand<br />
Philippinen<br />
Indonesien<br />
Singapur<br />
Elektronik und Elektrotechnik<br />
Exporte (in Mrd. US$)<br />
0 10 20 30 40 50 60<br />
Quelle: gtai, Singapore Ministry of Trade and Industry.<br />
Mess- und Regeltechnik<br />
Exporte (in Mrd. US$)<br />
0 5 10 15 20 25<br />
“Mess- und Regeltechnik” ist keine Untergruppe von<br />
“Elektronik” oder “Elektrotechnik”.<br />
Malaysia<br />
Singapur(*)<br />
Thailand<br />
Philippinen<br />
Indonesien<br />
(*) absoluter Wert = domestic exports electronics; relativer Wert = abs.Wert/domestic exports<br />
Singapur<br />
Elektronik und Elektrotechnik<br />
Exportanteil (in %)<br />
0% 10% 20% 30% 40%<br />
Mess- und Regeltechnik<br />
Exportanteil (in %)<br />
0% 2% 4% 6% 8%<br />
Quelle: gtai.<br />
Jan Noether 21.07.2009<br />
A. Appendix<br />
Thailand<br />
Singapur (*)<br />
Malaysia<br />
Indonesien<br />
Thailand<br />
Indonesien<br />
Maschinen<br />
Exporte (in Mrd. US$)<br />
0 2 4 6 8 10 12 14<br />
Quelle: gtai, Singapore Ministry of Trade and Industry.<br />
(*) domestic exports geschätzt <strong>mit</strong> 2/5 Re-Export (abgezogen).<br />
Kfz und -teile<br />
Exporte (in Mrd. US$)<br />
0 2 4 6 8 10 12 14<br />
“Kfz und –teile” ist keine Untergruppe von “Maschinen”.<br />
Thailand<br />
Singapur (*)<br />
Malaysia<br />
Indonesien<br />
Thailand<br />
Indonesien<br />
Maschinen<br />
Exportanteil (in %)<br />
0% 2% 4% 6% 8% 10%<br />
Kfz und -teile<br />
Exportanteil (in %)<br />
0% 2% 4% 6% 8% 10%<br />
Quelle: gtai.<br />
Jan Noether 21.07.2009<br />
A. Appendix<br />
Thailand<br />
Singapur<br />
Philippinen<br />
Singapur<br />
Thailand<br />
Philippinen<br />
Thailand<br />
Philippinen<br />
Büromaschinen/EDV<br />
Exporte (in Mrd. US$)<br />
0 5 10 15 20<br />
Elektronische Bauelemente<br />
Exporte (in Mrd. US$)<br />
0 10 20 30 40 50 60 70<br />
Nachrichtentechnik/Radio/TV<br />
Exporte (in Mrd. US$)<br />
0 1 2 3 4 5 6 7<br />
Thailand<br />
Singapur<br />
Philippinen<br />
Singapur<br />
Thailand<br />
Philippinen<br />
Thailand<br />
Philippinen<br />
“Büromaschinen/EDV”, “Elektronische Bauelemente” und “Nachrichtentechnik/Radio/TV”<br />
sind Untergruppen von “Elektronik”.<br />
Büromaschinen/EDV<br />
Exportanteil (in %)<br />
0% 2% 4% 6% 8% 10% 12% 14%<br />
Elektronische Bauelemente<br />
Exportanteil (in %)<br />
0% 5% 10% 15% 20% 25%<br />
Nachrichtentechnik/Radio/TV<br />
Exportanteil (in %)<br />
0% 1% 2% 3% 4% 5%<br />
Quelle: gtai.<br />
Jan Noether 21.07.2009
A. Appendix<br />
Singapur (*)<br />
Thailand<br />
Malaysia<br />
Indonesien<br />
Thailand<br />
Vietnam<br />
Indonesien<br />
Philippinen<br />
Myanmar<br />
Kambodscha<br />
Chemische Erzeugnisse<br />
Exporte (in Mrd. US$)<br />
0 5 10 15 20 25 30 35<br />
Quelle: gtai, Singapore Ministry of Trade and Industry.<br />
Nahrungs<strong>mit</strong>tel<br />
Exporte (in Mrd. US$)<br />
0 2 4 6 8 10 12 14 16 18<br />
Singapur (*)<br />
Thailand<br />
Malaysia<br />
Indonesien<br />
(*) absoluter Wert = Exporte minus Re-Exporte; relativer Wert = abs.Wert/domestic exports .<br />
Thailand<br />
Vietnam<br />
Indonesien<br />
Philippinen<br />
Myanmar<br />
Kambodscha<br />
Chemische Erzeugnisse<br />
Exportanteil (in %)<br />
0% 5% 10% 15% 20% 25%<br />
Nahrungs<strong>mit</strong>tel<br />
Exportanteil (in %)<br />
0% 5% 10% 15% 20% 25%<br />
Kambodscha: nur Reis und Fischereierzeugnisse<br />
Myanmar: nur landw. Erzeugnisse und Fischereiprodukte<br />
Quelle: gtai.<br />
Jan Noether<br />
Vietnam: nur Meeresfrüchte, Reis und Kaffee<br />
21.07.2009<br />
A. Appendix<br />
Malaysia<br />
Pflanzliche und tierische Fette und Öle<br />
Exporte (in Mrd. US$)<br />
0 5 10 15<br />
Malaysia<br />
Pflanzliche und tierische Fette und Öle<br />
Exportanteil (in %)<br />
0% 2% 4% 6% 8%<br />
Quelle: gtai.<br />
Jan Noether 21.07.2009