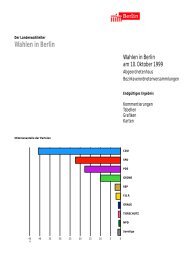
Der Landeswahlleiter Berlin Wahlen in Berlin Oktober <strong>2001</strong> 101 4.7 Mandate der Parteien im Abgeordnetenhaus von Berlin 1946 bis <strong>2001</strong> Wahltag 1 insgesamt 20. 10.1946 5 ..... 5. 12.1948 ....... 3. 12.1950 ....... 5. 12.1954 ....... 7. 12.1958 ....... 17. 2.1963 ....... 12. 3.1967 ....... 14. 3.1971 ....... 2. 3.1975 6 ..... 18. 3.1979 ....... 10. 5.1981 ....... 10. 3.1985 ....... 29. 1.1989 ....... 2. 12.1990 ....... 22. 10.1995 ....... 10. 10.1999 ....... 21. 10. <strong>2001</strong> ....... CDU SPD absolut SEW/ PDS2 1 2 3 4 5 1 1946 und 1948: Stadtverordnetenversammlung, 1948 bis 1989: in den 12 westlichen Bezirken 2 bis einschl. 1967: SED bzw. SED-W 3 bis 1989: AL; 1990 GRÜNE/AL, Bü90/Gr/UFV 4 1946 und 1948: LDP 5 Groß-Berlin 6 unter Berücksichtigung der Wiederholungswahl in Zehlendorf am 25.1.1976 GRÜNE 3 REP Mandate FDP 4 CDU 6 7 8 SPD SEW/ PDS in % 2 GRÜNE3 REP FDP 4 9 10 11 12 13 130 29 63 26 x x 12 22,3 48,4 20,0 x x 9,3 98 21 60 x x x 17 21,4 61,2 x x x 17,4 127 34 61 x x x 32 26,8 48,0 x x x 25,2 127 44 64 – x x 19 34,6 50,4 – x x 15,0 133 55 78 – x x – 41,4 58,6 – x x – 140 41 89 – x x 10 29,3 63,6 – x x 7,1 137 47 81 – x x 9 34,3 59,1 – x x 6,6 138 54 73 – x x 11 39,1 52,9 – x x 8,0 147 69 67 – x x 11 46,9 45,6 – x x 7,5 135 63 61 – – x 11 46,7 45,2 – – x 8,1 132 65 51 – 9 x 7 49,2 38,6 – 6,8 x 5,3 144 69 48 – 15 x 12 47,9 33,3 – 10,4 x 8,3 138 55 55 – 17 11 – 39,9 39,9 – 12,3 8,0 – 241 101 76 23 23 – 18 41,9 31,5 9,5 9,5 – 7,5 206 87 55 34 30 – – 42,2 26,7 16,5 14,6 – – 169 76 42 33 18 – – 45,0 24,9 19,5 10,7 – – 141 35 44 33 14 – 15 24,8 31,2 23,4 9,9 – 10,6
102 Wahlen in Berlin Oktober <strong>2001</strong> Der Landeswahlleiter Berlin 4.8 Direkt gewählte Abgeordnete nach der Wahl zum Abgeordnetenhaus von Berlin am 21. Oktober <strong>2001</strong> - Endgültiges Ergebnis - Wahlkreis Mitte ........................................................... 01 02 03 04 05 06 07 Friedrichshain-Kreuzberg .................. 01 02 03 04 05 Pankow ...................................................... 01 02 03 04 05 06 07 08 Charlottenburg-Wilmersdorf ........... 01 02 03 04 05 06 07 Spandau .................................................... 01 02 03 04 05 Steglitz-Zehlendorf .............................. 01 02 03 04 05 06 07 Tempelhof-Schöneberg ...................... 01 02 03 04 05 06 07 Neukölln ................................................... 01 02 03 04 05 06 Treptow-Köpenick ................................ 01 02 03 04 05 06 Name, Vorname 1 Partei 2 Erststimmen absolut 3 % 4 Stimmenvorsprung zum Zweitplazierten absolut 5 %-Punkte Hoff, Benjamin-Immanuel PDS 5 212 30,5 294 1,7 Freundl, Carola PDS 10 794 52,3 5 776 28,0 Pape, Andreas SPD 7 754 39,4 2 627 13,4 Leder, Jutta SPD 5 820 38,8 1 824 12,2 Fischer, Heidemarie SPD 7 424 42,0 1 377 7,8 Wieland, Ralf SPD 6 731 42,3 1 886 11,8 Schimmler, Bernd SPD 6 514 41,6 1 415 9,0 Strieder, Peter SPD 6 234 37,9 2 186 13,3 Oesterheld, Barbara GRÜNE 6 111 36,2 898 5,3 Zackenfels, Stefan SPD 4 932 31,3 261 1,7 Michels, Martina PDS 12 356 49,7 5 888 23,7 Over, Frederik PDS 10 528 42,8 3 945 16,1 Spindler, Jan PDS 7 959 38,9 1 666 8,1 Schaub, Siglinde PDS 8 787 36,9 1 179 4,9 Hinz, Delia PDS 8 739 42,6 2 462 12,0 Krüger, Marian PDS 7 420 37,0 1 399 7,0 Klemm, Gernot PDS 7 110 38,7 985 5,4 Nelken, Michail PDS 8 600 38,4 1 849 8,3 Seelig, Marion PDS 9 299 41,6 2 657 11,9 Holtfreter, Bernd PDS 8 099 36,7 1 759 8,0 Tesch, Felicitas Dr. SPD 8 168 40,3 1 278 6,3 Rabbach, Axel CDU 7 783 36,4 288 1,3 Radziwill, Ülker SPD 8 793 38,3 3 286 14,3 Jahnke, Frank SPD 8 286 40,3 3 450 16,8 Kurth, Peter CDU 9 311 36,9 553 2,2 Dunger-Löper, Hella SPD 9 616 39,9 2 367 9,8 Gaebler, Christian SPD 9 828 39,4 1 543 6,2 Kleineidam, Thomas SPD 9 006 42,0 906 4,2 Lorenz, Hans-Georg SPD 8 205 41,8 828 4,2 Buchholz, Daniel SPD 8 996 42,2 958 4,5 Grosse, Burgunde SPD 8 870 40,4 584 2,7 Trapp, Peter CDU 10 164 42,2 1 672 6,9 Böger, Klaus SPD 8 618 41,5 2 452 11,8 Neumann, Ulrike SPD 8 552 40,7 1 467 7,0 Hertlein, Jutta SPD 8 963 37,3 963 4,0 Borgis, Michael CDU 8 357 38,9 554 2,6 Friederici, Oliver CDU 7 712 39,8 506 2,6 Wellmann, Karl-Georg CDU 10 913 38,2 1 133 4,0 Braun, Michael CDU 10 501 36,3 1 003 3,5 Fugmann-Heesing, Annette Dr. SPD 9 824 42,9 3 865 16,9 Zimmermann, Frank SPD 7 775 38,7 2 261 11,2 Kolat, Dilek SPD 10 627 44,8 5 035 21,2 Müller, Michael SPD 9 529 38,5 550 2,2 Schmidt, Uwe CDU 10 682 41,2 1 244 4,8 Atzler, Norbert CDU 11 666 44,7 2 575 9,9 Zimmer, Nicolas CDU 10 762 42,2 198 0,8 Flesch, Kirsten SPD 7 769 38,9 2 330 11,7 Felgentreu, Fritz Dr. SPD 7 359 41,9 2 858 16,3 Hildebrandt, Petra SPD 7 541 40,5 509 2,7 Kaczmarek, Alexander CDU 10 016 42,6 1 368 5,8 Führer, Reinhard CDU 9 645 43,7 1 361 6,2 Steuer, Sascha CDU 10 849 43,2 1 769 7,0 Matuschek, Jutta PDS 7 565 41,2 1 465 8,0 Schneider, Michael PDS 8 984 43,4 2 675 12,9 Kaczmarczyk, Walter Dr. PDS 8 204 37,3 2 123 9,7 Dott, Minka PDS 6 922 39,9 1 770 10,2 Doering, Uwe PDS 8 412 37,2 805 3,6 Pewestorff, Norbert PDS 9 217 38,0 2 423 10,0 6