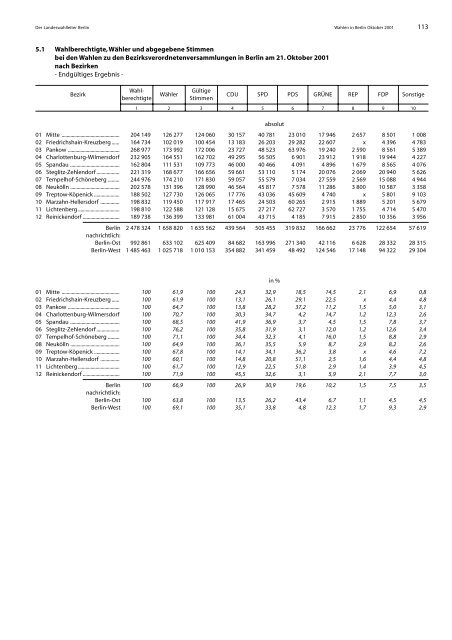
Der Landeswahlleiter Berlin Wahlen in Berlin Oktober <strong>2001</strong> 113 5.1 Wahlberechtigte, Wähler und abgegebene Stimmen bei den Wahlen zu den Bezirksverordnetenversammlungen in Berlin am 21. Oktober <strong>2001</strong> nach Bezirken - Endgültiges Ergebnis - Bezirk 01 Mitte .............................................. 02 Friedrichshain-Kreuzberg ...... 03 Pankow ......................................... 04 Charlottenburg-Wilmersdorf 05 Spandau ....................................... 06 Steglitz-Zehlendorf .................. 07 Tempelhof-Schöneberg ......... 08 Neukölln ....................................... 09 Treptow-Köpenick .................... 10 Marzahn-Hellersdorf ............... 11 Lichtenberg ................................. 12 Reinickendorf ............................. Berlin nachrichtlich: Berlin-Ost Berlin-West 01 Mitte .............................................. 02 Friedrichshain-Kreuzberg ...... 03 Pankow ......................................... 04 Charlottenburg-Wilmersdorf 05 Spandau ....................................... 06 Steglitz-Zehlendorf .................. 07 Tempelhof-Schöneberg ......... 08 Neukölln ....................................... 09 Treptow-Köpenick .................... 10 Marzahn-Hellersdorf ............... 11 Lichtenberg ................................. 12 Reinickendorf ............................. Berlin nachrichtlich: Berlin-Ost Berlin-West Wahlberechtigte 1 Wähler 2 Gültige Stimmen 3 CDU 4 SPD 5 absolut in % PDS 6 GRÜNE 7 REP 8 FDP 9 Sonstige 204 149 126 277 124 060 30 157 40 781 23 010 17 946 2 657 8 501 1 008 164 734 102 019 100 454 13 183 26 203 29 282 22 607 x 4 396 4 783 268 977 173 992 172 006 23 727 48 523 63 976 19 240 2 590 8 561 5 389 232 905 164 551 162 702 49 295 56 505 6 901 23 912 1 918 19 944 4 227 162 804 111 531 109 773 46 000 40 466 4 091 4 896 1 679 8 565 4 076 221 319 168 677 166 656 59 661 53 110 5 174 20 076 2 069 20 940 5 626 244 976 174 210 171 830 59 057 55 579 7 034 27 559 2 569 15 088 4 944 202 578 131 396 128 990 46 564 45 817 7 578 11 286 3 800 10 587 3 358 188 502 127 730 126 065 17 776 43 036 45 609 4 740 x 5 801 9 103 198 832 119 450 117 917 17 465 24 503 60 265 2 915 1 889 5 201 5 679 198 810 122 588 121 128 15 675 27 217 62 727 3 570 1 755 4 714 5 470 189 738 136 399 133 981 61 004 43 715 4 185 7 915 2 850 10 356 3 956 2 478 324 1 658 820 1 635 562 439 564 505 455 319 832 166 662 23 776 122 654 57 619 992 861 633 102 625 409 84 682 163 996 271 340 42 116 6 628 28 332 28 315 1 485 463 1 025 718 1 010 153 354 882 341 459 48 492 124 546 17 148 94 322 29 304 100 61,9 100 24,3 32,9 18,5 14,5 2,1 6,9 0,8 100 61,9 100 13,1 26,1 29,1 22,5 x 4,4 4,8 100 64,7 100 13,8 28,2 37,2 11,2 1,5 5,0 3,1 100 70,7 100 30,3 34,7 4,2 14,7 1,2 12,3 2,6 100 68,5 100 41,9 36,9 3,7 4,5 1,5 7,8 3,7 100 76,2 100 35,8 31,9 3,1 12,0 1,2 12,6 3,4 100 71,1 100 34,4 32,3 4,1 16,0 1,5 8,8 2,9 100 64,9 100 36,1 35,5 5,9 8,7 2,9 8,2 2,6 100 67,8 100 14,1 34,1 36,2 3,8 x 4,6 7,2 100 60,1 100 14,8 20,8 51,1 2,5 1,6 4,4 4,8 100 61,7 100 12,9 22,5 51,8 2,9 1,4 3,9 4,5 100 71,9 100 45,5 32,6 3,1 5,9 2,1 7,7 3,0 100 66,9 100 26,9 30,9 19,6 10,2 1,5 7,5 3,5 100 63,8 100 13,5 26,2 43,4 6,7 1,1 4,5 4,5 100 69,1 100 35,1 33,8 4,8 12,3 1,7 9,3 2,9 10
114 Merkmal Wahlen in Berlin Oktober <strong>2001</strong> Der Landeswahlleiter Berlin 5.2 Wahlberechtigte, Wähler und abgegebene Stimmen bei den Wahlen zu den Bezirksverordnetenversammlungen (BVV) in Berlin am 21. Oktober <strong>2001</strong> im Vergleich zur Vorwahl nach Bezirken - Endgültiges Ergebnis - Wahlberechtigte ..... Wähler ........................ Briefwähler ............ Abgegeb. Stimmen Ungültige Stimmen Gültige Stimmen .... CDU .............................. SPD ............................... PDS ............................... GRÜNE ........................ REP ............................... FDP ............................... GRAUE ......................... NPD .............................. APPD ........................... PASS ............................. Wahlberechtigte ..... Wähler ........................ Briefwähler ............ Abgegeb. Stimmen Ungültige Stimmen Gültige Stimmen .... CDU .............................. SPD ............................... PDS ............................... GRÜNE ........................ REP ............................... FDP ............................... GRAUE ......................... DKP .............................. STATT Partei .............. SED ............................... Wahlberechtigte ..... Wähler ........................ Briefwähler ............ Abgegeb. Stimmen Ungültige Stimmen Gültige Stimmen .... CDU .............................. SPD ............................... PDS ............................... GRÜNE ........................ REP ............................... FDP ............................... GRAUE ......................... NPD .............................. HP ................................. WBK ............................. APPD ........................... SAV ............................... BVV <strong>2001</strong> BVV 1999 Prozent- Merkmal absolut % absolut % absolut absolut % absolut % punkte 1 2 3 Mitte 4 Differenz 204 149 x 206 854 x - 2 705 x 126 277 61,9 121 256 58,6 5 021 3,3 22 412 17,7 24 370 20,1 - 1 958 - 2,4 126 228 x 121 199 x 5 029 x 2 168 1,7 1 360 1,1 808 0,6 124 060 98,3 119 839 98,9 4 221 - 0,6 30 157 24,3 42 302 35,3 - 12 145 - 11,0 40 781 32,9 31 046 25,9 9 735 7,0 23 010 18,5 20 311 16,9 2 699 1,6 17 946 14,5 16 313 13,6 1 633 0,9 2 657 2,1 4 398 3,7 - 1 741 - 1,6 8 501 6,9 1 799 1,5 6 702 5,4 x x 1 351 1,1 - 1 351 - 1,1 1 008 0,8 682 0,6 326 0,2 x x 179 0,1 - 179 - 0,1 x x 314 0,3 - 314 - 0,3 Friedrichshain-Kreuzberg 164 734 x 161 163 x 3 571 x 102 019 61,9 92 404 57,3 9 615 4,6 15 961 15,6 17 332 18,8 - 1 371 - 3,2 101 995 x 92 373 x 9 622 x 1 541 1,5 1 203 1,3 338 0,2 100 454 98,5 91 170 98,7 9 284 - 0,2 13 183 13,1 21 080 23,1 - 7 897 - 10,0 26 203 26,1 19 027 20,9 7 176 5,2 29 282 29,1 22 671 24,9 6 611 4,2 22 607 22,5 19 657 21,6 2 950 0,9 x x 2 365 2,6 - 2 365 - 2,6 4 396 4,4 952 1,0 3 444 3,4 1 410 1,4 1 122 1,2 288 0,2 402 0,4 116 0,1 286 0,3 1 079 1,1 x x 1 079 1,1 1 892 1,9 3 057 3,4 - 1 165 - 1,5 Pankow 268 977 x 259 282 x 9 695 x 173 992 64,7 160 189 61,8 13 803 2,9 26 724 15,4 27 387 17,1 - 663 - 1,7 173 952 x 160 161 x 13 791 x 1 946 1,1 1 395 0,9 551 0,2 172 006 98,9 158 766 99,1 13 240 - 0,2 23 727 13,8 41 018 25,8 - 17 291 - 12,0 48 523 28,2 32 139 20,2 16 384 8,0 63 976 37,2 57 070 35,9 6 906 1,3 19 240 11,2 16 765 10,6 2 475 0,6 2 590 1,5 4 625 2,9 - 2 035 - 1,4 8 561 5,0 1 716 1,1 6 845 3,9 x x 841 0,5 - 841 - 0,5 2 371 1,4 1 867 1,2 504 0,2 980 0,6 455 0,3 525 0,3 x x 1 346 0,8 - 1 346 - 0,8 1 167 0,7 x x 1 167 0,7 871 0,5 435 0,3 436 0,2 5 6 Wahlberechtigte ..... Wähler ........................ Briefwähler ............ Abgegeb. Stimmen Ungültige Stimmen Gültige Stimmen .... CDU .............................. SPD ............................... PDS ............................... GRÜNE ........................ REP ............................... FDP ............................... GRAUE ......................... ödp ............................... WBK ............................. STATT Partei .............. Wahlberechtigte ..... Wähler ........................ Briefwähler ............ Abgegeb. Stimmen Ungültige Stimmen Gültige Stimmen .... CDU .............................. SPD ............................... PDS ............................... GRÜNE ........................ REP ............................... FDP ............................... GRAUE ......................... NPD .............................. ödp ............................... FWS .............................. Wahlberechtigte ..... Wähler ........................ Briefwähler ............ Abgegeb. Stimmen Ungültige Stimmen Gültige Stimmen .... CDU .............................. SPD ............................... PDS ............................... GRÜNE ........................ REP ............................... FDP ............................... GRAUE ......................... PASS ............................. WUB ............................. BVV <strong>2001</strong> 1 2 BVV 1999 3 Charlottenburg-Wilmersdorf 4 Differenz Prozent- absolut punkte 5 6 232 905 x 236 381 x - 3 476 x 164 551 70,7 160 000 67,7 4 551 3,0 35 940 21,8 39 963 25,0 - 4 023 - 3,2 164 492 x 159 922 x 4 570 x 1 790 1,1 1 908 1,2 - 118 - 0,1 162 702 98,9 158 014 98,8 4 688 0,1 49 295 30,3 73 881 46,8 - 24 586 - 16,5 56 505 34,7 42 631 27,0 13 874 7,7 6 901 4,2 5 503 3,5 1 398 0,7 23 912 14,7 24 566 15,5 - 654 - 0,8 1 918 1,2 3 002 1,9 - 1 084 - 0,7 19 944 12,3 5 444 3,4 14 500 8,9 2 293 1,4 x x 2 293 1,4 x x 296 0,2 - 296 - 0,2 745 0,5 1 381 0,9 - 636 - 0,4 1 189 0,7 x x 1 189 0,7 Spandau 162 804 x 162 154 x 650 x 111 531 68,5 106 011 65,4 5 520 3,1 20 172 18,1 21 966 20,7 - 1 794 - 2,6 111 453 x 105 957 x 5 496 x 1 680 1,5 1 747 1,6 - 67 - 0,1 109 773 98,5 104 210 98,4 5 563 0,1 46 000 41,9 55 018 52,8 - 9 018 - 10,9 40 466 36,9 33 047 31,7 7 419 5,2 4 091 3,7 3 429 3,3 662 0,4 4 896 4,5 4 766 4,6 130 - 0,1 1 679 1,5 2 709 2,6 - 1 030 - 1,1 8 565 7,8 1 605 1,5 6 960 6,3 2 089 1,9 1 776 1,7 313 0,2 648 0,6 623 0,6 25 0,0 529 0,5 367 0,4 162 0,1 810 0,7 479 0,5 331 0,2 Steglitz-Zehlendorf 221 319 x 221 848 x - 529 x 168 677 76,2 163 237 73,6 5 440 2,6 37 522 22,2 41 130 25,2 - 3 608 - 3,0 168 561 x 163 156 x 5 405 x 1 905 1,1 1 392 0,9 513 0,3 166 656 98,9 161 764 99,1 4 892 - 0,3 59 661 35,8 83 303 51,5 - 23 642 - 15,7 53 110 31,9 38 555 23,8 14 555 8,1 5 174 3,1 4 108 2,5 1 066 0,6 20 076 12,0 19 688 12,2 388 - 0,2 2 069 1,2 2 782 1,7 - 713 - 0,5 20 940 12,6 5 271 3,3 15 669 9,3 x x 495 0,3 - 495 - 0,3 1 219 0,7 x x 1 219 0,7 4 407 2,6 5 144 3,2 - 737 - 0,6