Using Your TI-83/84 Calculator for Hypothesis Testing: The ... - Rowan
Using Your TI-83/84 Calculator for Hypothesis Testing: The ... - Rowan
Using Your TI-83/84 Calculator for Hypothesis Testing: The ... - Rowan

Create successful ePaper yourself
Turn your PDF publications into a flip-book with our unique Google optimized e-Paper software.
<strong>Using</strong> <strong>Your</strong> <strong>TI</strong>-<strong>83</strong>/<strong>84</strong> <strong>Calculator</strong> <strong>for</strong> <strong>Hypothesis</strong> <strong>Testing</strong>:<br />
<strong>The</strong> Chi-Square Goodness-of-Fit Test<br />
Dr. Laura Schultz<br />
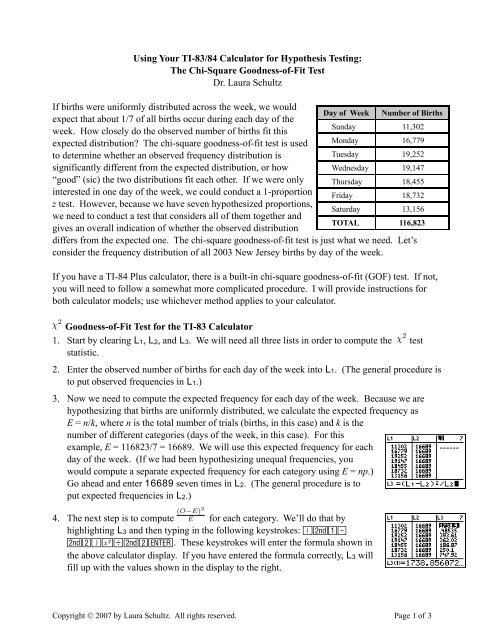
If births were uni<strong>for</strong>mly distributed across the week, we would<br />
expect that about 1/7 of all births occur during each day of the<br />
week. How closely do the observed number of births fit this<br />
Day of Week<br />
Sunday<br />
Number of Births<br />
11,302<br />
expected distribution? <strong>The</strong> chi-square goodness-of-fit test is used Monday 16,779<br />
to determine whether an observed frequency distribution is<br />
Tuesday 19,252<br />
significantly different from the expected distribution, or how<br />
Wednesday 19,147<br />
“good” (sic) the two distributions fit each other. If we were only Thursday 18,455<br />
interested in one day of the week, we could conduct a 1-proportion<br />
z test. However, because we have seven hypothesized proportions,<br />
we need to conduct a test that considers all of them together and<br />
gives an overall indication of whether the observed distribution<br />
Friday<br />
Saturday<br />
TOTAL<br />
18,732<br />
13,156<br />
116,823<br />
differs from the expected one. <strong>The</strong> chi-square goodness-of-fit test is just what we need. Let’s<br />
consider the frequency distribution of all 2003 New Jersey births by day of the week.<br />
If you have a <strong>TI</strong>-<strong>84</strong> Plus calculator, there is a built-in chi-square goodness-of-fit (GOF) test. If not,<br />
you will need to follow a somewhat more complicated procedure. I will provide instructions <strong>for</strong><br />
both calculator models; use whichever method applies to your calculator.<br />
χ 2 Goodness-of-Fit Test <strong>for</strong> the <strong>TI</strong>-<strong>83</strong> <strong>Calculator</strong><br />
1. Start by clearing L1, L2, and L3. We will need all three lists in order to compute the χ 2 test<br />
statistic.<br />
2. Enter the observed number of births <strong>for</strong> each day of the week into L1. (<strong>The</strong> general procedure is<br />
to put observed frequencies in L1.)<br />
3. Now we need to compute the expected frequency <strong>for</strong> each day of the week. Because we are<br />
hypothesizing that births are uni<strong>for</strong>mly distributed, we calculate the expected frequency as<br />
E = n/k, where n is the total number of trials (births, in this case) and k is the<br />
number of different categories (days of the week, in this case). For this<br />
example, E = 116823/7 = 16689. We will use this expected frequency <strong>for</strong> each<br />
day of the week. (If we had been hypothesizing unequal frequencies, you<br />
would compute a separate expected frequency <strong>for</strong> each category using E = np.)<br />
Go ahead and enter 16689 seven times in L2. (<strong>The</strong> general procedure is to<br />
put expected frequencies in L2.)<br />
4. <strong>The</strong> next step is to compute (O−E)2<br />
E <strong>for</strong> each category. We’ll do that by<br />
highlighting L3 and then typing in the following keystrokes: ( `1 -<br />
`2)q /`2e. <strong>The</strong>se keystrokes will enter the <strong>for</strong>mula shown in<br />
the above calculator display. If you have entered the <strong>for</strong>mula correctly, L3 will<br />
fill up with the values shown in the display to the right.<br />
Copyright © 2007 by Laura Schultz. All rights reserved. Page 1 of 3
5. Press `M to quit the stat editor and return to the home screen. Once we add up all of the<br />
entries in L3, we will have found the value of our chi-square test statistic:<br />
χ 2 = � (O − E) 2<br />
E<br />
We will use the sum function to do so. Press `S and scroll right to the<br />
MATH menu. <strong>The</strong>n, scroll down to 5:sum( and press e. Type `3)<br />
to indicate that you want to sum the contents of L3 and then press e.<br />
6. <strong>Your</strong> calculator will now display the value of χ 2 , which is 3679.866739 <strong>for</strong><br />
this example.<br />
7. Next, we need to find the P-value associated with our χ 2 test statistic. To do<br />
so, press `v to get the DISTR menu. Scroll down to 8:χ 2 cdf( and<br />
press e. We want to find the probability of obtaining a χ 2 test statistic<br />
of 3679.866739 or higher, so type 3679.866739,1`,99,6)e to<br />
tell your calculator to find the probability of obtaining a value between<br />
3679.866739 and 10 99 (an approximation <strong>for</strong> ∞) in a χ 2 distribution with 6<br />
degrees of freedom. (Find the number of degrees of freedom by subtracting<br />
one from the number of categories, or k - 1. For this example, there are seven<br />
categories and, hence, six degrees of freedom.)<br />
8. We obtained a very large χ 2 value, so you shouldn’t be surprised that there is a<br />
very small P-value associated with it. So small, in fact, that your calculator<br />
rounds it to 0. Don’t be alarmed when this happens; just indicate that the Pvalue<br />
is “near zero.” <strong>The</strong> P-value won’t be exactly zero, but we are unable to<br />
find out just how low it is <strong>for</strong> extremely large χ 2 values.<br />
9. Round chi-square values to 3 decimal places and P-values to 3 significant<br />
figures. You would report the results <strong>for</strong> this example as P( χ 2 > 3679.867) ≈ 0.<br />
10. What does this mean? If births were in fact distributed uni<strong>for</strong>mly across the seven days of the<br />
week, an observed χ 2 value of 3679.867 would occur about 0% of the time. This result is<br />
certainly unusual, so we reject H0 and conclude that the sample data are consistent with births<br />
being non-uni<strong>for</strong>mly distributed across the seven days of the week.<br />
χ 2 Goodness-of-Fit Test <strong>for</strong> the <strong>TI</strong>-<strong>84</strong> Plus <strong>Calculator</strong><br />
1. It is relatively easier to conduct a χ 2 goodness-of-fit test if you happen to have a <strong>TI</strong>-<strong>84</strong> Plus<br />
calculator. Steps 1-3 are the same as I described previously <strong>for</strong> the <strong>TI</strong>-<strong>83</strong> calculator (except that<br />
you only need to clear L1 and L2).<br />
2. Once you have entered the observed frequencies in L1 and the expected<br />
frequencies in L2, press S and scroll right to the TESTS menu. <strong>The</strong>n,<br />
scroll down to D:χ 2 GOF-Test and press e. <strong>Your</strong> calculator will<br />
prompt you <strong>for</strong> the list with the observed frequencies (L1 <strong>for</strong> this example),<br />
Copyright © 2007 by Laura Schultz. All rights reserved. Page 2 of 3
the list with the expected frequencies (L2 <strong>for</strong> this example), and the number of<br />
degrees of freedom. You can find the degrees of freedom by subtracting 1<br />
from the number of categories (k - 1); there are 6 degrees of freedom <strong>for</strong> this<br />
example. Next, highlight Calculate and press e.<br />
3. <strong>Your</strong> calculator will return the output shown to the right. It gives you both the<br />
value of the χ 2 test statistic and its associated P-value. CNTRB provides a<br />
list of the CoNTRiButions of each category to the overall χ 2 value. Use ><br />
to scroll through these numbers; note that CNTRB lists the same values that<br />
appear in L3 when you follow the <strong>TI</strong>-<strong>83</strong> calculator procedure above. Round<br />
chi-square values to 3 decimal places and P-values to 3 significant figures.<br />
You would report these results as P( χ 2 > 3679.867) ≈ 0.<br />
4. What does this mean? If births were in fact distributed uni<strong>for</strong>mly across the seven days of the<br />
week, an observed χ 2 value of 3679.867 would occur about 0% of the time. This result is<br />
certainly unusual, so we reject H0 and conclude that the sample data are consistent with births<br />
being non-uni<strong>for</strong>mly distributed across the seven days of the week.<br />
Below I have provided the <strong>for</strong>mal hypothesis test <strong>for</strong> this example. I will expect you to use this<br />
same <strong>for</strong>mat when reporting the results of a χ 2 goodness-of-fit test. Pay special attention to the<br />
wording of the conclusion and how I report the χ 2 value, degrees of freedom, and P-value at the<br />
end. This was an unusual hypothesis test in that the original claim became the null hypothesis.<br />
More typically, the original claim is tested as the alternative hypothesis.<br />
Claim: Births are evenly distributed across the seven days of the week.<br />
Let p1 = the proportion of births on Sunday, p2 = the proportion of births on Monday, ... ,<br />
and p7 = the proportion of births on Saturday.<br />
H0: p0 = p1 = p2 = p3 = p4 = p5 = p6 = p7 = 1/7 (Births are evenly distributed across the<br />
seven days of the week.)<br />
H1: At least one pi ≠ 1/7 (Births are not evenly distributed across the seven days of the<br />
week.)<br />
Conduct a χ 2 goodness-of-fit test with a significance level of α = .05<br />
Reject H0 because our P-value was near zero, and 0 < .05<br />
Conclusion: <strong>The</strong>re is sufficient evidence to warrant rejection of the claim that births are<br />
evenly distributed across the seven days of the week (χ 2 = 3679.867, df = 6, P ≈ 0).<br />
<strong>The</strong> M&Ms exercise that we will conduct during class tonight will provide you with an example of<br />
how to conduct a chi-square goodness-of fit-test in situations where the expected frequencies are<br />
not equal.<br />
Copyright © 2007 by Laura Schultz. All rights reserved. Page 3 of 3