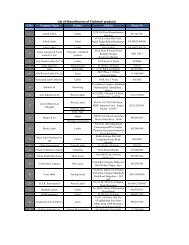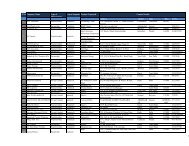
Domestic technical textiles Industry Segment-wise consumption of ...
Domestic technical textiles Industry Segment-wise consumption of ...
Domestic technical textiles Industry Segment-wise consumption of ...

You also want an ePaper? Increase the reach of your titles
YUMPU automatically turns print PDFs into web optimized ePapers that Google loves.
<strong>Domestic</strong> <strong>technical</strong> <strong>textiles</strong> <strong>Industry</strong><br />
India currently consumes the products under all twelve categories, though not all <strong>of</strong> them are<br />
produced domestically. The percentage <strong>of</strong> indigenous production varies drastically across various<br />
products. India is a large producer <strong>of</strong> <strong>technical</strong> <strong>textiles</strong> products in Packtech, Clothtech, Hometech and<br />
Sportech segments, the products <strong>of</strong> which are primarily commodities.<br />
Unlike the conventional textile industry in India which is highly export intensive, the <strong>technical</strong> textile<br />
industry is an import intensive industry. Many products like baby diapers, adult diapers, PP<br />
spunbound fabric for disposables, wipes, protective clothing, hoses, webbings for seat belts, etc. are<br />
imported to a very large extent.<br />
As mentioned earlier, the products with high production levels in India with substantial exports are<br />
typically commodity products and are not very R&D intensive. These products include flexible<br />
intermediate bulk containers (FIBCs), tarpaulins, jute carpet backing, hessian, fishnets, surgical<br />
dressings, crop covers, etc.<br />
Size <strong>of</strong> the units manufacturing the products also varies to a large extent. There is significant number<br />
<strong>of</strong> small scale units manufacturing <strong>technical</strong> textile products; this segment is highly unorganised in<br />
nature. Although there are various large players present, the production <strong>of</strong> certain goods is still<br />
concentrated in the small scale segment like canvas tarpaulin, carpet backing, woven sacks, shoe<br />
laces, s<strong>of</strong>t luggage, zip fasteners, stuffed toys, fabrication <strong>of</strong> awnings, canopies and blinds, etc.<br />
There are a few Multi National Companies like Ahlstrom, Johnson & Johnson, Du Pont, Procter &<br />
Gamble, 3M, SKAPs, Kimberly Clark, etc. which are internationally very large players in <strong>technical</strong><br />
<strong>textiles</strong> and have set up their units in India as well. There are some domestic players like SRF,<br />
Entremonde Polycoaters, Kusumgarh Corporates, Supreme Nonwovens Pvt. Ltd., Garware Wall<br />
Ropes, Century Enka, Techfab India Ltd., Pacific Non Woven, Vardhman, Unimin, etc which are also<br />
very large players in this industry.<br />
<strong>Segment</strong>-<strong>wise</strong> <strong>consumption</strong> <strong>of</strong> <strong>technical</strong> <strong>textiles</strong> in India<br />
The current market size 1 <strong>of</strong> <strong>technical</strong> textile in India is estimated to be around Rs 39,876 crore. The<br />
overall <strong>technical</strong> textile industry in India is expected to grow at the rate <strong>of</strong> 11% year on year and reach<br />
a market size <strong>of</strong> Rs 66,405 crore by the year 2012-13. The current <strong>technical</strong> textile <strong>consumption</strong> in<br />
India is estimated to be around Rs 37,118 crore which is estimated to increase to Rs 62,438 crore by<br />
1 Market Size includes domestic <strong>consumption</strong> and exports
the year 2012-13. The segment-<strong>wise</strong> estimates <strong>of</strong> market size and <strong>consumption</strong> <strong>of</strong> <strong>technical</strong> <strong>textiles</strong> in<br />
India in the year 2007-08 and forecasts for the year 2012-13 are given in the table below:<br />
<strong>Domestic</strong> Consumption (Rs crore) Market Size # (Rs crore)<br />
2007-08 (E) 2012-13 (P) 2007-08 (E) 2012-13 (P)<br />
Agrotech 487 709 553 811<br />
Meditech 1,514 2,263 1,669 2,263<br />
Mobiltech 3,161 5,137 3,183 5,166<br />
Packtech 14,067 25,913 14,630 26,753<br />
Sportech 2,632 4,358 2,851 4,761<br />
Buildtech 1,726 2,655 2,157 3,232<br />
Clothtech 6,570 9,665 6,908 10,225<br />
Hometech 3,191 5,300 3,263 5,392<br />
Protech 1,259 2,021 1,302 2,075<br />
Geotech 185 326 272 454<br />
Oekotech* 68 160 68 160<br />
Indutech 2,326 4,091 3,088 5,273<br />
Total 37,118 62,438 39,876 66,405<br />
*Oekeotech size has already been considered as a part <strong>of</strong> Geotech<br />
Source: IMaCS Analysis<br />
The largest category in the <strong>technical</strong> <strong>textiles</strong> industry <strong>of</strong> India is Packtech which has around 38%<br />
share. The domestic consumtion <strong>of</strong> Packtech currently is around Rs 14,067 crore and is expected to<br />
grow at the rate <strong>of</strong> 13% year on year to reach Rs 25,913 crore by 2012-13. Another very significant<br />
segment in the Indian <strong>technical</strong> <strong>textiles</strong> market is Clothtech, which has over 17% share <strong>of</strong> the<br />
<strong>technical</strong> <strong>textiles</strong> <strong>consumption</strong>. However, <strong>consumption</strong> <strong>of</strong> this segment is expected to register a<br />
growth <strong>of</strong> around 8% year on year and reach Rs 9,665 crore by 2012-13.<br />
Mobiltech and Hometech each has a share <strong>of</strong> around 8-9% in the total <strong>consumption</strong> and are expected<br />
to grow at 10-11% year on year for the next five years. Sportech which has a share <strong>of</strong> around 7% has<br />
above average growth potential <strong>of</strong> almost 11% year on year. It is expected to reach Rs 4,358 crore by<br />
2012-13.<br />
Indutech which currently has only about 6% share <strong>of</strong> the total domestic <strong>technical</strong> textile <strong>consumption</strong><br />
is expected to grow at 12% year on year for the next five years to reach Rs 4,091 crore. Rest <strong>of</strong> the<br />
segments have shares <strong>of</strong> less than 5%.<br />
Amongst the smaller segments, Protech has good growth potential. The current domestic <strong>consumption</strong><br />
<strong>of</strong> Protech is around Rs 1,259 crore and is expected to increase to almost Rs 2,021 crore by 2012-13<br />
growing at over 9-10% year on year.
<strong>Domestic</strong> consumotion <strong>of</strong> Oekotech is very small currently, only about Rs 68 crore, as its application<br />
is very low in India. However, over the next five years, this trend is expected to change and domestic<br />
<strong>consumption</strong> <strong>of</strong> Oekotech is expected to increase to Rs 160 crore by the year 2012-13 growing at<br />
around 19% y-o-y.<br />
Buildtech, Meditech and Agrotech are expected to achieve a moderate growth in line with the<br />
economic growth at around 8%. Usage <strong>of</strong> Geotech is also far below its potential in India as there is<br />
lack <strong>of</strong> awareness about its advantages. The growth <strong>of</strong> Geotech, which has only about 0.5% share <strong>of</strong><br />
<strong>consumption</strong> <strong>of</strong> <strong>technical</strong> textile in India, is dependent upon the Goverment regulations for its<br />
application and a strict supervision to ensure adequate use. The growth <strong>of</strong> this segment has been<br />
estimated at around 12%.<br />
Hence, we can conclude that Protech, Oekotech, Sportech, Oekotech, Geotech and Packtech are the<br />
segments with the maximum growth potential. Packtech and Clothtech followed by Mobiltech and<br />
Hometech are the largest segments and the main drivers <strong>of</strong> growth for the <strong>technical</strong> textile industry<br />
(considering present size as well as expected growth rate). The overall <strong>technical</strong> textile <strong>consumption</strong><br />
in India is expected to grow at the rate <strong>of</strong> 11% year on year to Rs 62,538 by the year 2012-13.
AGROTECH<br />
Agrotech includes <strong>technical</strong> textile products used in agriculture, horticulture (incl. Floriculture),<br />
fisheries and forestry. The <strong>technical</strong> textile products covered under Agrotech are given below:-<br />
• Shade-nets<br />
• Mulch-mats<br />
• Crop-covers<br />
• Anti-hail nets and bird protection nets<br />
• Fishing nets<br />
Technical <strong>textiles</strong> <strong>consumption</strong> under Agrotech in India is estimated at around Rs 487 crore. Fishing<br />
nets constitute over 90% <strong>of</strong> the Agrotech <strong>technical</strong> <strong>textiles</strong> usage valued at Rs 442 crore in 2007-08<br />
and are expected to grow at 5 % year on year.<br />
National Horticulture Mission (NHM) has been actively promoting usage <strong>of</strong> Agrotech products in<br />
India through subsidies and annual plans for the states. NHM has included Agrotech products - shade-<br />
nets, mulch mats and greenhouses (greenhouse films are a part <strong>of</strong> greenhouses), anti-hail nets and bird<br />
protection nets under Protective cultivation in the state-<strong>wise</strong> Action plans. In addition, the XIth five<br />
year plan focuses on providing assistance in the hail prone states (like Jammu and Kashmir,<br />
Himachal, Uttar Pradesh and any other state which faces similar problem) for procuring anti-hail nets.<br />
Shade nets account for around 6% <strong>of</strong> the Agrotech segment valued at Rs 28 crore and expected to<br />
grow at around 6% year on year.<br />
Mulch mats are set to achieve a phenomenal growth in the next five years. In the XI th plan, the area<br />
expansion for mulching is envisaged as 1,00,000 hectare (Rs 150 crore in value terms) (Source:<br />
Report <strong>of</strong> the Working Group on Horti culture, Plantation Crops and Organic Farming for the XI<br />
Five Year Plan (2007-12)). The mulch mats market is expected to grow from Rs 12.6 crore in 2007-<br />
08 to Rs 98 crore by 2012-13.<br />
NHM has included anti-hail nets / bird protection nets under Protective cultivation along with<br />
greenhouses, mulching and shade-nets. In the XIth plan, investments for anti-hail nets and bird-<br />
protection nets additional coverage have been targeted as 4,000 hectare. Hence, in value terms, the<br />
market size <strong>of</strong> the Anti-hail nets / bird protection nets market in India is expected to increase from Rs<br />
4 crore in 2007-08 to around Rs 9.75 crore by 2012-13.
Overall, the domestic <strong>consumption</strong> <strong>of</strong> <strong>technical</strong> <strong>textiles</strong> under Agrotech is expected to increase from<br />
around Rs 487 crore in 2007-08 to around Rs 709 crore by 2012-13 growing at a CAGR <strong>of</strong> around<br />
8%.<br />
The total segment imports are Rs 12 crore and account for 2.5 % <strong>of</strong> the total domestic <strong>consumption</strong>.<br />
The exports are worth Rs 67 crore and account for around 12% <strong>of</strong> the total production.<br />
Summary <strong>of</strong> the market-sizing for Agrotech<br />
Shade-nets<br />
Mulch-mats<br />
Crop-covers<br />
Antihail/bird<br />
protection<br />
nets<br />
Fishing nets<br />
TOTAL<br />
Quantity<br />
Production Imports Exports<br />
2007-08 2012-13<br />
<strong>Domestic</strong><br />
Consumption<br />
<strong>Domestic</strong><br />
Consumption<br />
5,000 MT - 2,200 MT 2,800 MT 3,747 MT<br />
Value Rs 45.5<br />
crore<br />
-<br />
Rs 17.5<br />
crore<br />
Rs 28 crore Rs 37.5 crore<br />
Quantity<br />
1,015 MT - 115 MT 900 MT 7,000 MT<br />
Value Rs 14.1<br />
crore<br />
-<br />
Rs 1.5<br />
crore<br />
Quantity<br />
1,000 MT - 1,000 MT<br />
Value<br />
Quantity<br />
Rs 10 crore - Rs 10 crore<br />
Rs 12.6 crore Rs 98 crore<br />
152.5 MT - 17.5 MT 135 MT 325 MT<br />
Value Rs 4.5<br />
crore<br />
-<br />
Rs 0.5<br />
crore<br />
Rs 4 crore Rs 9.75 crore<br />
Quantity<br />
17,000 MT 675 MT 2,332 MT 15,343 MT 19,582 MT<br />
Value Rs 467.5<br />
crore<br />
Quantity<br />
Value Rs 542<br />
crore<br />
Rs 11.6<br />
crore<br />
Rs 37 crore Rs 442.1 crore Rs 564 crore<br />
24,168 MT 675 MT 5,665 MT 19,178 MT 30,654 MT<br />
Rs 12<br />
crore<br />
Rs 67<br />
crore<br />
Rs 487 crore Rs 709 crore<br />
As per ECTT report, the potential market sizing for 2007-08 was as given below:-<br />
Market size<br />
(ECTT report)<br />
Shade-nets<br />
2001-02 2007-08 (P)<br />
Quantity 780 MT 8,250 MT<br />
Value Rs 9 crore Rs 99 crore<br />
Mulch-mats Quantity 63 MT 400 MT<br />
Export<br />
Potential<br />
Rs 31<br />
crore<br />
Rs 2.6<br />
crore<br />
Rs 17.6<br />
crore<br />
Rs 0.9<br />
crore<br />
Rs 49.5<br />
crore<br />
Rs 102<br />
crore
Market size<br />
(ECTT report)<br />
Crop-covers<br />
Anti-hail/bird<br />
protection nets<br />
Fishing nets<br />
TOTAL<br />
2001-02 2007-08 (P)<br />
Value Rs 1 crore Rs 5.7 crore<br />
Quantity 2,000 MT 4,670 MT<br />
Value Rs 25 crore Rs 58 crore<br />
Quantity - -<br />
Value - -<br />
Quantity 13,300 MT 17,800 MT<br />
Value Rs 226 crore Rs 302 crore<br />
Quantity - -<br />
Value Rs 261 crore Rs 465 crore<br />
Capital Employed and Pr<strong>of</strong>itability <strong>of</strong> key players <strong>of</strong> Agrotech<br />
Company Name<br />
Capital Employed<br />
(Rs crore)<br />
Net Pr<strong>of</strong>it Margin<br />
(%)<br />
2006-07 2007-08 2006-07 2007-08<br />
Fiberweb (India) Ltd. 41.6 -10.0 -8.8% -149.7%<br />
Garware Marine Inds. Ltd. 6.2 6.4 3.1% 5.2%<br />
Garware-Wall Ropes Ltd. 184.2 245.2 6.5% 5.9%<br />
Rishi Packers Ltd. 18.4 15.6 1.6% -4.6%<br />
S R F Ltd. 1285.9 1330.9 14.6% 7.7%<br />
Unimin India Ltd. 22.3 23.9 -140.9% -102.4%<br />
Source: Prowess database, IMaCS analysis<br />
Agrotech segment <strong>of</strong> <strong>technical</strong> <strong>textiles</strong> is estimated to provide employment to 65,000 people 2 <strong>of</strong><br />
whom number <strong>of</strong> <strong>technical</strong> 3 employees is estimated at 9,000 and number <strong>of</strong> non-<strong>technical</strong> employees<br />
is estimated at 56,000.<br />
The key impediments to the growth <strong>of</strong> agrotech products are:-<br />
2 Employment has been estimated based on the analysis <strong>of</strong> primary and secondary data available for the<br />
<strong>technical</strong> textile manufacturers. IMaCS has made appropriate adjustments because <strong>of</strong> insufficient data.<br />
3 Technical includes managerial staff and skilled labour whereas non-<strong>technical</strong> includes unskilled labour.
1. Low awareness about the benefits <strong>of</strong> agrotech products leading to lower <strong>of</strong>f-take <strong>of</strong> these<br />
products<br />
2. High initial investment is required for setting up the infrastructure for production<br />
3. Inability to cope with the volatility in raw-material prices as the raw material (HDPE,<br />
LLDPE) costs form a significant percentage <strong>of</strong> total costs<br />
4. NHM provides a subsidy <strong>of</strong> 50% <strong>of</strong> the cost <strong>of</strong> plant protection <strong>technical</strong> <strong>textiles</strong> products like<br />
shade-nets and mulch-mats subject to maximum prices <strong>of</strong> these products as prescribed in the<br />
NHM policy. But, the average market price for these products is much more than the prices<br />
prescribed under NHM.<br />
5. The lead time for the farmer to get the NHM subsidy after completing the necessary<br />
documentation is also a deterrent towards usage <strong>of</strong> agrotech products.<br />
6. Cascading impact <strong>of</strong> taxes negatively influences inter-state sales <strong>of</strong> agrotech products.<br />
The demand for Agrotech products like shade nets, Mulch mats etc depends upon the performance <strong>of</strong><br />
agriculture sector and also on the awareness and acceptance <strong>of</strong> these products by the farming<br />
community. The subsidies extended by the National horticulture mission will continue to play a<br />
crucial role for these products.
Shade nets/Fabrics<br />
Shade nets have widespread applications in floriculture (roses, orchids, etc), horticulture (Cabbage,<br />
pepper, Grapes etc), vanilla cultivation, tea plantations, drying <strong>of</strong> agri-products, cattle-sheds, parking<br />
lots, swimming pools, etc. The shade nets provide protection to the plants from wind, extreme weather<br />
conditions and reduce water evaporation.<br />
India with more than 32 MT <strong>of</strong> fruits and 66 MT <strong>of</strong> vegetables is the second largest producer <strong>of</strong> fruits<br />
and vegetables. India is the second largest producer <strong>of</strong> flowers after China with about 1,15,921<br />
hectares <strong>of</strong> area under floriculture. India has adopted some <strong>of</strong> the newer techniques for agriculture, but<br />
modern techniques involving the use <strong>of</strong> polymers are still lagging behind. In comparison, China's<br />
agricultural sector uses modern techniques and consumes products like shade nets extensively. Hence,<br />
the potential <strong>of</strong> the shade-nets market in India is huge, in comparison with its existing usage.<br />
Product characteristics<br />
Shade nets are generally made <strong>of</strong> Polypropylene or HDPE in knitted or woven form. Shade-nets are<br />
tough, durable, tear resistant and light weight. The standard sizes <strong>of</strong> nets available are 2, 3, 4 & 8<br />
metres in width and 25, 50 and 100 metres in length. The most common dimensions <strong>of</strong> these nets are<br />
3 m (width) by 50 m (length) with GSM <strong>of</strong> 120 to 180. The shade nets are generally Green or Black<br />
in colour. The shade percentage, which indicates the degree <strong>of</strong> shade provided by the shade-nets,<br />
varies from 25 percent to 90 percent. The shade percentage depends upon the application / plants<br />
under cultivation.<br />
Type <strong>of</strong> Crop<br />
Recommended<br />
shading by<br />
manufacturers<br />
Roses, Strawberries, Gooseberries, Tomatoes,<br />
Cucumber and fruit bearing plant<br />
25%<br />
general Pot and foliage plants and Cut greens,<br />
Orchids, Anthuriums, Ginger,<br />
50%<br />
Indoor plants, certain Orchids, plantation<br />
crops, Tea, C<strong>of</strong>fee, Cardamom<br />
75%<br />
Cattle sheds, Poultry houses, and vehicular<br />
shades<br />
95%<br />
Source: <strong>Industry</strong> survey<br />
Key application areas <strong>of</strong> shade-nets
The key application areas <strong>of</strong> shade nets are:<br />
• Agricultural applications - grape cultivation, orchid plantations, tea plantations, nurseries<br />
• Non-agricultural applications – swimming pool coverage, parking lots, etc<br />
The demand for shade nets largely depends upon the usage in floriculture and horticulture. The<br />
increasing awareness <strong>of</strong> the benefits <strong>of</strong> using shade nets and assistance from schemes <strong>of</strong> National<br />
Horticulture Mission (NHM) are making a significant impact on the demand.<br />
The demand for shade nets for grapes cultivation is slowing down as farmers are increasingly using<br />
paper instead <strong>of</strong> shade nets. The papers help to protect the plants from cold climate apart from<br />
providing the functionality <strong>of</strong> shading. How ever, the inspection <strong>of</strong> plants for any disease becomes<br />
difficult in case <strong>of</strong> paper usage.<br />
The tea garden nurseries hold a lot <strong>of</strong> potential for shade-nets. The shade nets usage in the tea gardens<br />
nurseries is derived from the number <strong>of</strong> tea gardens going for replantation. Since the re-plantation <strong>of</strong><br />
tea gardens is fairly minimal in India, shade nets usage is not significant in tea gardens.<br />
The demand for shade nets is also increasing in non-agricultural applications like parking lots, garden<br />
fences, etc.<br />
Market dynamics and key growth drivers: Horticulture <strong>Industry</strong> in India<br />
Production base <strong>of</strong> horticultural crops has been expanding since independence. From eighth plan<br />
onwards, this sector has witnessed tremendous growth in area, production and productivity. The area<br />
has increased from 13.43 million hectare in 1991-92 to 21.74 million hectare in 2004-05 (which is<br />
about 13% <strong>of</strong> the total cultivated area) while production increased from 97.83 million MT (1991-92)<br />
to 171.86 million MT during 2004-05.<br />
The states/ UTs namely Chattishgarh, Gujarat, Haryana, Jharkhand, Madhya Pradesh, Nagaland,<br />
Punjab, Uttar Pradesh, Dadar & Nagar Haveli have less than 10 per cent coverage <strong>of</strong> area under<br />
horticultural crops and thus require priority attention to horticulture development in the XI Plan. The<br />
states namely Andhra Pradesh, Assam, Bihar, Karnataka, Maharashtra, Orissa, Rajasthan, Tamil Nadu<br />
and Uttarankhand cover about 10-25 per cent area under horticultural crops. There is still tremendous<br />
scope for exploitation <strong>of</strong> horticulture production in these states. Other states cover more than 25 %<br />
area in horticultural crops.<br />
In 2005-06, there were about 6,300 nurseries under public and private sectors. In addition, over 1,300<br />
nurseries were developed during 2006-07 under Central Govt. Sponsored Schemes like NHM and<br />
TMNE. At present, there are over 7,500 registered small and medium scale nurseries. Large nurseries
are about 100 in the country. Under NHM, about 2,830 new nurseries are to be established by the end<br />
XI Plan.<br />
The crop <strong>wise</strong> requirement <strong>of</strong> planting material in various horticultural crops has been estimated in the<br />
XI plan by a modest expansion <strong>of</strong> 4% per annum. Thus the total requirement <strong>of</strong> planting material <strong>of</strong><br />
fruits, coconut, cashew, black pepper, tree spices, areca-nut, etc. which was around 1400 millions by<br />
2002 which can be projected as 2,000 million by 2012.<br />
In fruit crops projected demand <strong>of</strong> planting material during 2007-08 is estimated as 7,145,841, which<br />
will increase to 83,59,632 during 2011-12 (4% increase y-o-y). In vegetable seeds, the annual seed<br />
requirement is expected to be more than 185 MT <strong>of</strong> breeders’ seed. The area under floriculture would<br />
increase by 5,000 hectare during the XI plan period the demand for planting material during the<br />
period would be around 19,681 lakhs, which would require approximately 2,232 ha <strong>of</strong> nursery area.<br />
The demand for shade nets is geographically dispersed and it is quite a challenge to serve this market.<br />
The states <strong>of</strong> Maharashtra, Tamil Nadu, Andhra Pradesh, Himachal Pradesh and Karnataka are the<br />
major consumers <strong>of</strong> shade-nets in India. Typically, the shade net manufacturers sell a significant<br />
percentage <strong>of</strong> products to dealers who in turn sell them to the cultivators.<br />
Norms <strong>of</strong> Assistance for programmes under NHM<br />
Grant from the Govt. <strong>of</strong> up to 50% <strong>of</strong> the cost <strong>of</strong> shade-nets @ Rs. 14 / sq. m. limited to 2 hectare per<br />
beneficiary. The market price <strong>of</strong> shade-nets is around Rs 22 per sq. m.<br />
Consumption <strong>of</strong> shade-nets as per NHM<br />
NHM has included shade-nets under Protective cultivation along with greenhouses and mulching.<br />
Protective cultivation Action plans (including shade-nets, mulching and greenhouses) for different<br />
states approved for 2006-07 (as per NHM) is given in Annexure 1. The area covered under the NHL<br />
state action plans for Protective cultivation increased from 3,055 hectare in 2005-06 to 8,235 hectare<br />
in 2006-07 (excluding North-eastern and Himalayan states). The shade net targets (2007-08) under<br />
NHM for some <strong>of</strong> the key horticulture states is given in Annexure 2. The total shade nets target<br />
coverage is around 1,600 hectares.<br />
Other applications <strong>of</strong> shade-nets account for around 20% <strong>of</strong> the <strong>consumption</strong> (based on discussion<br />
with manufacturers).<br />
Market size <strong>of</strong> shade-nets and future forecast<br />
The market size <strong>of</strong> shade-nets has been estimated as given below:-
Shade-nets usage in India<br />
Existing penetration Over 5,000 hectares<br />
Total potential area 1 lakh hectares<br />
Life <strong>of</strong> shade-nets 4 years<br />
Annual shade nets usage targeted as per 1,600 hectares<br />
NHM state action plans (adjusted)<br />
Average price Rs 10 to 22 per square metre (for GSM<br />
100 to 200)<br />
(or Rs 100 per kg)<br />
Average GSM <strong>of</strong> shade-nets usage 140 GSM (50 – 200 GSM, generally<br />
between 120 GSM to 180 GSM)<br />
Share <strong>of</strong> applications other than 20% <strong>of</strong> total usage<br />
agriculture in shade-nets usage<br />
Total shade-nets <strong>consumption</strong> Rs 28 crore approx<br />
Around 2,000 hectare or 2,800 MT<br />
Source: <strong>Industry</strong> survey, NCPAH, NHM state action-plans, Report <strong>of</strong> the Working Group on Horticulture,<br />
Plantation Crops and Organic Farming for the XI Five Year Plan (2007-12), IMaCS Analysis<br />
In addition to the 7500 nurseries in India, about 2,830 new nurseries are expected to be established by<br />
the end XI Plan under NHM (increase <strong>of</strong> around 6.5% y-o-y over the next 5 years).<br />
As per Report <strong>of</strong> the Working Group on Horticulture, Plantation Crops and Organic Farming for the<br />
XI Five Year Plan (2007-12), the crop <strong>wise</strong> requirement <strong>of</strong> planting material in various horticultural<br />
crops has been estimated by a modest expansion <strong>of</strong> 4% per annum. Thus the total requirement <strong>of</strong><br />
planting material <strong>of</strong> fruits, coconut, cashew, black pepper, tree spices, areca-nut, etc is projected as<br />
2,000 million by 2012 (around 1400 millions by 2002).<br />
In fruit crops projected demand <strong>of</strong> planting material during 2007-08 is estimated as 7,145,841, which<br />
will increase to 8,359,632 during 2011-12 (4% increase y-o-y). In vegetable seeds, the annual seed<br />
requirement is expected to be more than 185 MT <strong>of</strong> breeders’ seed. The area under floriculture would<br />
increase by 5,000 ha during the XI plan period the demand for planting material during the period<br />
would be around 19,681 lakhs, which would require approximately 2,232 hectare <strong>of</strong> nursery area i.e.<br />
around 400-500 hectare <strong>of</strong> additional shade-nets for floriculture nurseries per annum.<br />
Though in the XI th plan, the area expansion for shade-nets is envisaged as 200 hectare (Rs 100 crore<br />
in value terms) only, the state governments are expected to focus on increasing the usage <strong>of</strong> shade-<br />
nets in their states. Since the average life <strong>of</strong> shade-nets is 4 years and the existing penetration <strong>of</strong><br />
shade-nets is over 5,000 hectare, the replacement demand <strong>of</strong> shade-nets in 2012-13 is expected to be<br />
over 1,250 hectares. In addition, the incremental demand <strong>of</strong> shade-nets would be around 700-800<br />
hectares per annum. Hence, we have assumed yearly growth rate <strong>of</strong> 6% for the shade-nets usage based<br />
on incremental requirement <strong>of</strong> nurseries.<br />
The current and future forecast <strong>of</strong> shade-nets <strong>consumption</strong> is given below:-
Shade nets domestic usage 2007-08 2012-13<br />
Quantity<br />
2,000 hectare<br />
or 2,800 MT<br />
2,676 hectare<br />
or 3,747 MT<br />
Value Rs 28 crore<br />
Rs 37.47<br />
crore<br />
Source: <strong>Industry</strong> survey, IMaCS Analysis<br />
The Indian shade-nets market size is expected to increase from 2,000 hectare (or 2,800 MT) in 2007-<br />
08 to around 2,676 hectare (or 3,747 MT) by 2012-13. No inflationary increase has been assumed for<br />
the price <strong>of</strong> shade-nets fabric. Hence, in value terms, the market size <strong>of</strong> the shade-nets market in India<br />
is expected to increase from Rs 28 crore in 2007-08 to around Rs 37.47 crore by 2012-13.<br />
Key manufacturers<br />
Rishi Packers Ltd, Tuflex (Netlon India Ltd) and Neo Corp International Ltd. are some <strong>of</strong> the largest<br />
manufacturers and exporters <strong>of</strong> shade nets in India. Most <strong>of</strong> the shade-nets manufacturing units in<br />
India are small-scale units, concentrated in the states <strong>of</strong> Maharashtra and Gujarat. Some <strong>of</strong> the other<br />
manufacturers <strong>of</strong> shade fabrics are Malmo Exim Ltd (Mumbai), Kwality Nets (Mumbai), B & V Agro<br />
(Mumbai) and Sunpak (Tamil Nadu).<br />
Manufacturer Year Production Installed<br />
quantity<br />
capacity<br />
Rishi packers* 2006-07<br />
715 MT or 590<br />
hectare<br />
1500 MT<br />
Neo Corp International Ltd 2007-08 912 MT^<br />
Tuflex (or Netlon) 2007-08 700 MT<br />
Kwality Nets 2005-06 65 MT<br />
Agro Shade Industries 2004-05 30 MT<br />
Agrotech 2005-06 130 hectare<br />
Amrish Engineering 2004-05 60 MT<br />
B & V Agro Irrigation Co. 2004-05 350 MT*<br />
Colour Concentrate 2004-05 120 MT<br />
Dhanya Polymers 2004-05 60 MT<br />
Golden Agronet 2004-05 60 MT<br />
Malmo Exim Ltd. 2005-06 132 MT<br />
Shree Siddhivinayak Polyfab 2004-05 100 MT<br />
Sunpack 2004-05 250 MT<br />
Supak Pvt. Ltd. 2004-05 250 MT<br />
* 20 lakh pieces in 2005-06<br />
^ This is inclusive <strong>of</strong> the capacity for mosquito nets and scaffolding nets<br />
Source: Capitaline, Annual reports, <strong>Industry</strong> survey, www.plastemart.com<br />
Neo Corp International Ltd. currently exports 75% <strong>of</strong> the shade nets produced. The company is<br />
further augmenting its capacity by 480 MT per anum by November, 2009 thus increasing the total<br />
installed capacity to 1392 MT per annum.
Imports and Exports <strong>of</strong> Shade-nets<br />
The estimated export figures for shade-nets are as given below:-<br />
HS Code Description<br />
39269099, 39269029,<br />
39269080, 39249090<br />
39269080, 39232990,<br />
39261019, 39269099<br />
60059000<br />
HDPE SHADE NETS<br />
PP WOVEN FABRICS WITH<br />
UV STABILIZER/MASTER<br />
BATCH<br />
AGRO SHADE NETS – HDPE<br />
WARP KNITTED SHADE<br />
NETS<br />
Exports Exports<br />
(in MT) (in Rs crore)<br />
2007-08(E) 2007-08(E)<br />
Around 200<br />
MT*<br />
~ Rs 2.5 crore<br />
Around 2000<br />
MT<br />
Around 10 – 15<br />
MT #<br />
~ Rs 15 crore<br />
~ Rs 0.1 crore<br />
Source: IBIS, IMaCS Analysis<br />
* Shade nets exports under HS code 39X is estimated as around 150 hectare and converted to MT using GSM<br />
140<br />
# Shade nets exports under HS code 60X is estimated as around 7 - 10 hectare and converted to MT using GSM<br />
140<br />
UAE accounts for over 75-80% <strong>of</strong> exports <strong>of</strong> HDPE shade-nets <strong>of</strong> India with HS code 39X followed<br />
by Ireland with around 20% share. In addition, India also exports shade-nets to countries like<br />
Maldives, Sri Lanka, Sudan, Trinidad etc.<br />
Italy, Belgium and Poland account for over 80-85% <strong>of</strong> exports <strong>of</strong> PP woven fabrics with UV master-<br />
batch with HS code 39X. The remaining exports are accounted by USA and Bulgaria.<br />
The exports <strong>of</strong> shade-nets in the year 2012-13 are expected to Rs 30.8 crore.<br />
The imports <strong>of</strong> shade nets are almost negligible and the domestic demand is completely satisfied by<br />
domestic production.<br />
Raw-materials<br />
The standard sizes <strong>of</strong> shade-nets available are in widths <strong>of</strong> 2, 3, 4 &8 metres and in length <strong>of</strong> 50 and<br />
100 metres. The most common dimensions <strong>of</strong> these nets are 3 m (width) by 50 m (length). The shade<br />
nets are generally Green or Black in colour with varying shade percentage from 25 percent to 90<br />
percent.<br />
Shade nets are generally made <strong>of</strong> Polypropylene or HDPE in knitted or woven form. The basic raw<br />
material is the HDPE/PP granules (Reliance Industries Ltd. is the major supplier). The HDPE<br />
granules are used in most <strong>of</strong> the cases as it is cheaper than Polypropylene. Additives are added to<br />
these shade nets for UV stabilization. The additives allow nets to resist the atmospheric agents,
particularly the harmful UV rays, thereby, increasing the life <strong>of</strong> the nets and provide protection to the<br />
plants.<br />
Key machinery manufacturers/suppliers in India<br />
Existing HDPE Woven sack processors can manufacture HDPE Agri-shade nets on the same tape<br />
extruder with an additional investment in knitting machines. Thus increasing the product mix leading<br />
to higher capacity utilization <strong>of</strong> the machinery would bring in a higher net pr<strong>of</strong>itability.<br />
The raschel knitting machines used for manufacturing shade-nets are mostly imported. GCL India Pvt<br />
ltd (Bangalore) is one <strong>of</strong> the local manufacturers <strong>of</strong> raschel knitting machines. The key raschel<br />
knitting machinery manufacturers in the world are Karl Mayer (Germany), LIBA Maschinenfabrik<br />
GmbH (Germany) and Brückner Technology Holding GmbH (Germany).<br />
Knitting loom machines are widely used for the knitting process. SASMIRA has developed a method<br />
by which the leno weaving machines can be used instead <strong>of</strong> Raschel knitting machines. Malmo Exim<br />
and few other SSI units are using these machines.<br />
The Indian associates / suppliers for these machinery manufacturers are:<br />
• ATE engineering (Bombay) for Karl mayer<br />
• Brückner Machinery and Service India Pvt Ltd (Pune) for Bruckner.<br />
The machinery costs around Rs 2-2.5 crore and has a capacity <strong>of</strong> 60-150 linear metre / hour. The cost<br />
<strong>of</strong> the machine depends on whether the raw material is in mon<strong>of</strong>ilament form or in tape form. The<br />
machinery cost is inclusive <strong>of</strong> warping machine which is used along with the knitting machine.<br />
Quality Control and Standards - No BIS code is available for shade nets.<br />
Mulch Mats or Ground covers<br />
Mulching is defined as covering <strong>of</strong> soil around the plants to conserve soil moisture, reducing nutrient<br />
loss by leaching and weeds control where chemical fertilizers and weedicides are used and to modify<br />
soil temperature. Mulching also reduces run-<strong>of</strong>f, increase penetration <strong>of</strong> rainwater, controls erosion,<br />
corrects the chemical balance <strong>of</strong> the soil and reduces damage done by pests and diseases. Apart from<br />
these major results mulching produces secondary effects such as improvement <strong>of</strong> soil structure,<br />
increase in micro-activity, earthworm populations and root systems that are more extensive. Black<br />
film prevents the germination and growth <strong>of</strong> weed seeds in contrast to clear film. It absorbs more sun<br />
energy and retains higher heat underneath the film.<br />
In India, straw, hay, sawdust, asphalt paper, etc is traditionally used for mulching. Use <strong>of</strong> <strong>technical</strong><br />
<strong>textiles</strong> for mulching is yet to grain momentum.
At present, mulch mats are being used mainly in vegetable (which are short duration crops) and few<br />
fruit crops. Mulch mats keep ripening fruits, <strong>of</strong>f the soil. The reduced contact with the soil decreases<br />
fruit rot as well as keeps the fruit and vegetables clean. This is beneficial for the production <strong>of</strong> several<br />
fruits including strawberries. Before plantations <strong>of</strong> the seedlings, the beds <strong>of</strong> the field are covered with<br />
the mulch film (generally a black opaque film) and the holes are made at the desired spots where in<br />
the seeds are planted. The use <strong>of</strong> mulch mats along with the use <strong>of</strong> drip irrigation can lead to<br />
significant increase in productivity. But, the non-biodegradable mulches must be removed from the<br />
field and disposed <strong>of</strong>f properly.<br />
Product characteristics and Raw-materials<br />
Mulch mats are made <strong>of</strong> both natural (wool and jute) and man made fibres (LLDPE, HDPE). Mulch<br />
mats can be classified as:-<br />
• Woven<br />
• Non-woven<br />
• Mulch-films<br />
Wool fibre is used for designing Non-woven Mulch mat, LLDPE polymer is used for Mulch films<br />
(Extruded sheets in various thicknesses, microns) and fibres like jute and cotton are used for Woven<br />
mulch mats.<br />
Mulch mats made <strong>of</strong> biodegradable material are incorporated into the soil as fertiliser for the next<br />
crop. Wool mulch mats allow water to enter in to the soil (unlike black sheet) and act as a barrier to<br />
prevent excessive soil desiccation during dry period. It also provides better insulation and prevents<br />
damage from ground frost. On the other hand, HDPE/LLDPE mulch films are cheaper and last for one<br />
to four years.<br />
Mulch films made <strong>of</strong> LLDPE are most commonly used for mulching in India. Reliance industries Ltd<br />
is the major supplier <strong>of</strong> LLDPE. The films <strong>of</strong> various thicknesses are manufactured by the process <strong>of</strong><br />
extrusion. The thickness <strong>of</strong> the films is based on the crop requirement and the time-period for which<br />
the mulch films are intended to be used. For instance, some manufacturers recommend 7 microns film<br />
for crops like groundnut. Mulch films <strong>of</strong> thickness 100 microns are used for mango trees, which are<br />
used over many years. The most common thicknesses <strong>of</strong> films are 25, 50 and 100 microns. The<br />
coverage <strong>of</strong> mulch films is dependent on the thickness. UV master-batch is added to ensure UV<br />
stabilisation.
Thickness Coverage<br />
(Micron) (sq. m. per kg) Type <strong>of</strong> crops<br />
7<br />
25<br />
140<br />
40<br />
Short duration crops (3 to 4 months)<br />
50 20 Medium duration crops (11-12 months)<br />
100 10 Long duration crops (more than 12 months)<br />
Source: <strong>Industry</strong> survey, NCPAH<br />
The mulch films are available in the market in the form <strong>of</strong> rolls. The most commonly available films<br />
have a width <strong>of</strong> 1-1.15 metres. The films are generally black in colour as black colour absorbs the<br />
maximum heat and hence leads to higher soil temperature.<br />
Market dynamics and key growth drivers<br />
Mulch-mats are largely used in floriculture, horticulture and fruit crops. The major <strong>consumption</strong> <strong>of</strong><br />
mulch films is in the cultivation <strong>of</strong> strawberries, watermelon, groundnuts, vegetables, etc. The<br />
demand <strong>of</strong> mulch films is seasonal in nature as the mulch films are used at the beginning <strong>of</strong> the<br />
agricultural season.<br />
The increasing awareness <strong>of</strong> the benefits <strong>of</strong> using mulch-mats and assistance from schemes <strong>of</strong><br />
National Horticulture Mission (subsidy <strong>of</strong> 50% <strong>of</strong> the total cost subject to a maximum <strong>of</strong> Rs.<br />
7000/hectare limited to 2 hectare per beneficiary) will have a significant impact on the demand.<br />
The capacity for mulch films is interchangeably used with nursery bags, green house films, etc. Mulch<br />
films are made on order. The manufacturers prefer to sell the products through distributors / dealers to<br />
reach the end customers in far <strong>of</strong>f places.<br />
Norms <strong>of</strong> Assistance for programmes under NHM<br />
Grant from the Govt. <strong>of</strong> up to 50% <strong>of</strong> the cost <strong>of</strong> mulching @ Rs. 14,000 / hectare limited to 2 hectare<br />
per beneficiary. The market price <strong>of</strong> mulch mats is around Rs 21,000 per hectare.<br />
Consumption <strong>of</strong> mulch-mats as per NHM<br />
NHM has included mulching under Protective cultivation along with greenhouses and shade-nets.<br />
Protective cultivation Action plans (including shade-nets, mulching and greenhouses) for different<br />
states approved for 2006-07 (as per NHM) is given in Annexure 1. The area covered under the NHL<br />
state action plans for Protective cultivation increased from 3,055 hectare in 2005-06 to 8,235 hectare<br />
in 2006-07. Mulch-mats account for around 75% <strong>of</strong> the area coverage under protective cultivation.<br />
Around 1,512 hectare <strong>of</strong> area was added for mulching in the north-eastern and Himalayan states alone
during the Xth plan. The mulching targets (2007-08) under NHM for some <strong>of</strong> the key horticulture<br />
states is given in Annexure 3. The total mulching target coverage under NHM is around 9,600<br />
hectares. We have assumed around 60-65% target achievement for mulching.<br />
Market size <strong>of</strong> mulch-mats and future forecast<br />
The market size <strong>of</strong> mulch-mats has been estimated as given below:-<br />
Mulch-mats usage in India<br />
Existing penetration Over 10,000 hectares<br />
Total potential area 10 lakh hectares<br />
Life <strong>of</strong> mulch-mats 0.5 to 4 years (Average life <strong>of</strong> 2 years at<br />
present)<br />
Annual mulch-mats usage targeted as 6,000 hectares<br />
per NHM state action plans (adjusted)<br />
Average price Rs 140 per kg (or Rs 21,000 per hectare)<br />
Average GSM <strong>of</strong> mulch-mats usage 15 GSM (7 – 100 GSM, generally<br />
between 7 GSM to 25 GSM in India)<br />
Total mulch-mats <strong>consumption</strong> Rs 12.6 crore approx<br />
Around 6,000 hectare or 900 MT<br />
Source: <strong>Industry</strong> survey, NCPAH, NHM state action-plans, Report <strong>of</strong> the Working Group on Horticulture,<br />
Plantation Crops and Organic Farming for the XI Five Year Plan (2007-12), IMaCS Analysis<br />
At present, mulch mats are being used mainly in vegetable (which are short duration crops) and few<br />
fruit crops, therefore, the average life <strong>of</strong> mulch-mats is around 2 years. The existing penetration <strong>of</strong><br />
mulch-mats is over 10,000 hectare.<br />
In the XI th plan, the area expansion for mulching is envisaged as 1,00,000 hectare (Rs 150 crore in<br />
value terms) (Source: Report <strong>of</strong> the Working Group on Horticulture, Plantation Crops and Organic<br />
Farming for the XI Five Year Plan (2007-12)). Assuming that the area addition will happen largely<br />
for crops with higher average life (and higher GSM) and the average life would increase to around 3<br />
years, the replacement demand <strong>of</strong> mulch-mats in 2012-13 is expected to be around 50,000 hectares.<br />
We have assumed 50% achievement <strong>of</strong> the target for additional mulching area as per XIth plan. In this<br />
scenario, the replacement demand in 2012-13 will be around 25,000 hectrares. The incremental<br />
demand will be 10,000 hectare (at 50% achievement level <strong>of</strong> the XIth plan target). Hence, the total<br />
demand <strong>of</strong> mulch-mats is estimated at around 35,000 hectares per annum. In addition, the average life<br />
<strong>of</strong> mulch-mats is assumed as 3 years and average GSM as 20, for 2012-13.<br />
The current and future forecast <strong>of</strong> mulch-mats <strong>consumption</strong> is given below:-<br />
Mulch-mats domestic usage 2007-08 2012-13
Quantity<br />
6,000 hectare<br />
or 900 MT<br />
35,000<br />
hectare or<br />
7,000 MT<br />
Value Rs 12.6 crore Rs 98 crore<br />
Source: <strong>Industry</strong> survey, IMaCS Analysis<br />
The Indian mulch-mats market size is expected to increase from 6,000 hectare (or 900 MT) in 2007-<br />
08 to around 35,000 hectare (or 7,000 MT) by 2012-13. No inflationary increase has been assumed for<br />
the price <strong>of</strong> mulch-mats. Hence, in value terms, the market size <strong>of</strong> the mulch-mats market in India is<br />
expected to increase from Rs 12.6 crore in 2007-08 to around Rs 98 crore by 2012-13.<br />
Key manufacturers <strong>of</strong> the product with information on capacity / production / sales<br />
Some <strong>of</strong> the major manufacturers <strong>of</strong> mulch mats are Unimin, Fiberweb India, Shivam Polymers,<br />
Climax Synthetics Pvt. Ltd, Creative polymers Pvt. Ltd and Essen Multipack Ltd. Many <strong>of</strong> these<br />
players are located in Gujarat. Most <strong>of</strong> the manufacturers <strong>of</strong> mulch mats are small-scale industries.<br />
Imports & Exports <strong>of</strong> mulch-mats<br />
The quantum <strong>of</strong> imports for mulch mats is not significant as per discussions with the industry players.<br />
The estimated export figures for ground covers (used for weed control) are as given below:-<br />
HS Code Description<br />
39269099<br />
GROUND COVERS (GSM<br />
70-90)<br />
Exports Exports<br />
(in MT) (in Rs crore)<br />
2007-08(E) 2007-08(E)<br />
Around 115 Approx. Rs 1.5<br />
MT<br />
crore<br />
Source: IBIS, IMaCS Analysis<br />
Ground covers are exported from India to Netherlands and UK as well as to Sri Lanka in small<br />
amounts. In the year 2012-13 the exports are expected to reach Rs 2.6 corre gorwing at a CAGR <strong>of</strong><br />
12%.<br />
Unimin, Fiberweb India and KT Exports (I) Pvt. Ltd are the key exporters <strong>of</strong> soil/ground covers<br />
(mulching) for weed control and moisture retention.<br />
Key machinery manufacturers/suppliers in India<br />
Monolayer Blown Film Lines as well as Multilayer Blown Film Lines are used for the manufacture <strong>of</strong><br />
mulch films. Monolayer lines give higher specific output per screw RPM. They have grooved feed<br />
technology for forward movement <strong>of</strong> the raw material and candle type screen changer to ensure<br />
wastage control and long production runs.
The machinery required is available locally and there are number <strong>of</strong> manufacturers for the same. The<br />
major Indian manufacturer <strong>of</strong> these lines is Kabra Extrusion Technik Ltd (KET). A Plastic Mulch<br />
Laying Machine was also developed at CIAE, Bhopal.<br />
Some <strong>of</strong> the manufactures have indicated the usage <strong>of</strong> Leaflet tubing machinery which does the<br />
melting and extrusion <strong>of</strong> films in various desired shapes.<br />
Quality Control and standards in India<br />
Mulch Films (HDPE & LDPE) are covered under IS 10889:2004 and IS 2508:1984.
Anti Hail Nets and Bird protection nets<br />
Anti-hail nets are used to protect the crops like apple, litchi, etc from hails in hail prone areas and<br />
high altitude areas like Himachal Pradesh, Jammu & Kashmir, Uttar Pradesh, North-eastern states,<br />
etc. The anti hail nets are normally provided for each individual tree.<br />
Huge losses are caused by birds in most <strong>of</strong> the crops. The crops like grapes, guava, pomegranate are<br />
severely infested by parrots. Sometimes the parrots can destroy the entire crop within hours. To<br />
avoid such huge losses, bird protection nets are used.<br />
Product characteristics – Bird protection nets<br />
Bird protection net is a mesh product designed to exclude the birds and stop the expensive losses they<br />
can inflict on the crop. With an optimal holes size, it is large enough to allow movement <strong>of</strong> bees and<br />
keeps shade to a minimum. It does not prevent light from reaching the plants below and so flourish.<br />
Bird netting allows free movement <strong>of</strong> air means that dangerous fungus does not develop on the fruit.<br />
These nets are manufactured from Polypropylene or HDPE Mon<strong>of</strong>ilament yarn (UV stabilised) and<br />
knitted into a durable mesh fabric. Bird protection nets are typically around 25 to 40 GSM ultra-light<br />
fabrics. These nets are tough, durable, tear resistant and light weight. The standard sizes <strong>of</strong> nets<br />
available are 1, 2, 3 & 6 metres in width and 10, 20, 50 and 100 metres in length. These nets are<br />
generally Green, Blue or White in colour. The shade percentage, which indicates the degree <strong>of</strong> shade<br />
provided by the nets, is around 20%.<br />
• Bird protection nets are placed over trees and fields to protect the fruit from being eaten by<br />
birds.<br />
• These net are strong yet lightweight and protect the fruit without restricting plant growth.<br />
• The nets are usually worked with two stitch-forming guide bars, and have a basic construction<br />
in which the openings are produced.<br />
• The size <strong>of</strong> the diamond-shaped openings can be increased or decreased by varying the repeat<br />
length <strong>of</strong> the connecting sections.<br />
• The use <strong>of</strong> polyethylene tape yarns or mon<strong>of</strong>ilament yarns makes the net extremely durable<br />
and hard-wearing.<br />
Product characteristics – Anti-hail nets<br />
Anti-hail nets are used to prevent hail damage in a broad variety <strong>of</strong> crops. These are woven from<br />
HDPE yarn or are combination <strong>of</strong> HDPE mon<strong>of</strong>ilament and tape in knitted form, stabilised against<br />
UV rays. These nets are transparent in color with hole size <strong>of</strong> 2*100 mm to allow the crops to receive
a low level <strong>of</strong> shade (13% to 30%). The GSM <strong>of</strong> these nets varies from 60 to 100. These nets are<br />
flexible, light, strong and easy to spread, and can be placed on simple support structures.<br />
Norms <strong>of</strong> Assistance for programmes under NHM<br />
The XIth plan provides assistance in the hail prone states (like Jammu and Kashmir, Himachal, Uttar<br />
Pradesh and any other state which faces similar problem) for procuring anti-hail nets. Grant from the<br />
Govt. <strong>of</strong> 50% <strong>of</strong> the cost <strong>of</strong> anti-hail nets up to Rs. 500 / tree subject to a maximum <strong>of</strong> 50 trees per<br />
beneficiary is provided. Grant from the Govt. <strong>of</strong> 50% <strong>of</strong> the cost <strong>of</strong> bird-protection nets @ Rs. 2,000 /<br />
hectare subject to a maximum <strong>of</strong> 1 hectare per beneficiary is provided.<br />
Consumption <strong>of</strong> anti-hail / bird protection nets as per NHM<br />
The usage for anti-hail nets has been inconsistent across states over the last 5 years. In 2002-03,<br />
10,750 trees were covered under anti-hail nets in the North-Eastern states, Uttaranchal & Himachal<br />
Pradesh. The usage dropped in 2003-04 and 2004-05 as the usage in Sikkim and Manipur reduced. In<br />
2005-06, 12,030 trees were covered under anti-hail nets in Uttaranchal, Sikkim & Himachal Pradesh.<br />
In Meghalaya, 4,994 trees were covered under anti-hail nets in 2006-07. In 2007-08, over 20,875 trees<br />
were targeted under anti-hail nets and 109 hectare under bird-protection nets in Himachal Pradesh and<br />
Uttaranchal. In 2008-09, over 26,751 trees are targeted under anti-hail nets and 131 hectare under<br />
bird-protection nets in Himachal Pradesh and Uttaranchal. Hence, the anti-hail nets usage has grown<br />
at a CAGR <strong>of</strong> around 15%.<br />
NHM has included anti-hail nets / bird protection nets under Protective cultivation along with<br />
greenhouses, mulching and shade-nets. In the XIth plan, investments for anti-hail nets and bird-<br />
protection nets additional coverage have been targeted as 4,000 hectare.<br />
Market size <strong>of</strong> anti-hail nets / bird protection nets and future forecast<br />
The market size <strong>of</strong> Anti-hail nets has been estimated as given below:-<br />
Anti-hail nets usage in India<br />
Existing penetration Over 50,000 trees<br />
Life <strong>of</strong> Anti-hail nets 7 to 8 years<br />
Annual Anti-hail nets usage targeted as 20,000 trees (at around 200 trees per<br />
per state action plans (adjusted) hectare)<br />
Average price Rs 32 per sqm<br />
Average GSM <strong>of</strong> Anti-hail nets Around 100 GSM<br />
Total Anti-hail nets Rs 3 crore approx<br />
Around 100 MT<br />
Source: <strong>Industry</strong> survey, NCPAH, National Technology Mission for North Eastern states, Report <strong>of</strong> the Working<br />
Group on Horticulture, Plantation Crops and Organic Farming for the XI Five Year Plan (2007-12), IMaCS<br />
Analysis
Bird-protection nets usage in India<br />
Annual Bird protection nets usage Around 100 hectare<br />
targeted as per state action plans<br />
(adjusted)<br />
Average price Rs 11 per sqm<br />
Average GSM <strong>of</strong> Bird protection nets Around 25 to 40 GSM<br />
Total Bird protection nets Rs 1 crore approx<br />
Around 30-35 MT<br />
Source: <strong>Industry</strong> survey, NCPAH, National Technology Mission for North Eastern states, Report <strong>of</strong> the Working<br />
Group on Horticulture, Plantation Crops and Organic Farming for the XI Five Year Plan (2007-12), IMaCS<br />
Analysis<br />
The existing penetration <strong>of</strong> Anti-hail nets is around 50,000 trees while that <strong>of</strong> bird-protection nets is<br />
negligible.<br />
In the XI th plan, the area expansion for anti-hail nets is envisaged as 4,000 hectare (Source: Report <strong>of</strong><br />
the Working Group on Horticulture, Plantation Crops and Organic Farming for the XI Five Year<br />
Plan (2007-12)). Hence, the demand <strong>of</strong> Anti-hail nets / bird protection nets in 2012-13 is expected to<br />
be over 1,000 hectares. In terms <strong>of</strong> anti-hail nets for trees, the trees coverage per annum under anti-<br />
hail nets is expected to increase to over 45,000 trees per annum (increasing at a CAGR <strong>of</strong> 15%) i.e.<br />
anti-hail nets usage <strong>of</strong> 225 MT. Assuming 50% target achievement (<strong>of</strong> 1,000 hectare), the bird-<br />
protection nets usage is projected to be around 300 hectare in 2012-13 (or approx. 100 MT).<br />
The current and future forecast <strong>of</strong> Anti-hail nets / bird protection nets <strong>consumption</strong> is given below:-<br />
Anti-hail nets / bird protection<br />
nets domestic usage<br />
2007-08 2012-13<br />
Quantity 135 MT 325 MT<br />
Value Rs 4 crore Rs 9.75 crore<br />
Source: <strong>Industry</strong> survey, IMaCS Analysis<br />
The Indian Anti-hail nets / bird protection nets market size is expected to increase from 135 MT in<br />
2007-08 to around 325 MT by 2012-13. No inflationary increase has been assumed for the price <strong>of</strong><br />
Anti-hail nets / bird protection nets. Hence, in value terms, the market size <strong>of</strong> the Anti-hail nets / bird<br />
protection nets market in India is expected to increase from Rs 4 crore in 2007-08 to around Rs 9.75<br />
crore by 2012-13.<br />
Key manufacturers <strong>of</strong> anti-hail nets / bird protection nets<br />
Some <strong>of</strong> the major manufacturers <strong>of</strong> Anti-hail nets / bird protection nets are Tuflex, Kwality Nets and<br />
Garware Wall ropes.<br />
Imports & Exports <strong>of</strong> Anti-hail nets / bird protection nets
The quantum <strong>of</strong> imports for Anti-hail nets / bird protection nets is not significant as per discussions<br />
with the industry players.<br />
The estimated export figures for Anti-hail nets / bird protection nets are as given below:-<br />
HS Code Description<br />
56075090 Bird protection nets<br />
Exports Exports<br />
(in MT) (in Rs crore)<br />
2007-08(E) 2007-08(E)<br />
Around 15-20 Approx. Rs 0.5<br />
MT<br />
crore<br />
Source: IBIS, IMaCS Analysis<br />
Bird-protection nets are being exported from India to New Zealand. In addition, small quantities <strong>of</strong><br />
predator nets are also exported to New Zealand. These exports are expected to grow at a CAGR <strong>of</strong><br />
12% and reach a size <strong>of</strong> Rs 0.9 crore.<br />
Key machinery manufacturers/suppliers in India<br />
Similar to shade-nets<br />
Quality Control and Standards<br />
No BIS code is available for anti-hail nets and bird protection nets.
Crop covers<br />
Crop-covers create an excellent microenvironment for seed germination and seedling growth. A crop-<br />
cover is placed over a large area (several rows) <strong>of</strong> a crop. In cooler climates, crop-covers are <strong>of</strong>ten<br />
placed over direct seeded rows or recently transplanted crops to create a warmer, more humid<br />
microenvironment to facilitate rapid plant establishment <strong>of</strong> warm season crops. Crop covers also<br />
provide crop protection from insects.<br />
Advantages <strong>of</strong> using crop covers:<br />
• Higher soil and air temperatures compared to those in the open field which leads to early<br />
harvest<br />
• Protect crops from rain, hail, snow and wind<br />
• Providing protection against insect pests<br />
• Improvements in seed bed conditions<br />
• Crop covers can also be used as a means to separate varieties to maintain line purity by<br />
excluding insects and thus preventing cross pollination<br />
• Higher yields and improved crop quality<br />
Product characteristics<br />
The crop covers can be classified as:-<br />
• Woven<br />
• Non Woven<br />
• Sheet / Film<br />
Non-woven crop-covers are the most common across the world. The light weight and the permeability<br />
<strong>of</strong> these covers allow gas exchange and penetration <strong>of</strong> rain, controls insects, enhances growth and<br />
freeze protection and eliminates hand ventilation. Although non-woven materials are more expensive,<br />
they do not burn or chaff crops as readily by allowing some penetration <strong>of</strong> water and lowering the<br />
maximum temperatures beneath the cover.<br />
The non-woven crop covers are UV Treated fabrics <strong>of</strong> polypropylene manufactured using the spun<br />
bond technique. The crop covers are light in weight (generally 17-19 grams per square metre) so that<br />
the plants are not crushed under their weight. Generally 17 to 19 GSM UV treated white fabric is used<br />
in hot climate and 20 to 30 GSM in cold climates to protect the crops from frost. The non woven<br />
fabrics are packed in the form <strong>of</strong> rolls <strong>of</strong> 3 metre width and length <strong>of</strong> 450-500 metres.
In addition, woven crop-covers are also used around the world. The simplest and most economical<br />
form <strong>of</strong> crop covers are the direct or floating covers with no sustaining wire or cane hoops.<br />
The primary raw material, Polypropylene is available locally. (Reliance Industries Ltd is the largest<br />
manufacturer).<br />
Market dynamics and key growth drivers<br />
The discussions with the manufacturers have revealed that the domestic market size <strong>of</strong> crop-covers is<br />
insignificant. However, the Indian market holds a great potential for the non-woven crop covers. It is<br />
estimated that the ultimate potential area requiring crop covers is one million hectares. But, in the<br />
absence <strong>of</strong> any government policy for promoting the use <strong>of</strong> crop-covers in India, the domestic<br />
<strong>consumption</strong> has not picked up.<br />
The manufacturers cater to the export demand from the middle-east countries like UAE, Oman, as<br />
well as developed countries like UK and USA. The demand from these countries is the most<br />
important factor affecting the industry. The future performance <strong>of</strong> the industry depends on value<br />
addition and new product development apart from cost competitiveness.<br />
Key manufacturers and exporters<br />
Unimin India Ltd, Fiberweb India Ltd, KK Non-woven and KT Exports are the major manufacturers<br />
and exporters <strong>of</strong> crop covers in India apart from Surya Textech (Chandigarh) and Vimal Industries<br />
(Himanchal Pradesh).<br />
Manufacturer Year Product Production Installed<br />
quantity** capacity<br />
Unimin 2007-08 SBPF 165 MT*<br />
Fiberweb India<br />
Non-woven<br />
Jan-Dec, 2007 fabrics<br />
(spunbond)<br />
3,312 MT 4,000 MT<br />
Source: Capitaline, Annual reports, <strong>Industry</strong> survey<br />
* The production <strong>of</strong> SBPF at Unimin India has dropped from 2,243 MT in 2005-06 to 165 MT in 2007-08<br />
because <strong>of</strong> on-going operational issues in the plant.<br />
**The non-woven fabric is sold for other applications also<br />
Market size <strong>of</strong> crop-covers and future forecast<br />
The domestic <strong>consumption</strong> <strong>of</strong> crop-covers is negligible (as discussed with manufacturers). Plastic<br />
sheets or low tunnels are used instead <strong>of</strong> crop-covers in India. Hence, the total size <strong>of</strong> the industry is<br />
equivalent to exports. Since there is no focus on crop-covers in the XIth plan, the usage <strong>of</strong> crop-covers<br />
is not expected to pick-up in India over the next 5 years. Once the production at Unimin picks up<br />
again, the total production <strong>of</strong> crop-covers is expected to increase considerably. Several other units
have also set-up spun-bond non-woven capacities. Hence, the exports <strong>of</strong> crop-covers are expected to<br />
increase by 20% y-o-y over the next 5 years.<br />
The current and future forecast <strong>of</strong> crop-covers production in India is given below:-<br />
Crop-covers production 2007-08 2012-13<br />
Quantity 1,000 MT 2,500 MT<br />
Value Rs 10 crore Rs 25 crore<br />
Imports & Exports <strong>of</strong> crop-covers<br />
Source: <strong>Industry</strong> survey, IMaCS Analysis<br />
The quantum <strong>of</strong> imports for crop-covers is not significant as per discussions with the industry players.<br />
The estimated export figures for crop-covers are as given below:-<br />
HS Code Description<br />
39269099,<br />
56031100<br />
CROP-COVERS<br />
(GSM 17-21)<br />
Exports Exports<br />
(in MT) (in Rs crore)<br />
2007-08(E) 2007-08(E)<br />
Around 1,000 Approx. Rs 10<br />
MT<br />
crore<br />
Source: IBIS, IMaCS Analysis<br />
Crop-covers are exported from India to Middle-east countries UAE, Saudi Arabia and Oman. The<br />
exports <strong>of</strong> crop covers in the year 2012-13 are expected to be to the tune <strong>of</strong> Rs 17.6 crore, growing at<br />
12% year on year.<br />
Key machinery manufacturers / suppliers in India<br />
Most <strong>of</strong> the machinery used is imported from Germany, China and Taiwan. Unimin India Ltd has<br />
installed machinery <strong>of</strong> Reic<strong>of</strong>il GmbH (Germany).<br />
For spun-bond non-woven manufacture, the commonly used production line is Reic<strong>of</strong>il double beam<br />
production line manufactured by Reifenhauser Gmbh <strong>of</strong> Troisdorf, Germany. Several Indian players<br />
have imported Chinese machinery (e.g. single beam PP spunbond line from Shaoyang, China) at a<br />
much cheaper price.<br />
Quality Control and standards in India<br />
There are no Indian standards available
Fishing nets<br />
Fishnets are key <strong>technical</strong> <strong>textiles</strong> used in fishing industry. Fishing nets are knitted fabrics used for<br />
marine and inland fishing by fisherman, fishing trawlers and boats. The characteristics and<br />
specifications <strong>of</strong> fishnets vary based on the method adopted for fishing.<br />
Product characteristics<br />
Fishing nets are classified as:<br />
• HDPE fishnets<br />
• Nylon Mono-filament fishnets and<br />
• Nylon Multi-filament fishnets<br />
Fishnets are made from Nylon or HDPE twines which could be used in mon<strong>of</strong>ilament form or single<br />
twines twisted together for multifilament form. The basic characteristics for fishnets are transparency<br />
and invisibility in water. The critical operational characteristics <strong>of</strong> fishnets are - high tensile strength,<br />
high knot breaking strength, high abrasion resistance and low drag resistance. The mesh size ranges<br />
from 10 mm to 2,000 mm based on area and method <strong>of</strong> application. The various types <strong>of</strong> knots used<br />
for fishnet construction are single, double and U-knots. In case <strong>of</strong> multifilament nets, the number<br />
plies in the yarn varies from 2 to 36. The length and breadth dimensions <strong>of</strong> the fishnets are primarily<br />
driven by customer specifications. These nets are available in 100 m, 250 m, 500 m, 600 m and 1000<br />
m spools.<br />
Market dynamics and key growth drivers – Fishing industry in India<br />
India is one <strong>of</strong> the leading fish producing countries in the world with third position in fisheries and<br />
second in aquaculture. India is endowed with vast fisheries resources in terms <strong>of</strong> a coast line <strong>of</strong> 8,118<br />
km and 2.02 million square km <strong>of</strong> Exclusive Economic Zone, including 0.530 million square km <strong>of</strong><br />
continental shelf. The inland fisheries resources include rivers and canals (1.95 lakh km), reservoirs<br />
(3.15 million ha), floodplain wetlands (0.35 million ha), estuaries (0.26 million ha), freshwater waters<br />
(2.41 million ha) and brackish-water bodies (1.24million ha). At present, an estimated 14 million<br />
people are engaged in fishing, aquaculture and ancillary activities.<br />
Fisheries contribute 1-2% <strong>of</strong> the national GDP and 5-6% <strong>of</strong> the agricultural and allied activities.<br />
Demand for fish and fish products are increasing both in the domestic and export markets. This has<br />
been caused due to the health concerns and the perception <strong>of</strong> fish as a healthy food with high levels <strong>of</strong><br />
digestible protein and cholesterol lowering capabilities. The projected demand for fish in the country<br />
by 2012 is 9.74 million tonnes (Fisheries Division, 2006, NCAP, 2006) including 5.9 million MT for<br />
the domestic market, up from the demand for fish in 2005-06 <strong>of</strong> 6.37 million MT. The projected
supply <strong>of</strong> fish is 9.60 million MT by 2012 with major share <strong>of</strong> 5.34 million MT from inland<br />
aquaculture followed by 3.10 million MT from marine fisheries. Hence, the fish production in India is<br />
expected to increase at around 7% p.a.<br />
Going further there would be increased modernisation <strong>of</strong> fishing industry and improved fisheries<br />
culture which would boost the industry growth.<br />
Market size <strong>of</strong> fishing nets and future forecast<br />
The total production <strong>of</strong> fishnets in 2007-08 is estimated as around 12,000 MT (Source: Indian<br />
Fishnets Manufacturers Association) by the members <strong>of</strong> the association. In addition, large players like<br />
garware Wall Ropes, Garware Marine, Kwality Nets, etc are also manufacturing fishnets (around<br />
5,000 MT per annum). The market size <strong>of</strong> fishnets was estimated as 13,300 MT in 2001-02 by ECTT<br />
report. Several companies like JK, Nirlon, Enka etc have lowered/stopped supplying raw-materials to<br />
the fishnet manufacturers.<br />
Average life <strong>of</strong> fishing nets is 2 – 3 years with mending (repair after use). The fishnets price is around<br />
Rs 275 per kg (average).<br />
The fishing nets industry in India is expected to grow at a rate marginally less than the growth <strong>of</strong><br />
fishing industry in India (as technology improvement would increase fish production per fishnet).<br />
Hence, the growth <strong>of</strong> fishnets industry is expected to be around 4-5% per year.<br />
The current and future forecast <strong>of</strong> fishnets (100% <strong>technical</strong> <strong>textiles</strong>) is given below:-<br />
Fishnets domestic usage 2007-08 2012-13<br />
Quantity<br />
Value<br />
15,343 19,582<br />
million MT* million MT<br />
Rs 442.1<br />
crore<br />
Rs 564 crore<br />
Source: <strong>Industry</strong> survey, IFMA, IMaCS Analysis<br />
* The domestic usage <strong>of</strong> fishnets has been deducedfrom the fishnets production by accounting for imports and<br />
exports <strong>of</strong> fishnets. The production <strong>of</strong> fishnets in India is around 17,000 MT.<br />
The potential domestic market for the fishnets industry in 2012-13 is estimated at Rs. 564 crore up<br />
from Rs 442.1 crore in 2007-08 (E). No inflationary increase has been assumed for the price <strong>of</strong><br />
fishnets. In volume terms, the usage <strong>of</strong> fishnets is expected to grow from 15,343 MT in 2007-08 to<br />
19,582 MT in 2012-13.<br />
Key manufacturers <strong>of</strong> fishnets in India
There are as many as 250-300 players manufacturing fishing nets or importing/exporting fishing nets<br />
in India. Most <strong>of</strong> these units are SSI units. Garware marine has a production capacity <strong>of</strong> 500 MT <strong>of</strong><br />
fishing nets and production <strong>of</strong> 371 MT fishing nets (year-ending June 2007). Garware Wall Ropes is<br />
the largest player in the fishnets market with a capacity <strong>of</strong> 6,970 MT <strong>of</strong> nettings (Source: Capitaline)<br />
<strong>of</strong> which the capacity <strong>of</strong> fishing nets is around 5,000 MT. The company manufactured 6,133 MT <strong>of</strong><br />
nettings in 2007-08. Garware Wall Ropes manufactured 15,842 MT <strong>of</strong> Synthetic ropes/twines and<br />
yarn in 2007-08 (capacity 27,514 MT). These twines are used for manufacturing ropes as well as nets<br />
including fishnets.<br />
Hinafil India Pvt Ltd has production capacity <strong>of</strong> 960 MT <strong>of</strong> nylon mono-filament fishnets with<br />
production <strong>of</strong> only 39 MT in 2006-07.<br />
SRF Polymers Limited is a major player in the fishnets twines industry with production <strong>of</strong> 500 MT <strong>of</strong><br />
nylon twines (capacity <strong>of</strong> 1,440 MT) every year. These twines are used to manufacture fishnets / fish<br />
lines.<br />
There is a lot <strong>of</strong> excess capacity <strong>of</strong> fishnets in India (Garware Marine and Garware Wall Ropes are<br />
not using their complete capacity for production). The capacity <strong>of</strong> fishnets in India is expected to<br />
increase at 5-10% y-o-y as the small-scale players in the industry are expected to increase.<br />
Imports & Exports <strong>of</strong> fishnets<br />
The import figure for fishing nets is as given below:-<br />
HS Code Description<br />
Imports<br />
(in MT)<br />
Imports<br />
(in Rs crore)<br />
2007-08(E) 2007-08(E)<br />
56081110<br />
MADE UP FISHING NETS<br />
OF NYLON<br />
Around 650<br />
MT<br />
~ Rs 11 crore<br />
56081110<br />
MADE UP FISHING NETS<br />
OF NYLON (USED)<br />
Around 550<br />
MT<br />
~ Rs 2 crore<br />
56075010 NYLON FISH NET TWINE Around 25 MT ~ Rs 0.4 crore<br />
Source: DGCIS, IMaCS Analysis<br />
Used fishing nets are imported primarily from Pakistan followed by Sri Lanka and Bangladesh. India<br />
imports 60-70% <strong>of</strong> the fishnets from China, 20-25% from Thailand, around 8-10% from Italy and the<br />
remaining from Sri Lanka. Jaya Engineering located at Thuthukudi, Tamil Nadu has imported fishing<br />
nets <strong>of</strong> around 6 crore in 2007-08 from UK.<br />
The estimated export figures for fishing-nets are as given below:-<br />
HS Code Description<br />
Exports<br />
(in MT)<br />
Exports<br />
(in Rs crore)
56081900, 56081110,<br />
56081190, 56074900,<br />
56075090<br />
56081110, 56081190,<br />
56075090<br />
HDPE FISHING NETS*<br />
2007-08(E) 2007-08(E)<br />
Around 1500<br />
MT<br />
~ Rs 25 crore<br />
NYLON FILAMENT<br />
KNITTED FISHING NETS<br />
Around 700<br />
MT<br />
~ Rs 10 crore<br />
56075010 NYLON FISH NET TWINE<br />
Around 132<br />
MT<br />
~ Rs 2 crore<br />
Source: IBIS, DGCIS, IMaCS Analysis<br />
* Various nets are imported under the HS code 56081900 including fishnets/twines, sports nets, safety<br />
nets, shade-nets, etc <strong>of</strong> man-made fibres. The estimates <strong>of</strong> HDPE fishing nets are covered above.<br />
Africa accounts for around 40% exports <strong>of</strong> fishnets from India while the remaining 60% fishnets are<br />
exported to Sri Lanka, Middle-East and European countries. These exports are expected to grow at<br />
6% CAGR and reach a size <strong>of</strong> Rs 49.5 crore by the year 2012-13.<br />
Navshie exports had fishing nets exports <strong>of</strong> around Rs 5 crore in 2007-08 while Ayyava Nadar &<br />
Sons had exports <strong>of</strong> around Rs 1.5 crore fishing nets.<br />
Raw-materials and machinery for manufacturing fishnets<br />
Fishnets are manufactured using nylon chips as well as HDPE as given below:-<br />
Nylon Chips HDPE Chips<br />
Multifilament Mon<strong>of</strong>ilament HDPE yarn<br />
Nylon Twine HDPE Twine<br />
Fishnet nets and Accessories<br />
Around 2-3% <strong>of</strong> nylon goes as wastage in the manufacture <strong>of</strong> fishing nets.<br />
Fish nets are manufactured using power driven net making machines in small and medium scale<br />
sectors and by hand knitting in the cottage sector. The machineries required and raw materials are<br />
available locally from local traders. Sometimes the machines are also imported from countries like<br />
Japan (Amita, Toyo).<br />
90% <strong>of</strong> Nylon is sourced from domestic suppliers and nearly 10% is imported. Major vendors for<br />
nylon in India are SRF, GSFC, JCT and Century. The raw-material imports are taking place from<br />
Thailand, Russia, Germany and China.
MEDITECH<br />
Meditech products include textile material used in hygiene, health and personal care as well as<br />
surgical applications. The Meditech products are available in woven, knitted and non-woven forms<br />
based on the area <strong>of</strong> application. Increasingly, synthetic fibre is being used in the production <strong>of</strong> these<br />
products.<br />
The <strong>technical</strong> textile products covered under Meditech are as given below:-<br />
• Baby diapers<br />
• Incontinence diapers<br />
• Sanitary napkin<br />
• Surgical sutures<br />
• Disposables<br />
• Surgical dressing<br />
• Contact lens<br />
• Artificial implants<br />
Technical <strong>textiles</strong> <strong>consumption</strong> under Meditech is estimated at around Rs 1,500 crore. The key<br />
Meditech product is surgical dressings which accounts for over 50% <strong>of</strong> the total <strong>technical</strong> textile<br />
<strong>consumption</strong> across Meditech segment. Surgical sutures account for around 21% <strong>of</strong> the total<br />
<strong>consumption</strong> followed by contact lenses and artificial implants with shares <strong>of</strong> around 12% and 8%<br />
respectively in the total <strong>consumption</strong>. The non-woven fabric in disposables accounts for 2% <strong>of</strong> the<br />
<strong>technical</strong> textile usage in Meditech segment and sanitary napkins account for 1.65%.<br />
The artificial implants are primarily imported with around 15% share <strong>of</strong> domestic production in total<br />
usage. The non-woven fabric availability is limited in India and hence, the non-woven products such<br />
as baby diapers and adult diapers are primarily imported.<br />
The domestic <strong>consumption</strong> <strong>of</strong> <strong>technical</strong> <strong>textiles</strong> under Meditech is expected to increase from around<br />
Rs 1,514 crore in 2007-08 to around Rs 2,263 crore by 2012-13.The demand for the Meditech<br />
products is dependent on the health and hygiene sector growth. In the medium term (next 5 years), the<br />
Meditech industry is expected to achieve growth at the rate <strong>of</strong> 8-9% year on year.<br />
The type <strong>of</strong> fibre used varies based on the application. The synthetic fibres are steadily replacing<br />
natural fibres. However, most <strong>of</strong> products under Meditech (and related fibre) need sterilisation and<br />
should be non-carcinogenic and anti-allergen in nature.
The <strong>technical</strong> <strong>textiles</strong> usage in the Meditech products exported from India is around Rs 155 crore. The<br />
key products exported from India are surgical sutures and surgical dressings.<br />
Summary <strong>of</strong> the market-sizing for Meditech<br />
Baby Diapers<br />
Baby Diapers<br />
(TT<br />
component)*<br />
Incontinence<br />
Diapers<br />
Incontinence<br />
Diapers<br />
(TT<br />
component)*<br />
Sanitary<br />
Napkins<br />
Sanitary<br />
Napkins<br />
(TT component)<br />
Surgical Sutures<br />
Surgical<br />
Disposables (TT<br />
fabric)<br />
Quantity<br />
Value<br />
Quantity<br />
Value<br />
Quantity<br />
Value<br />
Quantity<br />
Value<br />
Quantity<br />
Value<br />
Quantity<br />
Value<br />
Quantity<br />
Value<br />
Quantity<br />
Value<br />
Production Imports Exports<br />
-<br />
-<br />
350<br />
million<br />
pieces<br />
approx.<br />
Rs 135<br />
crore<br />
2007-08 2012-13<br />
-<br />
<strong>Domestic</strong><br />
Consumption<br />
350 million<br />
pieces<br />
approx.<br />
<strong>Domestic</strong><br />
Consumption<br />
500 million<br />
pieces<br />
approx.<br />
- Rs 135 crore Rs 193 crore<br />
- 1,150 MT - 1,150 MT 1,650 MT<br />
-<br />
-<br />
-<br />
Rs 11.5<br />
crore<br />
12.5<br />
million<br />
pieces<br />
Rs 15<br />
crore<br />
- Rs 11.5 crore Rs 16.5 crore<br />
-<br />
12.5 million<br />
pieces<br />
38.1 million<br />
pieces<br />
- Rs 15 crore Rs 45.7 crore<br />
- 125 MT - 125 MT 381 MT<br />
-<br />
2,000<br />
million<br />
pieces<br />
Rs 700<br />
crore<br />
4 – 4.25<br />
million<br />
dozens<br />
Rs 330<br />
crore<br />
Rs 1.38<br />
crore<br />
250<br />
million<br />
pieces<br />
Rs 40<br />
crore<br />
35 – 37<br />
million<br />
meters<br />
Rs 36<br />
crore<br />
- Rs 1.38 crore Rs 4.2 crore<br />
0.5 million<br />
pieces<br />
2,250 million<br />
pieces<br />
Rs 1 crore Rs 739 crore<br />
1.15 million<br />
dozens<br />
4,000 million<br />
pieces<br />
Rs 1,300<br />
crore<br />
2,150 MT 3,800 MT<br />
Rs 25 crore Rs 44 crore<br />
4 – 4.5<br />
million<br />
dozens<br />
5 – 5.5<br />
million<br />
dozens<br />
Rs 41 crore Rs 325 crore Rs 415 crore<br />
300 MT 100 MT 890 MT 1446 MT<br />
Rs 33.95 Rs 1.35 Rs 3 crore Rs 32.3 crore Rs 61 crore<br />
Export<br />
Potential<br />
-<br />
-<br />
-<br />
-<br />
Rs 1.1<br />
crore<br />
-<br />
Rs 72.3<br />
crore<br />
Rs 4.5<br />
crore
Surgical<br />
Dressings<br />
Contact Lenses<br />
Artificial<br />
Implants<br />
Quantity<br />
Value<br />
Quantity<br />
Value<br />
Quantity<br />
Value<br />
Production Imports Exports<br />
crore crore<br />
2007-08 2012-13<br />
<strong>Domestic</strong><br />
Consumption<br />
<strong>Domestic</strong><br />
Consumption<br />
- - - - -<br />
Rs 887<br />
crore<br />
-<br />
-<br />
Rs 17.5<br />
crore<br />
TOTAL Value Rs 1,968<br />
crore<br />
TOTAL (TT<br />
component)<br />
Value Rs 1,268<br />
crore<br />
Rs 31<br />
crore<br />
5 – 6<br />
million<br />
pairs<br />
Rs 30<br />
crore***<br />
Rs 97.25<br />
crore<br />
Rs 552<br />
crore#<br />
Rs 375<br />
crore#<br />
Rs 93 crore Rs 825 crore<br />
0.5 – 1<br />
million<br />
pairs<br />
Rs 15 – 20<br />
crore<br />
5.2 million<br />
pairs<br />
Rs 1,000<br />
crore<br />
16.1 million<br />
pairs<br />
Rs 179 crore Rs 473 crore<br />
- Rs 114.75<br />
Rs 156<br />
crore<br />
Rs 155<br />
crore<br />
Rs 2,365<br />
crore<br />
Rs 1,514<br />
crore<br />
Rs 249.1<br />
crore<br />
Rs 3,737<br />
crore<br />
Rs 2,263<br />
crore<br />
* Baby diapers and Incontinence diapers are not manufactured in India; these products are imported,<br />
repackaged and sold in the Indian market<br />
** Most <strong>of</strong> the fabric import is for caps, masks, etc and not for drapes. Hence, the share <strong>of</strong> imports is<br />
high in terms <strong>of</strong> volume but low in terms <strong>of</strong> value<br />
*** Though the market price <strong>of</strong> contact lens is over Rs 1000 per pair, the import price is very low<br />
leading to lower import value <strong>of</strong> contact lenses<br />
# For contact lens, imports value equivalent to market value taken<br />
As per ECTT report, the potential market sizing for 2007-08 was as given below:-<br />
Market size<br />
(ECTT report)<br />
Baby Diapers<br />
Quantity<br />
2001-02 2007-08 (P)<br />
53.85 million<br />
nos.<br />
80.81 million<br />
nos.<br />
Value Rs 70 crore Rs 105.05 crore<br />
Export<br />
Potential<br />
Rs 150<br />
crore<br />
-<br />
-<br />
Rs 228<br />
crore
Market size<br />
(ECTT report)<br />
Baby Diapers<br />
(TT component)<br />
Incontinence Diapers<br />
Incontinence Diapers<br />
(TT component)<br />
Sanitary Napkins<br />
Sanitary Napkins<br />
(TT component)<br />
Surgical Sutures<br />
Healthcare Textiles<br />
Surgical Dressings<br />
Artificial Implants<br />
TOTAL<br />
TOTAL (TT<br />
component)<br />
2001-02 2007-08 (P)<br />
Quantity 161.55 MT 242.43 MT<br />
Value Rs 1.78 crore Rs 2.67 crore<br />
Quantity<br />
3.5 million<br />
nos.<br />
22.51 million<br />
nos.<br />
Value Rs 20 crore Rs 135.07 crore<br />
Quantity 32.97 MT 212.07 MT<br />
Value Rs 0.36 crore Rs 2.33 crore<br />
Quantity<br />
Value<br />
959.69<br />
million nos.<br />
Rs 335.89<br />
crore<br />
1997.44 million<br />
nos.<br />
Rs 699.1 crore<br />
Quantity 718.81 MT 1496.08 MT<br />
Value Rs 8.32 crore Rs 17.27 crore<br />
Quantity - -<br />
Value Rs 225 crore Rs 441 crore<br />
Quantity - -<br />
Value Rs 3.2 crore Rs 120.24 crore<br />
Quantity - -<br />
Value Rs 450 crore Rs 694.48 crore<br />
Quantity - -<br />
Value Rs 89.2 crore Rs 144.8 crore<br />
Quantity - -<br />
Value<br />
Rs 1,203.75<br />
crore<br />
Rs 2,362.01<br />
crore<br />
Quantity - -<br />
Value<br />
Rs 777.86<br />
crore<br />
Capital Employed and Pr<strong>of</strong>itability <strong>of</strong> key players <strong>of</strong> Meditech<br />
Rs 1,422.79<br />
crore
Company Name<br />
Capital Employed<br />
(Rs crore)<br />
Net Pr<strong>of</strong>it Ratio<br />
(%)<br />
2006-07 2007-08 2006-07 2007-08<br />
Eastman Industries Ltd. 35.7 41.3 2.1% 3.8%<br />
Fiberweb (India) Ltd. 41.6 -10.0 -8.8% -159.5%<br />
Gufic Biosciences Ltd. 20.3 18.9 1.2% 1.6%<br />
Johnson & Johnson Ltd. 235 350.6 8.0% 6.2%<br />
Procter & Gamble Hygiene & Health Care<br />
Ltd. 272.7 291.2 20.0% 14.87%<br />
Ramaraju Surgical Cotton Mills Ltd. 117.3 196.3 3.9% 1.8%<br />
T T K Healthcare Ltd. 43.4 52.6 1.4% 5.38%<br />
Unimin India Ltd. 22.3 23.9 -140.9% -102.4%<br />
Source: Prowess database, IMaCS analysis<br />
Meditech segment <strong>of</strong> <strong>technical</strong> <strong>textiles</strong> is estimated to provide employment to 32,000 people 4 <strong>of</strong><br />
whom number <strong>of</strong> <strong>technical</strong> 5 employees is estimated at 20,000 and number <strong>of</strong> non-<strong>technical</strong> employees<br />
is estimated at 12,000.<br />
The key impediments to the growth <strong>of</strong> meditech products are:-<br />
1. High cost <strong>of</strong> machinery and high excise costs and other manufacturing costs make diaper<br />
production in India costlier than the imports<br />
2. Absence <strong>of</strong> any norms for medical waste management <strong>of</strong> medical disposables in India<br />
3. The usage <strong>of</strong> surgical disposables is low because <strong>of</strong> low awareness levels and lack <strong>of</strong><br />
standards enforcing the usage <strong>of</strong> medical disposables<br />
4. The organised surgical dressing industry is subjected to excise duty which is exempted for<br />
small scale industries manufacturing surgical disposables. Also, the small scale industries are<br />
eligible for VAT exemption in some states. Hence, the indirect costs on the production render<br />
the products manufactured by organised industry expensive as compared to unorganised<br />
industry.<br />
5. The decision to purchase medical implant is driven by the doctors, who generally prefer<br />
imported products over indigenous ones.<br />
4 Employment has been estimated based on the analysis <strong>of</strong> primary and secondary data available for the<br />
<strong>technical</strong> textile manufacturers. IMaCS has made appropriate adjustments because <strong>of</strong> insufficient data.<br />
5 Technical includes managerial staff and skilled labour whereas non-<strong>technical</strong> includes unskilled labour.
Baby Diapers<br />
Baby diapers are used to absorb and retain body fluids <strong>of</strong> infants in period between birth and 24<br />
months. Diapers are essentially made by a sandwich <strong>of</strong> an absorbent pad between fabric sheets. The<br />
<strong>technical</strong> textile component <strong>of</strong> the diaper is the non-woven fabric which prevents fluid leakage and<br />
gives diaper the desired shape.<br />
Product characteristics<br />
The baby diapers are generally available in four sizes - small, medium, large and extra large, with an<br />
overall snug fitting. The typical product characteristics are as given below:<br />
(i) Super absorbent polymer should ensure complete dryness and prevent growth <strong>of</strong> bacteria<br />
(ii) The non-woven used should be hydrophilic and absorb fluids fast<br />
(iii) Fastening mechanism, optionally adjustable.<br />
(iv) The cover should be breathable<br />
(v) Optional, leg guards to prevent leakage<br />
The spunbond non-woven fabric used in diapers is 20-25 GSM and accounts for close to 12-15% by<br />
weight <strong>of</strong> the diaper.<br />
Market dynamics and key growth drivers<br />
In India, there are around 60-70 million babies up to thirty months age group, which is the potential<br />
size <strong>of</strong> the Indian baby diaper market. However, the penetration <strong>of</strong> these products has been less due to<br />
the following reasons:<br />
(i) Costly diaper products<br />
(ii) Easy availability <strong>of</strong> maid/baby sitter<br />
(iii) Lack <strong>of</strong> awareness amongst parents<br />
In future, the market will be driven primarily by increased acceptance <strong>of</strong> these products either through<br />
increased awareness or reduction in product prices.<br />
Key manufacturers <strong>of</strong> baby diapers and non-woven for baby diapers
The baby diaper market in India is quite oligopolistic in nature; the marketing <strong>of</strong> baby diapers in India<br />
is limited to a few large companies. The baby diapers marketed in India are primarily imported and<br />
repackaged for sale. The major brands like Huggies (Kimberley Clark Lever), Pampers (Procter and<br />
Gamble), Snuggy (Godrej-SCA) and Wipro Baby S<strong>of</strong>t cover more than 95% <strong>of</strong> the domestic market.<br />
The key suppliers <strong>of</strong> non-woven for baby diapers in India are Unimin India Ltd. and Fiberweb Pvt.<br />
Ltd.<br />
Manufacturer Year Product Production Installed<br />
quantity** capacity<br />
Unimin 2007-08 SBPF 165 MT*<br />
Fiberweb India<br />
Non-woven<br />
Jan-Dec, 2007 fabrics<br />
(spunbond)**<br />
3,312 MT 4,000 MT<br />
Source: Asian CERC, Annual reports, <strong>Industry</strong> survey<br />
* The production <strong>of</strong> SBPF at Unimin India has dropped from 2,243 MT in 2005-06 to 165 MT in 2007-<br />
08 because <strong>of</strong> on-going operational issues in the plant.<br />
**The non-woven fabric is sold for other applications also<br />
Consumption norms and the market size<br />
The non-woven fabric is 20-25 GSM and accounts for close to 12-15% by weight <strong>of</strong> the diaper i.e.<br />
around 3-4 grams per diaper. With an average weight <strong>of</strong> 30-35 grams per diaper the total baby diaper<br />
tonnage in 2007-08 is approximately 5900 MT.<br />
Non-woven <strong>consumption</strong> norms (baby diaper industry)<br />
Diaper usage (million pieces) 350<br />
Amount <strong>of</strong> non-woven per diaper (gms) 3 to 3.5<br />
% <strong>of</strong> non-woven by weight (average) ~10%<br />
Total non-woven used (Tonnes) 1,150<br />
Source:Godrej-SCA, The Indian Textile Journal, <strong>Industry</strong> survey, IMaCS Analysis<br />
With an average price <strong>of</strong> Rs. 10-12 per piece, the diaper market by volume in India is approximately<br />
350 million pieces (the diapers are available in three sizes small, medium and extra large based on the<br />
baby’s age). The value <strong>of</strong> the non-woven fabric in the diaper is approximately Rs. 11.5 crore and<br />
expected to grow with increased penetration <strong>of</strong> diaper usage.<br />
The diaper market in India is growing at the rate <strong>of</strong> 5%-10% year on year.
The current and future forecast <strong>of</strong> non-woven <strong>consumption</strong> in the baby diaper industry is given<br />
below:-<br />
Non-woven usage in baby<br />
diapers industry<br />
<strong>Domestic</strong> usage<br />
2007-08 2012-13<br />
Non-woven fabric Quantity 1,150 MT 1,650 MT<br />
Non-woven fabric Value Rs 11.5 crore Rs 16.5 crore<br />
Source: <strong>Industry</strong> survey, IMaCS Analysis<br />
The potential market for non-woven fabric in the baby diaper industry in 2012-13 is estimated at Rs.<br />
16.5 crore up from Rs 11.5 crore in 2007-08 (E). No inflationary increase has also been assumed for<br />
the price <strong>of</strong> non-woven fabric. In volume terms, the usage <strong>of</strong> non-woven fabric in the baby diaper<br />
industry is expected to grow from 1,150 MT in 2007-08 to 1,650 MT in 2012-13.<br />
Imports and Exports <strong>of</strong> baby diapers<br />
The import figures for baby diapers are as given below:-<br />
HS Code Description Imports Imports<br />
2007-08(E) 2007-08(E)<br />
48184010* BABY DIAPERS<br />
Around 350<br />
million pieces<br />
Rs 135 crore<br />
approx.**<br />
Source: IBIS, IMaCS Analysis<br />
* In addition, baby diapers are also imported in very small quantities under HS codes 48184090, 48189000<br />
** Though the market price <strong>of</strong> diapers is around Rs 10 – 12 per piece, the import price is around Rs 4 per piece<br />
Singapore accounts for around 40% imports <strong>of</strong> baby diapers in India followed by Saudi (around 20-<br />
25% share), Malaysia (around 10% share) and China & UAE with around 5% share each. Imports in<br />
small quantities also take place from Thailand, Vietnam, Poland & Turkey.<br />
The exports are negligible as compared to the imports.
Incontinence Diapers<br />
Incontinence diaper also known as adult diapers are for people with loss <strong>of</strong> bladder control which<br />
typically applies to people in the age group <strong>of</strong> 70 years and more. Incontinence diapers are disposable<br />
single use products specifically designed to absorb and retain fluids. The diapers are typically made <strong>of</strong><br />
the absorbent material <strong>of</strong> cellulose with poly-beads to convert fluid into gel. The non-woven material<br />
is placed on top for dry feeling.<br />
Product characteristics<br />
The baby diapers are generally available in two sizes medium and large with an overall snug fitting.<br />
The typical product characteristics are as given below:<br />
1. Super absorbent polymer should ensure complete dryness and prevent growth <strong>of</strong> bacteria<br />
2. Super absorbent should quickly convert liquid to gel<br />
3. The non-woven used should be hydrophilic and absorb fluids fast<br />
4. Fastening mechanism, optionally adjustable.<br />
5. The cover should be breathable<br />
6. Optional, leg guards to prevent leakage<br />
Market dynamics and key growth drivers<br />
According to 2001 census India has in excess <strong>of</strong> 30 million adults with age equal and above 70 years.<br />
The number is set to increase with increasing medical care available to the population. The<br />
incontinence products are used for aged people who find it difficult to control the bladder, a certain<br />
percentage <strong>of</strong> this population. The incontinence products are expensive and have low penetration. The<br />
penetration <strong>of</strong> adult diapers is very low and restricted to urban retail market and medical institutions<br />
around the country. The medical institutions account for about 40% <strong>of</strong> the adult diaper market volume<br />
<strong>wise</strong>. The rest is through retail markets.<br />
The future market would be driven primarily by increased awareness, penetration coupled with drop<br />
in product prices.<br />
Key manufacturers <strong>of</strong> adult diapers<br />
The adult diapers are primarily imported by almost all companies and marketed with different<br />
packaging in the domestic market (similar to the baby diapers). Kimberley-Clark Lever with Depend<br />
and Godrej-SGA with Tena are the major branded players in the market. The other players are Elder<br />
Hartmann, Nobel Hygiene Care with Friends and Diaper India (Total Care). The spunbond non-
woven <strong>technical</strong> textile raw material is primarily imported as there are few non-woven producers in<br />
India.<br />
Consumption norms and the market size<br />
The non-woven used for these adult diapers is around 10 grams per piece. The non-woven material<br />
gives the feeling <strong>of</strong> dryness when the fluids are absorbed and converted into a gel by the poly-beads in<br />
the absorbent material.<br />
Non-woven <strong>consumption</strong> norms (adult diapers industry)<br />
Diaper usage (million pieces) 12.5<br />
Amount <strong>of</strong> non-woven per diaper (gms) 10<br />
Total non-woven used (MT) 125<br />
Source: <strong>Industry</strong> survey, IMaCS Analysis<br />
With an average price <strong>of</strong> Rs. 45 - 55 per piece, the adult diapers market by volume in India is<br />
approximately 12.5 million pieces. The diaper market in India is growing at the rate <strong>of</strong> 25% year on<br />
year.<br />
The current and future forecast <strong>of</strong> non-woven <strong>consumption</strong> in the adult diaper industry is given<br />
below:-<br />
Non-woven usage in baby<br />
diapers industry<br />
<strong>Domestic</strong> usage<br />
2007-08 2012-13<br />
Non-woven fabric Quantity 125 MT 381 MT<br />
Non-woven fabric Value Rs 1.38 crore Rs 4.2 crore<br />
Source: <strong>Industry</strong> survey, IMaCS Analysis<br />
The potential market for non-woven fabric in the adult diaper industry in 2012-13 is estimated at Rs.<br />
4.2 crore up from Rs 1.38 crore in 2007-08 (E). No inflationary increase has also been assumed for<br />
the price <strong>of</strong> non-woven fabric. In volume terms, the usage <strong>of</strong> non-woven fabric in the adult diapers<br />
industry is expected to grow from 125 MT in 2007-08 to 381 MT in 2012-13.<br />
Imports and Exports <strong>of</strong> adult incontinence diapers
The import figures for adult incontinence diapers are as given below:-<br />
HS Code Description Imports Imports<br />
2007-08(E) 2007-08(E)<br />
48184010,<br />
48184090 *<br />
ADULT DIAPERS<br />
Around 12.5<br />
million pieces<br />
Rs 15 crore<br />
approx.<br />
Source: IBIS, IMaCS Analysis<br />
* In addition, adult diapers are also imported in very small quantities under HS code 48189000<br />
** Though the market price <strong>of</strong> adult diapers is around Rs 45 – 55 per piece, the import price is around Rs 12<br />
per piece<br />
China accounts for around 50% imports <strong>of</strong> adult diapers in India followed by Taiwan (around 15%<br />
share), Malaysia (around 10% share), Hong Kong (with 5-10% share), USA (with 5% share) and<br />
UAE, Thailand, Singapore, Germany accounting for less than 5% share each.<br />
The exports are negligible as compared to the imports. Primarily Indian firms market imported<br />
products. However few producers in India are subsidiary <strong>of</strong> their manufacturing firms in China and<br />
other destinations and import products into India.<br />
Quality Control and Standards – The quality is based on the absorbency rate <strong>of</strong> the diaper. There<br />
are no documented standards in India.
Sanitary Napkin<br />
Sanitary napkin is a hygiene absorbent product used by women during menstrual periods. Sanitary<br />
napkins are essentially made by a sandwich <strong>of</strong> an absorbent pad between fabric sheets. The <strong>technical</strong><br />
textile component <strong>of</strong> the diaper is the non-woven fabric which prevents fluid leakage.<br />
Product characteristics<br />
The typical product characteristics are as given below:<br />
1. Super absorbent polymer should ensure complete dryness<br />
2. Hydrophilic non-woven to absorb fluids fast<br />
3. Snug fit<br />
4. Breathable cover<br />
The non-woven fabric is 18-20 GSM and accounts for around 11-12% by weight <strong>of</strong> the sanitary<br />
napkin i.e. around 0.95 to 1 grams per napkin.<br />
Market dynamics and key growth drivers<br />
The penetration <strong>of</strong> sanitary napkins is around 20% <strong>of</strong> the target population. The potential market<br />
(females in the age group <strong>of</strong> 15 years to 50 years) for sanitary napkins is in excess <strong>of</strong> 94 million<br />
(Source: Census India 2008 estimates) which is around 17% <strong>of</strong> the total female population.<br />
The sale <strong>of</strong> feminine hygiene products is low due to various factors, primary being:<br />
1. Lack <strong>of</strong> awareness, especially in rural India<br />
2. Lack <strong>of</strong> information on the products<br />
3. Availability <strong>of</strong> substitutes<br />
The price per unit varies from Rs. 3 to Rs 12 (average price Rs 3.5 per unit) and the Indian feminine<br />
protection market is pegged at around Rs.800 crore. The market is expected to increase with increased<br />
awareness and hence, adoption level amongst women. Attempts are being made to indigenise<br />
manufacturing machines to lower the cost <strong>of</strong> production.<br />
At present, the sanitary napkin market in India is growing at the rate <strong>of</strong> 10%-15% year on year.<br />
Key manufacturers<br />
The sanitary napkins market in India is dominated by Procter and Gamble, Johnson and Johnson and<br />
Kimberley Clark Lever. Johnson & Johnson brand Stayfree and Procter & Gamble brand Whisper
cover close to 85-90% <strong>of</strong> sanitary napkins market. The remaining market is shared by Kimberley<br />
Clark Lever’s Kotex, Gufic Biosciences brand Shapers and other domestic brands. The other smaller<br />
players in the market are Prime Hygiene Care Pvt. Ltd., Actifit India Pvt. Ltd., Dima Poducts, Donisi<br />
International, Hindustan Latex and Kaul Impex Pvt. Ltd. The non-woven <strong>technical</strong> textile raw<br />
material is primarily imported as there are few non-woven producers in India.<br />
Johnson & Johnson (J&J) sold 1,666 million pieces <strong>of</strong> sanitary napkins in 2005-06. Dima Products<br />
sold 1.54 million pieces in 2005-06.<br />
Consumption norms and the market size<br />
The non-woven fabric is 18-20 GSM and accounts for around 11-12% by weight <strong>of</strong> the sanitary<br />
napkin i.e. around 0.95 grams per napkin.<br />
Non-woven <strong>consumption</strong> norms (sanitary napkin industry)<br />
Sanitary napkin usage – approx. (million<br />
pieces)<br />
Amount <strong>of</strong> non-woven per napkin<br />
(grams)<br />
2250<br />
0.95<br />
% <strong>of</strong> non-woven by weight (average) 11-12%<br />
Total non-woven used (MT) 2150<br />
Source:Capitaline, The Indian Textile Journal, <strong>Industry</strong> survey, IMaCS Analysis<br />
Average weight <strong>of</strong> sanitary napkin is 8-10 grams; the total tonnage <strong>of</strong> sanitary napkin market in India<br />
is 20,000 MT (assuming average weight <strong>of</strong> sanitary napkin to be 9 grams).<br />
At present, the sanitary napkin market in India is growing at the rate <strong>of</strong> 10%-15% year on year.<br />
The current and future forecast <strong>of</strong> non-woven <strong>consumption</strong> in the sanitary napkin industry is given<br />
below:-<br />
Non-woven usage in sanitary<br />
napkins industry<br />
<strong>Domestic</strong> usage<br />
2007-08 2012-13<br />
Non-woven fabric Quantity 2,150 MT 3,800 MT<br />
Non-woven fabric Value Rs 25 crore Rs 44 crore<br />
Source: <strong>Industry</strong> survey, IMaCS Analysis<br />
The potential market for non-woven fabric in the sanitary napkin industry in 2012-13 is estimated at<br />
Rs. 44 crore up from Rs. 25 crore in 2007-08 (E). No inflationary increase has been assumed for the<br />
price <strong>of</strong> non-woven fabric. In volume terms, the usage <strong>of</strong> non-woven fabric in the sanitary napkin<br />
industry is expected to grow from 2,250 MT in 2007-08 to 4,000 MT in 2012-13.
Imports and Exports <strong>of</strong> sanitary napkins<br />
The direct import figures for sanitary napkins are as given below:-<br />
HS Code Description Imports Imports<br />
2007-08(E) 2007-08(E)<br />
48184090* SANITARY NAPKINS<br />
Around 250<br />
million pieces<br />
Rs 40 crore<br />
approx.<br />
Source: IBIS, IMaCS Analysis<br />
* In addition, sanitary napkins are also imported in very small quantities under HS code 48189000<br />
Thailand accounts for around 45-50% <strong>of</strong> direct imports <strong>of</strong> sanitary napkins in India followed by<br />
Slovakia (around 30% share), China (around 15% share), Tunisia (with 5-10% share) and Japan (with<br />
less than 5% share).<br />
The direct imports <strong>of</strong> sanitary napkins are very small compared to domestic production. The exports<br />
too are small at present and would increase only if big marketers utilise India as sourcing hub.<br />
The direct export figures for sanitary napkins are as given below:-<br />
HS Code Description Exports Exports<br />
2007-08(E) 2007-08(E)<br />
48184090,<br />
48189000,<br />
48181000*<br />
SANITARY NAPKINS<br />
Around 0.5<br />
million pieces<br />
Rs 1 crore<br />
approx.<br />
Source: IBIS, IMaCS Analysis<br />
The direct exports <strong>of</strong> sanitary napkins are limited to countries like Liberia, Myanmar, Maldives, Sri<br />
Lanka, Russia, and Bangladesh. Exports <strong>of</strong> sanitary napkins are expected to grow marginally to Rs 1.1<br />
crore by 2012-13.<br />
Based on the current market and import export figures, India is a manufacturer and consumer <strong>of</strong><br />
sanitary napkins. The growth in sanitary napkins industry depends upon the penetration <strong>of</strong> these<br />
hygiene products in the Indian households.<br />
Surgical Disposables<br />
The surgical disposables primarily consist <strong>of</strong> masks, caps, drapes, gowns, covers and shoe covers<br />
made <strong>of</strong> polypropylene spunbond fabric (non-woven) with or without polyethylene film. Surgical<br />
disposables are used in hospitals and pharmaceutical companies to maintain hygienic and sterile<br />
operations. These are called as surgical disposables as these are for one time use and disposed <strong>of</strong>f<br />
after one time usage.
In India, the majority <strong>of</strong> hospitals use cotton reusable surgical wear which needs to be sterilised after<br />
every use. The peril <strong>of</strong> re-usage is cross contamination which should be avoided. The disposable<br />
medical items are gradually replacing the reusable cotton cloth based surgical gear. With growth in<br />
the multi-specialty hospitals, medical tourism and improvement in general hygiene level at the<br />
hospitals, the demand for medical disposables is experiencing positive growth. However, the price<br />
sensitive nature <strong>of</strong> the hospital purchase managers has resulted in the low penetration <strong>of</strong> surgical<br />
disposables.<br />
Product characteristics<br />
The functional characteristics <strong>of</strong> surgical disposables are:<br />
1. High barrier to blood or body fluids<br />
2. Lower lint than linen (lint is a source <strong>of</strong> infection)<br />
3. Proven sterilisation performance<br />
4. Comfort and breathability<br />
5. Good bacteria filtration efficiency<br />
6. Breathing resistance<br />
7. Splash resistance<br />
The surgical disposable masks and caps are made from polypropylene (PP) spunbond fabric, spunlace<br />
fabric and Spunbond melt blown fabric and spunlace fabric (SMS) fabric. The weight <strong>of</strong> the fabric<br />
for caps is typically in the range <strong>of</strong> 12-25 GSM and for masks it is in the range <strong>of</strong> 25-40 GSM. The<br />
disposable drapes, gowns and covers are made <strong>of</strong> polypropylene (PP) spunbond fabric and Spunbond<br />
melt blown fabric and spunlace fabric (SMS). The weight <strong>of</strong> the fabric is typically 25-40 GSM for<br />
spunbond fabric for gowns and around 35-50 GSM for SMS fabric for drapes and covers.<br />
These products are manufactured in sterilised environment and packed in PP bags and dispenser<br />
boxes sterilised before despatch.<br />
Market dynamics and key growth drivers<br />
The growth <strong>of</strong> medical textile products is tied with the growth <strong>of</strong> the healthcare industry in India. The<br />
healthcare <strong>consumption</strong> in India is expected to grow to $195 billion from current $25 billion (Source:<br />
Moneycontrol, Mckinsey 2007 – The Bird <strong>of</strong> Gold-The rise <strong>of</strong> India’s consumer market). The rural<br />
India is expected to follow the increasing healthcare spend trend <strong>of</strong> urban India. The demand for<br />
disposables is expected to increase with the emergence <strong>of</strong> new tertiary care hospitals with<br />
international accreditations and improvement <strong>of</strong> service levels <strong>of</strong>f the existing hospitals. In addition,
the growth in pharmaceutical, biomedical and biotechnological companies would augment the<br />
demand for medical <strong>textiles</strong> especially disposables.<br />
Consumption norms and the market size<br />
The penetration <strong>of</strong> surgical disposable products is limited primarily to the hospitals in metro and<br />
cosmopolitan cities and tertiary care hospitals. The larger hospitals in the major cosmopolitan cities in<br />
India (Delhi, Mumbai, Kolkata, Chennai, Bangalore and Hyderabad) account for nearly 5.5-6% <strong>of</strong><br />
total beds in India. Almost all <strong>of</strong> these hospitals are using surgical disposables. The penetration <strong>of</strong><br />
surgical disposables in the remaining hospitals is estimated to be around 15%. The penetration <strong>of</strong><br />
<strong>technical</strong> textile surgical disposables is low due to the lack <strong>of</strong> awareness and usage experience. In<br />
addition, the usage <strong>of</strong> surgical disposables (masks and caps) in pharmaceutical companies has been<br />
assumed as 15% <strong>of</strong> the usage in hospitals based on the industry survey<br />
The average price <strong>of</strong> surgical disposables like caps, masks and shoe-covers is around 70 to 90 paisa<br />
per piece while that <strong>of</strong> drapes is Rs 300 per units and <strong>of</strong> gowns and covers is around Rs 50 per unit.<br />
The medical disposables like caps, masks and shoe covers are 100% <strong>technical</strong> textile products made-<br />
up from PP spunbond or SMS non-woven fabric. The <strong>consumption</strong> <strong>of</strong> Polypropylene (PP) spunbond<br />
material and SMS fabric varies with size <strong>of</strong> the product. The product used for drapes and gowns is<br />
typically 25 GSM and 80 GSM. The average size <strong>of</strong> spunbond fabric per material is around 2 square<br />
metres. The typical weight <strong>of</strong> these products varies from 50 grams to 160 grams. Spunlace material is<br />
also used in this manufacture <strong>of</strong> surgical disposables. The caps and masks require approximately 3<br />
grams <strong>of</strong> PP spun bond fabric while shoe-covers require 6 grams <strong>of</strong> PP spun bond fabric per unit. The<br />
raw materials account for 80-90% <strong>of</strong> the cost.<br />
Non-woven <strong>consumption</strong> norms (surgical disposables industry)<br />
Usage caps, masks & shoe covers per<br />
month in 300 bed hospital (pieces)<br />
Usage drapes, gowns & covers per<br />
month in 300 bed hospital (pieces)<br />
7,000 to10,000<br />
150 to 200<br />
Amount <strong>of</strong> non-woven per cap/mask 3 g<br />
Amount <strong>of</strong> non-woven per show-cover 6 g<br />
Amount <strong>of</strong> non-woven per drape,<br />
gown & cover<br />
Average price per cap / mask / shoe<br />
cover<br />
50 to 150 g<br />
Rs 0.7 to 0.9*
Average price per drape Rs 300<br />
Average price per gown / cover Rs 50<br />
* The average price <strong>of</strong> surgical disposables has reduced from around Rs.3 to Rs.5per disposable around 3 years<br />
back to around 70-90 paise<br />
Source: <strong>Industry</strong> survey, IMaCS Analysis<br />
The domestic usage <strong>of</strong> the surgical disposables – caps, masks & shoe covers in India is estimated at<br />
around 70 million pieces annually. The domestic usage <strong>of</strong> the surgical disposables – drapes, gowns &<br />
covers in India is estimated at around 1.5 to 2 million pieces annually. The usage estimates for drapes<br />
and gowns are based on industry survey. Based on industry survey, the industry is expected to grow at<br />
around 10% y-o-y by volume and 14% y-o-y by value.<br />
The current and future forecast <strong>of</strong> non-woven <strong>consumption</strong> in the surgical disposables market is given<br />
below:-<br />
Non-woven usage in surgical<br />
disposables market<br />
<strong>Domestic</strong> usage<br />
2007-08 2012-13<br />
Non-woven fabric Quantity 890 MT 1446 MT<br />
Non-woven fabric Value Rs 32.3 crore Rs 61 crore<br />
Source: <strong>Industry</strong> survey, IMaCS Analysis<br />
In volume terms, the usage <strong>of</strong> non-woven in the surgical disposables industry is expected to grow<br />
from 890 MT in 2007-08 to 1446 MT in 2012-13. The potential market for surgical disposable<br />
industry in 2012-13 is estimated at Rs. 61 crore up from Rs. 32.3 crore in 2007-08 (E). No<br />
inflationary increase has been assumed for the price <strong>of</strong> the material as the prices have fallen over the<br />
last 3 years.<br />
Key manufacturers<br />
The surgical disposables market in India is in its infancy stage. There are very few manufacturers <strong>of</strong><br />
surgical disposable items in India. The imported surgical disposables from China are also available in<br />
the market. The major producers <strong>of</strong> surgical disposables are:-<br />
1. Thea-Tex Healthcare Pvt. Ltd.<br />
2. Mediklin Healthcare Ltd.<br />
3. Magnum Medicare Pvt. Ltd.<br />
4. Sivshree Medittex India Pvt Ltd<br />
5. Surgiwear India<br />
6. Dispoline
a. Production – 60,000 caps, masks and gown per annum<br />
b. Production – 24,000 aprons per annum<br />
The key raw material supplier for surgical disposables in India is Ahlstom Fibre Composites Pvt.<br />
Limited. Ahlstrom has one the largest investments (12000 MT/annum) for SMS Medical Fabrics in<br />
India. The sales <strong>of</strong> Ahlstom have grown by 100% y-o-y. DuPont is another multinational company<br />
which supplies raw material fabric to surgical disposable converters in India.<br />
Imports & Exports <strong>of</strong> surgical disposables<br />
The import figures for surgical disposables are as given below:-<br />
HS Code Description Imports (Quantity) Imports (Value)<br />
2007-08(E) 2007-08(E)<br />
63079090* SURGICAL DRAPES Around 25,000 nos. Rs 0.75 crore<br />
63079090* SURGICAL GOWNS Around 0.1 million nos. Rs 0.5 crore<br />
63079090* SURGICAL MASKS Around 10 million nos. Rs 0.75 crore<br />
63079090* SURGICAL CAPS Around 13 million nos. Rs 1 crore<br />
62101000 SURGICAL SHOE COVERS Around 0.3 million nos. Rs 0.03 crore<br />
Source: DGCIS, IBIS, IMaCS Analysis<br />
In addition to the imports listed above, based on the information from the industry survey, additional<br />
imports <strong>of</strong> converted products is Rs. 18.3 crore which results in total imports for Rs. 21.6. The overall<br />
imports is approximately 450 MT.<br />
China accounts for over 60% <strong>of</strong> the imports <strong>of</strong> surgical disposables <strong>of</strong> India followed by Singapore<br />
with 20-25% share. USA, Germany, Australia, Denmark & UK account for the remaining imports.<br />
The raw material for surgical disposables is sourced under the HS code 5603. The import figures for<br />
raw-material (non-woven) for surgical disposables are as given below:-<br />
HS Code Description Imports Imports<br />
2007-08(E) 2007-08(E)<br />
56031100,<br />
56031200,<br />
56039400<br />
NON-WOVEN FABRIC<br />
(SMS/SPUNMELT) FOR<br />
MEDICAL USE / FACE<br />
MASK MEDIA<br />
Around 100 MT<br />
Rs 1.35 crore<br />
approx.*<br />
Source: IBIS, IMaCS Analysis<br />
* Most <strong>of</strong> the fabric import is for caps, masks, etc and not for drapes. Hence, the<br />
share <strong>of</strong> imports is high in terms <strong>of</strong> volume but low in terms <strong>of</strong> value
In addition to the imports listed above, based on the information based on the information from the<br />
industry survey, additional imports <strong>of</strong> fabrics is Rs. 5.85 crore which results in total fabric imports <strong>of</strong><br />
Rs. 7.2 crore. Around 95% <strong>of</strong> the imports <strong>of</strong> non-woven fabric for surgical disposables are from Saudi<br />
Arabia. The remaining imports are from USA.<br />
India exports disposable non-woven shoe covers to USA as given below:-<br />
HS Code Description Imports Imports<br />
2007-08(E) 2007-08(E)<br />
63079090<br />
DISPOSABLE NON-<br />
WOVEN SHOE COVERS<br />
Around 15<br />
million pieces<br />
Rs 3 crore<br />
approx.<br />
Source: IBIS, IMaCS Analysis<br />
The exports are approximately 60 MT. These exports will grow at a CAGR <strong>of</strong> 9% for the next five<br />
years and reach a size <strong>of</strong> around Rs 4.5 crore in 2012-13<br />
Raw-materials and machineries<br />
The raw material for the medical disposables is PP spunbond non-woven fabric. These products are<br />
made on Taiwanese or Chinese fully automatic machines. The machines are made by companies in<br />
China and Taiwan under the tag <strong>of</strong> non-woven converting machine manufacturers. The leading non-<br />
woven converting machine manufacturers are:<br />
1. NCM Non-woven Converting Machinery Co. Ltd.<br />
2. Chang Hong Machinery Co. Ltd.<br />
3. Dong Guan PNL Non-woven Converting Machinery Co. Ltd<br />
4. BroadFair Non-woven Converting Machinery Co. Ltd.<br />
Quality Control and Standards – There are no Indian standards. The gowns and drapes<br />
manufactured in India are compliant with AAMI PB 70 (Association for the Advancement <strong>of</strong> Medical<br />
Instrumentation) standards. For the mask products - ASTM F2101-01 is used as standard for the<br />
bacteria filtration efficiency. The Delta-P standard is used to set the breathing resistance and ASTM<br />
1862 is used to set the splash resistance.
Surgical Sutures<br />
The surgical suture is used for stitching together skin deformations, open wounds, organs and blood<br />
vessels. The surgical sutures are classified into two categories –<br />
• Absorbable suture - These get dissolved in the body and do not require removal<br />
• Non-absorbable suture - These are sterilised sutures which need to be removed after a<br />
specified time<br />
The type <strong>of</strong> suture used depends upon the location <strong>of</strong> the required surgical intervention. The raw<br />
material for sutures ranges from bovine intestine tissues to Poly glycolic acid (PGA), collagen, mono<br />
filament polyester / polypropylene and multifilament nylon/polypropylene/polyamide.<br />
Product characteristics<br />
The type <strong>of</strong> suture used varies based on the area <strong>of</strong> application and type <strong>of</strong> medical intervention. They<br />
could be either mon<strong>of</strong>ilament, multifilament or braided. Generally, absorbable sutures are used for<br />
sewing internal body organs, while non-absorbable sutures are used for external injuries. However,<br />
absorbable sutures are used in case <strong>of</strong> external injuries as well.<br />
The general characteristics <strong>of</strong> sutures are given below:<br />
• Sterilised (non-toxic)<br />
• Hypoallergenic<br />
• High tensile strength<br />
• High knot security<br />
• Flexible and smooth passage through tissues<br />
• Good pliability<br />
• Minimum tissue reaction<br />
Market dynamics and key growth drivers<br />
The growth <strong>of</strong> medical textile products is tied with the growth <strong>of</strong> the healthcare industry in India. The<br />
healthcare <strong>consumption</strong> in India is expected to grow to $195 billion from current $25 billion (Source:<br />
Moneycontrol, Mckinsey 2007 – The Bird <strong>of</strong> Gold-The rise <strong>of</strong> India’s consumer market). The rural<br />
India is expected to follow the increasing healthcare spend trend <strong>of</strong> urban India.<br />
The key purchase decision makers for surgical sutures are medical institutions and doctors. The<br />
companies invest heavily on promotion <strong>of</strong> their products amongst surgeons, nurses and hospital
administrators to promote the usage and establish trust for the brand amongst these pr<strong>of</strong>essionals.<br />
These relationships translate into product sales going forward.<br />
Consumption norms and the market size<br />
The surgical suture is a 100% <strong>technical</strong> textile material except for the needle portion at one end <strong>of</strong> the<br />
suture. The size <strong>of</strong> the needle and suture depend upon the wound and area <strong>of</strong> application. The surgical<br />
sutures industry is expected to grow at 5% y-o-y.<br />
The current and future forecast <strong>of</strong> surgical suture industry is given below:-<br />
Surgical sutures usage in India 2007-08 2012-13<br />
4 – 4.5<br />
Surgical sutures (Quantity) million<br />
dozens<br />
Rs 325 crore<br />
Surgical sutures (Value)<br />
approx.<br />
Source: <strong>Industry</strong> survey, IMaCS Analysis<br />
5 – 5.5<br />
million<br />
dozens<br />
Rs 415 crore<br />
approx.<br />
The potential market for surgical suture industry in 2012-13 is estimated at Rs. 415 crore up from Rs.<br />
325 crore in 2007-08 (E). No inflationary increase has been assumed for the price <strong>of</strong> the sutures. In<br />
volume terms, the usage <strong>of</strong> surgical suture industry is expected to grow from 4 – 4.5 million dozens in<br />
2007-08 to 5 – 5.5 million dozens in 2012-13.<br />
Key manufacturers<br />
The surgical sutures market in India is dominated by Johnson and Johnson with its flagship Vicryl<br />
brand, which has world market share <strong>of</strong> 60-65% and an India market share <strong>of</strong> approximately 80-85%.<br />
The remaining 15-20% <strong>of</strong> the market share is distributed across various domestic producers including<br />
Centennial Surgical Suture Limited and Futura Surgicare Pvt. Ltd. amongst others.<br />
Manufacturer Year Quantity<br />
(million<br />
dozens)<br />
Value<br />
(Rs crore)<br />
Unit Price<br />
(Rs / dozen)<br />
Installed<br />
capacity<br />
(million dozens)<br />
Johnson and Johnson 2006-07 3.08 236 766 10.53<br />
Centennial Surgical<br />
Suture Ltd.<br />
2006-07 0.48 37 765 0.5<br />
Source: Capitaline<br />
Ethicon, a franchise <strong>of</strong> Johnson & Johnson Medical, India, is the largest manufacturer <strong>of</strong> surgical<br />
sutures with a wide variety <strong>of</strong> suture materials and needle sizes to meet the requirement <strong>of</strong> every<br />
surgical speciality. In India, Ethicon is the largest producer <strong>of</strong> absorbable and non-absorbable surgical<br />
sutures and a market leader in wound closure business. Ethicon has recently introduced Vicryl Plus<br />
which <strong>of</strong>fers protection against bacterial colonization. This is the world’s first Antibacterial suture
Imports & Exports <strong>of</strong> surgical sutures<br />
The import figures for surgical sutures are as given below:-<br />
HS Code Description<br />
54011000,<br />
54026990,<br />
54049090,<br />
54023990,<br />
54049010<br />
30061010<br />
30061010<br />
39089090,<br />
39269099<br />
SURGICAL SUTURES, SURGICAL<br />
SUTURE STRANDS, THREAD FOR<br />
SURGICAL SUTURES<br />
SURGICAL SUTURES, SUTURE<br />
THREADS, ATRAUMATIC NEELDE<br />
& SUTURES<br />
CARDIOVASCULAR SUTURES,<br />
STERNUM SUTURES<br />
SURGICAL SUTURES, SURGICAL<br />
SUTURE STRANDS, THREAD FOR<br />
SURGICAL SUTURES<br />
Imports<br />
(Quantity)<br />
Imports<br />
(Value)<br />
2007-08(E) 2007-08(E)<br />
Around 33 million<br />
meters<br />
Around 1.25<br />
million meters and<br />
2.5 million nos.<br />
Around 1.5 million<br />
meters<br />
Around 1 million<br />
meters<br />
Rs 28 crore<br />
approx<br />
Rs 3 crore<br />
approx<br />
Rs 3.5 crore<br />
approx<br />
Rs 0.85 crore<br />
approx<br />
Source: IBIS, IMaCS Analysis<br />
USA accounts for over 50 - 60% <strong>of</strong> the imports <strong>of</strong> surgical sutures <strong>of</strong> India followed by Korea with<br />
30-40% share and 5 – 10% each from China, Germany and Japan. Marginal imports also take place<br />
from UK, Italy, Singapore, Dominican Republic & Belgium.<br />
The export figures for surgical sutures are as given below:-<br />
HS Code Description<br />
Exports (Quantity) Exports<br />
(Value)<br />
2007-08(E) 2007-08(E)<br />
40151100 SURGICAL SUTURES Around 0.15 million dozens Rs 4 crore<br />
30061010 SURGICAL SUTURES Around 1 million dozens Rs 37 crore<br />
Source: IBIS, IMaCS Analysis<br />
Under the HS code 30X, Bangladesh accounts for around 40 - 50% <strong>of</strong> the exports <strong>of</strong> surgical sutures<br />
from India followed by Russia & Philippines with 15 - 20% shares each. India also exports surgical<br />
sutures to Hungary, Netherlands, Spain, Zambia, Sudan, Uganda, Morocco, Kuwait, Egypt, China,<br />
Thailand, Taiwan, Sri Lanka, Singapore, Malaysia, Indonesia, Maldives, etc.<br />
Under HS code 40X, Afghanistan & Russia account for around 30 - 40% each <strong>of</strong> the Indian exports <strong>of</strong><br />
surgical sutures followed by Sri Lanka & Netherlands with 10 - 15% share each. India also exports<br />
surgical sutures to Canada, Madagascar and Bangladesh.
Exports <strong>of</strong> surgical sutures are expected to reach a size <strong>of</strong> Rs 72.3 crore by the year 2012-13 by<br />
growing at a CAGR <strong>of</strong> 12%.<br />
Raw-materials for surgical suture<br />
The surgical sutures are 100% <strong>technical</strong> textile except for the needle portion. The raw material used<br />
for surgical suture includes bovine intestine tissues, PGA, mon<strong>of</strong>ilament nylon, mon<strong>of</strong>ilament<br />
polyethylene and silk.<br />
Quality Control and Standards – No BIS standard, manufacturers follow USP, European and<br />
American Foods and Drugs Authority (FDA) standards.
Surgical Dressing Material<br />
Surgical dressing material is applied on the wound to expedite the process <strong>of</strong> healing and prevent<br />
further harm due to wound exposure.<br />
The dressing material can be primarily divided as<br />
• Wound care layer and<br />
• Bandage<br />
Bandage holds the wound care layer in place. Wound care products which are adhesive in nature are<br />
also available in the market. The bandage can also be used on standalone basis in case <strong>of</strong> orthopaedic<br />
cases (e.g. crepe bandage). The type <strong>of</strong> dressing used varies based on the type <strong>of</strong> wound and location<br />
<strong>of</strong> the wound.<br />
Typically, the wound care products consist <strong>of</strong>:-<br />
• Absorbent pad<br />
• Non-adhering/dressing<br />
• Adhering pads or adhesive plaster<br />
The wound contact material is available in both woven and non-woven forms.<br />
The bandage products consist <strong>of</strong>:-<br />
• Rolled Bandage<br />
• Gauze bandage<br />
• Elastic/Non-elastic bandage<br />
• Light support bandage<br />
Product characteristics<br />
The materials included under surgical dressings are: Rolled bandages, Crepe bandages, Plaster-<strong>of</strong>-<br />
Paris bandages, Absorbent gauze pack, plaster, absorbent pads and surgical pads.<br />
The raw materials for surgical dressings are cotton fibre, viscose and acrylic. The functional<br />
properties like absorbency are improved for dressing material. Additionally, these products could be<br />
sterilised or non-sterilised. The wound contact layer is either woven medicated layer or non-woven<br />
medicated layer. The wound contact layer is non-adherent and allows new tissue to develop easily.
Non-adherent hypoallergenic, gamma sterile dressing allows easy wound-drainage. It is soothing,<br />
enhances healing in burns, skin grafts, skin loss and lacerated wounds.<br />
The bandages provide support to the dressing material and function as compression material. Cotton<br />
gauze cloth is generally used for holding wound contact layer in place which is tied at the ends or<br />
joints using adhesive tape. Bandages are also made from polyester yarns. The bandages have a basis<br />
weight in the range <strong>of</strong> 55-60 GSM.<br />
Crepe bandages / compression bandages are knitted bandages made from thick woven polyester<br />
fabric which have an elastic behaviour and porous nature for skin breathing. These bandages are used<br />
on limbs to create resting pressure and working pressure for the treatment. The crepe bandages are<br />
manufactured by weaving and warping the yarn and then processed to give properties like stretch<br />
ability. The crepe bandages are available is various sizes like 5, 7.5, 15 centimeter x 3 meter.<br />
Plaster-<strong>of</strong>-Paris (POP) bandages are made <strong>of</strong> cotton gauze <strong>of</strong> leno weave cloth with Plaster-<strong>of</strong>-Paris<br />
impregnated. The leno weave holds the POP material in the fabric. The bandage is dipped in water<br />
and applied on the limb which would graduate into a hard cast once dried. The POP bandages are<br />
available is various sizes like ~10, 15, 20 centimeter x 3 meter.<br />
Dressing pads and absorbent gauze generally have basis weight <strong>of</strong> around 30 GSM. These pads and<br />
absorbents are available across various sizes.<br />
Cohesive bandages stick to themselves and not to the user’s skin. Hence, they are suited for skin<br />
protection applications. Adhesive plaster (medicated or not medicated) is available in various lengths<br />
and shapes.<br />
The wound dressing material should be sterile, breathable and should provide a moist healing<br />
environment. The healing environment then reduces the risk <strong>of</strong> infection and helps the wound heal<br />
more quickly.<br />
All the surgical dressing items are expected to be ISI, USP or BP compliant.<br />
Key manufacturers<br />
The industry is primarily unorganised with units in various states / areas <strong>of</strong> India including Tamil<br />
Nadu, Mumbai, Uttar Pradesh and Ichalkaranji, amongst others. According to the Ministry <strong>of</strong> Health<br />
and Family Welfare report, there are around 638 licensed units manufacturing surgical dressing<br />
material. The organised producers <strong>of</strong> the surgical dressings are as follows:-
• Johnson and Johnson India<br />
• Lavino Kapoor – Absorbent cotton – 100% EOU<br />
• Dr. Sabharwal Laboratories<br />
• Ramanathan Surgicals Private Limited<br />
• KOB textile – Dressing Material - 100% EOU (Export Oriented Unit)<br />
• Ramaraju Surgical Cotton Limited<br />
• Shanti Surgicals<br />
• Jajoo Surgicals Private Limited<br />
The production figures for some <strong>of</strong> the key manufacturers are given below:-<br />
1. Dr. Sabharwal Laboratories<br />
2. Datt Mediproducts<br />
a. Adhesive tapes – Production – 815139 pieces; Sales – 834445 pieces ;<br />
Sales (value) – 1.7 Crore; Capacity – 5.46 lakh sq. meter<br />
b. Elastic adhesive bandage – Sales – 23996 nos.; Sales (value) – 0.12 Crore<br />
c. Surgical tape – Production – 129273 pieces<br />
a. Surgical tape – Production – 1 lakh dozens; Capacity – 1.55 lakh dozens<br />
b. Gauze swab - Production – 180 million nos.; Capacity – 250 million nos.<br />
c. Cotton crepe bandage – Production – 125 lakh nos.; Capacity – 180 lakh<br />
nos.<br />
3. Ramanathan Surgicals Private Limited – Production capacity: 1 million meters/annum<br />
4. Ramaraju Surgical Cotton Limited – Bandages Volume: 130000 kilograms/annum;<br />
Value: 3.5 Crore/annum<br />
Market for surgical dressing material and future forecast<br />
The demand for surgical dressing material is primarily driven by boom in the healthcare sector and<br />
increase in hospital beds in the country. In addition to the domestic market, Indian dressing materials<br />
are also exported to several countries. The industry is primarily unorganised with units in across<br />
Tamil Nadu, Mumbai, Uttar Pradesh, Ichalkaranji, amongst others. According to the ministry <strong>of</strong><br />
health and family welfare report, there are around 638 licensed units manufacturing surgical dressing<br />
material. The market for dressing material is primarily institutional with a share <strong>of</strong> around 60% <strong>of</strong><br />
sales and the remainder is retail. From the manufacturers perspective there is no difference between<br />
the retail and institutional sales. However margins are attached along the distribution chain.<br />
Usage norms per bed <strong>of</strong> surgical dressings (OPD adjusted)
Rolled bandage<br />
Crepe bandage<br />
POP bandage<br />
Around 100 units <strong>of</strong> 14<br />
cm * 6 m (or equivalent)<br />
Around 15 units <strong>of</strong> 10cm<br />
* 4 m (or equivalent)<br />
Around 10 units <strong>of</strong> 10<br />
cm width (or equivalent)<br />
Elastic adhesive bandage Around 1.5 units<br />
Band-aid / adhesive tape Around 20 units<br />
Absorbent cotton wool Around 10 units <strong>of</strong> 500 g<br />
Absorbent gauze Around 20 units<br />
Surgical pad Around 2.5 units<br />
Source: <strong>Industry</strong> survey, IMaCS Analysis<br />
The surgical dressings industry has been growing at 4-5% y-o-y.<br />
The current and future forecast <strong>of</strong> surgical dressing material industry is given below:-<br />
Surgical dressings usage in<br />
India<br />
Surgical dressings (bandages)<br />
Surgical dressings (wound<br />
care products)<br />
2007-08 2012-13<br />
Rs 450 crore<br />
approx.<br />
Rs 375 crore<br />
approx.<br />
Surgical dressings (Total) Rs 825 crore<br />
Source: <strong>Industry</strong> survey, IMaCS Analysis<br />
Rs 500 crore<br />
approx.<br />
Rs 450 crore<br />
approx.<br />
Rs 1,000<br />
crore<br />
The potential market for surgical dressings in 2012-13 is estimated at Rs. 1,000 crore up from Rs 825<br />
crore in 2007-08 (E). No inflationary increase has been assumed for the price <strong>of</strong> surgical dressings.<br />
Bandages constitute around 55% <strong>of</strong> the market whereas other wound care products account for the<br />
remaining 45% share.<br />
Imports and Exports <strong>of</strong> surgical dressing material<br />
The estimated import figures for surgical dressing material are as given below:-<br />
HS Code Description<br />
Imports<br />
(Value)<br />
2007-08(E)
30051010, 30051020, 30049029,<br />
30051090, 30059010, 30059030,<br />
30059040, 30059060, 30059090,<br />
30065000, 30069040, 30069060<br />
Surgical Dressing<br />
material<br />
Rs 31 crore<br />
approx.<br />
Source: IBIS, IMaCS Analysis<br />
The imports arrive primarily from USA, China, Korea, Singapore and Hong Kong.<br />
The estimated export figures for surgical dressing material are as given below:-<br />
HS Code Description<br />
30039015, 30049011,<br />
30049099, 30049079,<br />
30049099, 30051010,<br />
30051090, 30059040,<br />
30059070, 30059090,<br />
58031020, 58039090,<br />
58109900<br />
Surgical Dressing<br />
material<br />
Exports<br />
(Value)<br />
2007-08(E)<br />
Source: IBIS, IMaCS Analysis<br />
Rs 93 crore<br />
approx.<br />
The products are primarily exported to the following countries UK, Netherlands, South Africa,<br />
Maldives, USA, Belgium, UAE, China and many others. These exports are expected to reach a level<br />
<strong>of</strong> Rs 150 crore by 2012-13 growing at 10% year on year.<br />
Quality Control and Standards – The products require approval for usage by the medical authority.<br />
For handloom cotton bandages, the applicable standard is IS863 and for cotton gauze absorbents, the<br />
applicable standard is IS758. Several manufacturers also have ISI mark and ISO certification for their<br />
products and units respectively. All the surgical dressing items are expected to be ISI, United States<br />
Pharmacopoeia (USP) or British Pharmacopoeia (BP) compliant.
Contact Lenses<br />
The contact lenses are typically used to correct vision, although some people wear colored contact<br />
lens to enhance or change their eye color. The contact lenses can be classified based on type <strong>of</strong><br />
material, replacement cycle, wear schedule and special applications:-<br />
• Material types (s<strong>of</strong>t, hard and gas-permeable),<br />
• Replacement schedule (one year, daily, fortnightly, monthly and quarterly),<br />
• Wear schedule (Daily wear and extended wear),<br />
• Special types (torics for astigmatism, UV-blocking contacts, bifocals etc).<br />
S<strong>of</strong>t Contact Lenses are made from a water absorbing material called HEMA (Hydroxy Ethyl Metha<br />
Acrylate) and are very s<strong>of</strong>t to handle and comfortable on the eyes. Within the Spherical category are<br />
the conventional and disposable s<strong>of</strong>t lenses. The first comprises a single pair that can be worn for a<br />
period <strong>of</strong> one year on a daily basis during waking hours. Disposables are the most hygienic option as<br />
they are replaced after a particular period —daily, fortnightly, monthly or quarterly.<br />
Hard contact lenses are made <strong>of</strong> some variant <strong>of</strong> polymethyl methacrylate (PMMA) and are obsolete.<br />
RGP lenses are semi-rigid lenses made usually from silicones which allow oxygen through to the eye.<br />
Toric s<strong>of</strong>t lenses are used in cases <strong>of</strong> high cylindrical power or astigmatism. A comfortable option<br />
over semi-s<strong>of</strong>t lenses, it is available as both conventional and disposable. Bifocal contact lenses are<br />
prescribed for those who prefer contact lens correction for Presbyopia or difficulty in near vision.<br />
These are currently available only in disposable option. Cosmetic contact lenses are available in<br />
different colours and tints, in both power and Plano, with conventional and disposable options. These<br />
are principally worn to enhance looks.<br />
Contact lens market in India is dominated by s<strong>of</strong>t contact lenses. The market for disposable lenses is<br />
growing at a higher rate as they are more hygienic and require lesser maintenance.<br />
Market dynamics and key growth drivers <strong>of</strong> contact lens market in India<br />
The main competition <strong>of</strong> contact lens in India is from the spectacles. Fashionable frames and<br />
spectacles have hindered the contact lens category from growing in India. The penetration <strong>of</strong> contact<br />
lenses in the category <strong>of</strong> people using vision care products is very low as compared with developed<br />
countries where contact lenses are available as an OTC product. This is account <strong>of</strong> the higher cost<br />
compared to frames and maintenance issues. Laser corrective procedure does not pose as a challenge<br />
to contact lenses as they cater to a niche audience.
The market penetration <strong>of</strong> contact lenses in India is extremely low (only 5 per cent in SECs A and B<br />
<strong>of</strong> the top six metros who need vision correction). In comparison, the penetration is 22% in Singapore,<br />
25% in Hong Kong and 30% in the US (source: JJVC).<br />
Not too many Indian customers are willing to spend on contact lens because <strong>of</strong> the perception that<br />
contact lenses provide cosmetic appeal, but the price-value equation does not match. In reality, a good<br />
pair <strong>of</strong> spectacles frames costs at least Rs 1,500. The relative price for contact lens has dropped in the<br />
past decade. The disposable and semi-s<strong>of</strong>t lens costs between Rs 900 and Rs 8,000 for one year usage.<br />
Also, there are category-related issues. It is far easier to wear and take care <strong>of</strong> spectacles than contact<br />
lens. Further, most potential consumers have the fear <strong>of</strong> inserting a foreign object in the eye.<br />
Over the years, the age pr<strong>of</strong>ile <strong>of</strong> contact lens users has come down. Currently, the average user tries<br />
on contact lens for the first time at around 15 years. Around three years ago, a first-time buyer <strong>of</strong><br />
contact lens was a little over 20 years. In addition, the BPO generation youth for whom appearance is<br />
critical is expected to lead the growth <strong>of</strong> contact lens in India.<br />
Market penetration and size<br />
It is estimated that nearly 30% per cent <strong>of</strong> the population in India requires vision correction. Though<br />
about 30 crore people need glasses, only about 9-10 crore people wear them. The market is around 3<br />
crore pieces per annum. In value terms, the total eyewear market in India is over Rs 1,800 crore and is<br />
growing at around 15-20 per cent per year. Of this, only about 10 per cent is in the organised segment.<br />
Contact lenses are slowly making inroads in the spectacles market in India - from 1.5 lakh users in the<br />
mid-1990s, there are now over 10 lakh contact lens users in India. The market penetration <strong>of</strong> contact<br />
lenses in India is extremely low (only 5 per cent in SECs A and B <strong>of</strong> the top six metros who need<br />
vision correction). Nearly 8% <strong>of</strong> the Indian population or one third <strong>of</strong> Indian urban population belongs<br />
to SEC A & B categories. Contact lenses are usually used with a back-up <strong>of</strong> spectacles and that is how<br />
the market is estimated. The industry is expected to grow at 20% (slightly higher than the growth <strong>of</strong><br />
overall eyewear market) on account <strong>of</strong> changing lifestyle, higher purchasing power and favourable<br />
demography.<br />
Contact lens usage in India<br />
Population requiring vision correction Around 30 crore<br />
Eyewear market (total) Around 9 crore users
Eyewear market (per annum) Around 3 crore pieces per annum<br />
Eyewear users in SECs A & B Around 2 - 2.5 crore users<br />
Penetration <strong>of</strong> contact lens in SEC A &<br />
B market<br />
5%<br />
Contact lens market (per annum) Around 12 lakh users (1-1.2 million)<br />
Expected growth rate 20% (slightly higher than growth-rate<br />
<strong>of</strong> eye-wear market in India)<br />
Source: <strong>Industry</strong> survey, Press reports, IMaCS Analysis<br />
Almost 70% <strong>of</strong> contact lens users are using yearly disposable lenses while the remaining users rely on<br />
monthly disposable lenses. The yearly contact lens costs Rs 1200 per pair on an average (though they<br />
range from Rs 900 to Rs 9000 per pair). The monthly disposable lenses cost Rs 90 per lens (i.e. Rs<br />
180 for a pair).<br />
Little shift towards monthly disposable contact lens is expected in the next 5 years from 30% in 2007-<br />
08 to 40% in 2012-13. The prices <strong>of</strong> lens are not expected to drop further and are expected to remain<br />
stable. No price increase has been assumed for market sizing.<br />
Hence, the current and future forecast <strong>of</strong> contact lens usage in India is given below:-<br />
Contact lens usage in India 2007-08 2012-13<br />
Contact lens users (million) 1.2 2.99<br />
Contact lens pieces (pairs)<br />
(million)*<br />
5.2 16.1<br />
Contact lens value Rs 179 crore Rs 473 crore<br />
Source: <strong>Industry</strong> survey, IMaCS Analysis<br />
* Contact lens pieces are high because <strong>of</strong> fair proportion <strong>of</strong> monthly disposable lens usage<br />
The potential market for contact lens in 2012-13 is estimated at Rs. 473 crore up from Rs 179 crore in<br />
2007-08 (E). No inflationary increase has been assumed for the price <strong>of</strong> contact lens. In volume terms,<br />
the number <strong>of</strong> contact lens users is expected to grow from 1.2 million in 2007-08 to 2.99 million in<br />
2012-13. On account <strong>of</strong> marginal shift from yearly contact lens to monthly disposable lens, the<br />
number <strong>of</strong> contact lens pieces (pairs) is expected to increase from 5.2 million to 16.1 million over the<br />
same period.<br />
In the contact lens market in India, Bausch and Lomb is the market leader with 70 per cent market<br />
share, followed by Johnson & Johnson Vision Care (Acuvue brand), Ciba Vision (a Novartis product)<br />
and Silklens. The estimated import figures for Contact Lenses are as given below:-<br />
HS Code Description<br />
Imports<br />
(pairs)<br />
Imports<br />
(in Rs crore)
2007-08(E) 2007-08(E)<br />
CONTACT Approx. 5 - 6<br />
90013000<br />
~ 30<br />
LENSES*<br />
million<br />
Source: IBIS, DGCIS, IMaCS Analysis<br />
* Contact Lenses are also imported under the HS codes – 90029000, though<br />
rarely<br />
USA accounts for 40-50% <strong>of</strong> the Indian imports <strong>of</strong> contact lenses followed by Ireland which accounts<br />
for 25-30% <strong>of</strong> the imports and Singapore which accounts for around 10% imports. Canada, Korea,<br />
Taiwan, UK and Malaysia are the other key source nations <strong>of</strong> contact lenses in India.<br />
Bausch & Lomb imports multifocal and toric lenses from USA & Brazil from its parent company.<br />
They also import blank lenses (lenses with out power) and moulds.<br />
The estimated export figures <strong>of</strong> contact lens are as given below:-<br />
HS Code Description<br />
Exports<br />
(pairs)<br />
Exports<br />
(in Rs crore)<br />
2007-08(E) 2007-08(E)<br />
CONTACT Approx. 0.5 - 1<br />
90013000<br />
~ 15-20<br />
LENSES*<br />
million<br />
Source: IBIS, DGCIS, IMaCS Analysis<br />
* Apart from these HS codes, Contact Lenses are also exported in nominal<br />
amounts under the HS codes – 90029000, 90031100, 90021900, 90014090 &<br />
90015000 (included in Exports value above)<br />
USA, Canada & UK are the largest export destinations <strong>of</strong> contact lenses from India accounting for 70-<br />
80% <strong>of</strong> exports from India. India also exports contact lenses to Germany, Netherlands, Syria, Kenya,<br />
Middle-east and neighboring countries like Sri Lanka & Nepal.<br />
Raw materials<br />
S<strong>of</strong>t Contact Lenses are made from a water absorbing polymer called HEMA (Hydroxy Ethyl Metha<br />
Acrylate). It has hydrophilic qualities, i.e., it can soak up water and still retain its shape and optic<br />
functions. Contact lenses may be produced by cutting a blank on a lathe or by molding process.<br />
Quality Control and Standards<br />
There are no standards for contact lenses in India.<br />
Key machinery manufacturers/suppliers in India<br />
None<br />
Artificial Heart Valves<br />
Artificial heart valves are implanted in the heart <strong>of</strong> the patients who need treatment for valve related<br />
diseases. The natural heart valve needs a replacement when two or more valves stop functioning<br />
properly. Generally an open heart surgery is performed to replace the valve.
There are two types <strong>of</strong> artificial heart valves –<br />
• Mechanical heart valve and<br />
• Tissue heart valve<br />
The mechanical heart valves last almost indefinitely, however, they need continuous treatment with<br />
anticoagulants. The tissue valves on the other side do not need anticoagulants, however, they have<br />
shorter life span. Typically the tissue valves command 10% or less market in the heart valves market.<br />
Product characteristics<br />
The heart valve has three parts, a metallic housing, a disc or ball which functions as occlude and a<br />
sewing ring made <strong>of</strong> synthetic material. The functional requirement <strong>of</strong> heart valves are as follows:<br />
1. Minimum regurgitation<br />
2. Minimum trans-vascular pressure gradient<br />
3. Non-thrombogenic<br />
4. Low wear/tear<br />
5. Minimal leakage<br />
6. Appropriate valve orifice to anatomical orifice ratio<br />
The mechanical heart valve consists <strong>of</strong> Ultra high molecular weight-polyethylene (UHMW-PE) disc,<br />
Low density polyethylene plastic with knitted polyester sewing ring and a metallic housing. The<br />
Sewing Ring is fabricated from extensively implant tested, 100% polyester material. The Sewing Ring<br />
fabric is warp - knitted in a specific pattern using texturized yarn with superb tissue ingrowth and long<br />
term blood compatibility. The design and fabrication <strong>of</strong> the sewing ring gives a firm and secure<br />
seating on the frame and also permits rotation in the ring for proper orientation after suturing in place.<br />
Market size <strong>of</strong> heart valve and future forecast<br />
The heart valve market in India is approximately Rs. 74 crore. The only producer in India is TTK<br />
Healthcare. The excess demand is met through imports from Edwards Life Sciences, St. Judes Inc.,<br />
and Meditronics. TTK Healthcare also exports a small quantity <strong>of</strong> production (300 valves) to<br />
neighbouring countries. TTK Healthcare has been experiencing a growth <strong>of</strong> around 30% y-o-y for<br />
heart valves. Hence, on a conservative side, we have assumed a growth rate <strong>of</strong> around 20% for the<br />
domestic usage.
The <strong>technical</strong> textile in the heart valve is knitted polyester fabric called sewing ring which is around<br />
1% by value <strong>of</strong> the heart valve.<br />
The current and future forecast <strong>of</strong> heart valves <strong>consumption</strong> is given below:-<br />
Heart valves<br />
<strong>Domestic</strong> usage<br />
2007-08 2012-13<br />
Heart-valves (Quantity) 27,200 nos. 67,500 nos.<br />
Heart-valves value Rs 70 crore Rs 175 crore<br />
Fabric Value Rs 0.7 crore Rs 1.75 crore<br />
Source: <strong>Industry</strong> survey, IMaCS Analysis<br />
The potential market for heart valve industry in 2012-13 is estimated at Rs. 175 crore up from Rs.70<br />
crore in 2007-08 (E). In volume terms, the heart valve industry is expected to grow from 27,100 nos.<br />
in 2007-08 to 67,500 nos. in 2012-13. No inflationary increase has been assumed for the price <strong>of</strong> these<br />
products as the prices have fallen over the years. The value <strong>of</strong> <strong>technical</strong> textile component <strong>of</strong> heart<br />
valves is expected to increase from Rs 0.7 crore in 2007-08 to Rs 1.75 crore in 2012-13.<br />
Key manufacturers <strong>of</strong> heart valve<br />
TTK Healthcare in collaboration with Sri Chitra Tirunal is the only domestic manufacturer. TTK<br />
healthcare had annual sales <strong>of</strong> around 7,500 valves with around 300 as exports in 2007. TTK has<br />
capacity to produce 20,000 heart valves in a year.<br />
Manufacturer Year Product Production Installed<br />
quantity capacity<br />
TTK Healthcare 2007-08 Heart-valves 7,548 nos. 20,000 nos.<br />
Source: Annual report<br />
Imports and Exports <strong>of</strong> heart valve<br />
The estimated import figures for heart valves are as given below:-<br />
HS Code Description<br />
90181990<br />
90183990<br />
90212900<br />
90213900<br />
Heart Valves<br />
Imports Imports<br />
(Quantity) (Value)<br />
2007-08(E) 2007-08(E)<br />
Around 20,000<br />
nos.<br />
Rs 53 crore<br />
Source: IBIS, IMaCS Analysis
The imports <strong>of</strong> heart valves arrive primarily from USA, Brazil, Italy and Netherlands. The imports<br />
from USA have a share <strong>of</strong> around 40% followed by Brazil and Italy. The exports are negligible as<br />
compared to imports. TTK Healthcare exports around 300 valves to neighbouring countries annually.<br />
Raw-materials and machinery<br />
The mechanical heart valve consists <strong>of</strong> Ultra high molecular weight-polyethylene (UHMW-PE) disc,<br />
Low density polyethylene plastic with knitted polyester sewing ring and a metallic housing. Heart<br />
valves are manufactured using warp-knitting process on Double Raschel Warp knitting machines.
Artificial Vascular Grafts<br />
Vascular diseases are characterised by variations to the geometry and structure <strong>of</strong> the walls <strong>of</strong> the<br />
blood vessels. Variations in the mechanical characteristics <strong>of</strong> the vessels result in multiple<br />
complications like Thrombosis, Aneurysm and Arteriosclerosis.<br />
Product characteristics<br />
In order to function effectively, the grafts need to have special characteristics like – non-thrombogenic<br />
surface, elasticity and compliance, long-term tensile strength, bio-compatability, durability, bacteria<br />
resistance, etc. The type <strong>of</strong> fabric used for prostheses is woven fabric or knitted fabric. The knitted<br />
fabric is easy to suture and well suited for aortic replacement however not for large diameter vessels.<br />
The knitted fabric is porous and needs to be clotted with patient’s blood before usage. On the other<br />
hand, the woven fabric has the strongest construction but is difficult to suture. Most textile grafts for<br />
large and medium artery replacement are made <strong>of</strong> either PET (polyethylene terephthalate, commercial<br />
name Dacron) or PTFE (polytetrafluoro ethylene, commercial name Teflon).<br />
Market size <strong>of</strong> vascular graft and future forecast<br />
The vascular graft market in India is quite small and the requirement is primarily met through imports.<br />
The current usage <strong>of</strong> grafts is annually around 5,000 units. The price range varies from as low as Rs.<br />
2000 to Rs. 20,000. The average price is around Rs 9,000 per graft. The industry is expected to grow<br />
at around 10% y-o-y.<br />
The vascular graft is a 100% <strong>technical</strong> textile product produced by warp knitting process.<br />
The current and future forecast <strong>of</strong> vascular grafts <strong>consumption</strong> is given below:-<br />
Vascular grafts<br />
<strong>Domestic</strong> usage<br />
2007-08 2012-13<br />
Vascular grafts (Quantity) 5,000 nos. 8,000 nos.<br />
Vascular grafts value Rs 4.5 crore Rs 7.2 crore<br />
Source: <strong>Industry</strong> survey, IMaCS Analysis<br />
The potential market for vascular graft industry in 2012-13 is estimated at Rs. 7.2 crore up from Rs.<br />
4.5 crore in 2007-08 (E). In volume terms, the vascular graft industry is expected to grow from 5,000<br />
nos. in 2007-08 to 8,000 nos. in 2012-13. No inflationary increase has been assumed for the price <strong>of</strong><br />
these products as the prices have fallen over the years.
Key manufacturers<br />
TTK Healthcare in collaboration with Sri Chitra Tirunal is the pioneer <strong>of</strong> vascular grafts in India.<br />
However, products are still under clinical trials. TTK Healthcare is testing indigenously developed<br />
grafts with South Indian Textile Research Association (SITRA). The current demand is met through<br />
imports.<br />
Imports and Exports <strong>of</strong> vascular graft<br />
The estimated import figures for vascular grafts are as given below:-<br />
HS Code Description<br />
90181990<br />
90183990<br />
90189099<br />
Imports Imports<br />
(Quantity) (Value)<br />
2007-08(E) 2007-08(E)<br />
Vascular Grafts 5,000 nos. Rs 4.5 crore<br />
Source: IBIS, IMaCS Analysis<br />
The vascular grafts are primarily imported. 67% <strong>of</strong> the imports come from USA and the other nations<br />
which export include UK, Germany, France, Singapore, Georgia, Denmark and Australia.<br />
Raw-materials and machinery<br />
Vascular grafts are manufactured using warp-knitting process on Double Raschel Warp knitting<br />
machines. Most textile grafts for large and medium artery replacement are made <strong>of</strong> either PET<br />
(polyethylene terephthalate, commercial name Dacron) or PTFE (polytetrafluoro ethylene,<br />
commercial name Teflon). These grafts can also be woven, though, rarely.
Artificial Tendon (Mesh)<br />
Artificial Tendons or meshes are used in hernia repair and abdominal wall replacement, where<br />
mechanical strength and fixation are very important. The long term function <strong>of</strong> the mesh is optimised<br />
by adjusting the porosity and the texture <strong>of</strong> the mesh.<br />
Product characteristics<br />
The mesh could either be woven or knitted based on the requirement <strong>of</strong> strength. Polypropylene,<br />
Polyester mesh is primarily used in hernia repair as it is resistant to infections. GOR-TEX is also used<br />
for making mesh for hernia repair. The size varies from 2’’x4’’ to 10’’x14’’.<br />
Market size <strong>of</strong> artificial tendon and future forecast<br />
Primarily, the requirement <strong>of</strong> meshes is met through imports. The major domestic producer is TTK<br />
Healthcare with production <strong>of</strong> around 1 lakh square inch annually. TTK Healthcare has an installed<br />
capacity <strong>of</strong> 5 lakh square inches.<br />
The artificial tendon is a 100% <strong>technical</strong> textile product produced by warp knitting process or<br />
weaving process.<br />
The current and future forecast <strong>of</strong> artificial tendons <strong>consumption</strong> is given below:-<br />
Artificial tendons<br />
<strong>Domestic</strong> usage<br />
Artificial tendons (Quantity)<br />
2007-08 2012-13<br />
1 – 1.5 lakh<br />
nos.<br />
Around 2<br />
lakh nos.<br />
Artificial tendons value Rs 9 crore Rs 15 crore<br />
Source: <strong>Industry</strong> survey, IMaCS Analysis<br />
The potential market for artificial tendon industry in 2012-13 is estimated at Rs. 15 crore up from Rs.<br />
9 crore in 2007-08 (E). In volume terms, the artificial tendon industry is expected to grow from 1 –<br />
1.5 lakh nos. approx. (estimated) in 2007-08 to around 2 lakh nos. in 2012-13. No inflationary<br />
increase has been assumed for the price <strong>of</strong> these products as the prices have fallen over the years.<br />
Key manufacturers
TTK Healthcare in collaboration with Sri Chitra Tirunal is pioneer <strong>of</strong> artificial tendon in India. TTK<br />
Healthcare produces around 1 lakh square inch artificial tendons / hernia repair mesh annually and has<br />
an installed capacity <strong>of</strong> 5 lakh square inch.<br />
Manufacturer Year Product Production Installed<br />
quantity capacity<br />
TTK Healthcare 2007-08<br />
Hernia repair<br />
mesh<br />
7,397 nos. Or<br />
Around 1 lakh sq.<br />
inch<br />
5 lakh sq. inch<br />
Source: Annual report<br />
Imports and Exports <strong>of</strong> artificial tendon<br />
The estimated import figures for artificial tendon/mesh are as given below:-<br />
HS Code Description<br />
90183990<br />
Artificial tendon /<br />
Mesh / Hernia<br />
repair mesh<br />
Imports Imports<br />
(Quantity) (Value)<br />
2007-08(E) 2007-08(E)<br />
1 – 1.5 lakh<br />
nos.*<br />
Rs 8 – 9 crore<br />
Source: IBIS, IMaCS Analysis<br />
* Estimated<br />
The artificial tendons are primarily imported. Over 50% <strong>of</strong> the imports are from USA followed by<br />
UK, Germany, France, Singapore, Denmark and Hong Kong.<br />
Raw-materials and machinery<br />
Meshes for hernia and other medical requirements are manufactured using warp-knitting process on<br />
Double Raschel Warp knitting machines. Most textile grafts for large and medium artery replacement<br />
are made <strong>of</strong> either PET (polyethylene terephthalate, commercial name Dacron) or PTFE<br />
(polytetrafluoro ethylene, commercial name Teflon). These grafts can also be woven, though, rarely.
Artificial Kidney / Dialysers<br />
Kidney serves the filtering mechanism <strong>of</strong> the blood. The kidney has a mechanical substitute in kidney<br />
dialysis machine. The kidney dialysis machine is outside the body and purifies the blood using a filter<br />
called the haemodialysor. The haemodialysor is made primarily <strong>of</strong> polysulphone and polyacetate.<br />
The main element in a dialyser is a semipermeable membrane through which small molecules can<br />
pass by diffusion. Dialysers are encountered in medical work in renal dialysis where unwanted small<br />
molecules (e.g. urea) and water can be removed from the body. Haemodialysers (sometimes called<br />
artificial kidneys) take blood from the body and pass it along one side <strong>of</strong> the dialysing membrane so<br />
that unwanted small molecules may diffuse into a special dialysing fluid passing along the other side.<br />
Small molecules which need not be removed are included in the dialysate so that there is equal<br />
diffusion <strong>of</strong> these molecules in each direction.<br />
Product characteristics<br />
The primary function <strong>of</strong> the artificial kidney is to purify the blood. The filtration medium used is<br />
hollow viscose or hollow polyester fibre. The typical characteristics <strong>of</strong> the fabric are:<br />
• Low linting,<br />
• High durability,<br />
• Good capillary action,<br />
• Good absorbency,<br />
• Biodegradability and<br />
• Inert behaviour<br />
Market for artificial kidney and future forecast<br />
The average price <strong>of</strong> artificial kidneys or dialysers is around <strong>of</strong> Rs. 300 per unit. The haemodialysor<br />
equipment is primarily imported into India and it has an institutional market. The dialysers and other<br />
spare parts are also 100% imported.<br />
The artificial kidney membrane or dialysers are 100% <strong>technical</strong> textile products made primarily <strong>of</strong><br />
polysulphone and polyacetate.<br />
The current and future forecast <strong>of</strong> artificial kidney fabric <strong>consumption</strong> is given below:-
Artificial kidneys<br />
<strong>Domestic</strong> usage<br />
Artificial kidneys (Quantity)<br />
2007-08 2012-13<br />
0.8 million<br />
nos.<br />
1.3 million<br />
nos.<br />
Artificial kidneys (Value) Rs 25 crore Rs 40 crore<br />
Source: <strong>Industry</strong> survey, IMaCS Analysis<br />
The potential market for artificial kidney industry in 2012-13 is estimated at Rs. 40 crore up from Rs.<br />
25 crore in 2007-08 (E). In volume terms, the artificial kidney industry is expected to grow from 0.8<br />
million nos. in 2007-08 to around 1.3 million nos. in 2012-13. No inflationary increase has been<br />
assumed for the price <strong>of</strong> these products.<br />
Key manufacturers<br />
There are no manufacturers manufacturing the fabric for artificial kidneys in India.<br />
Imports and Exports <strong>of</strong> Artificial kidney fabric<br />
The estimated import figures for artificial kidney are as given below:-<br />
HS Code Description<br />
90189031,<br />
90189099,<br />
90181990<br />
DIALYZERS FOR<br />
HAEMODIALYSORS<br />
Imports Imports<br />
(Quantity) (Value)<br />
2007-08(E) 2007-08(E)<br />
0.8 million<br />
nos.<br />
Rs 25 crore<br />
Source: IBIS, IMaCS Analysis<br />
The artificial kidneys are primarily imported from Germany and Japan (35-40% share each) followed<br />
by around Egypt with 20-25% share and Thailand with less than 5% share.<br />
Quality Control and Standards – The product is based on international standards.
Artificial Joints<br />
The orthopaedic joints are used for patients suffering from arthritis and accidental damage <strong>of</strong> joints.<br />
The joints are made such that they are compatible with the human body.<br />
Product characteristics<br />
The artificial joints are primarily made <strong>of</strong> Titanium, Stainless Steel and Chromium Cobalt, materials<br />
which exhibit compatibility with the human body. The <strong>technical</strong> textile component in joints is Ultra<br />
High Molecular Weight High Density Polyethylene (UHMWHDPE) material.<br />
Market for artificial joints and future forecast<br />
The approximate market for joints in India is around Rs.4.5 crore. The market is for high end<br />
prostheses which are imported and some are manufactured in India. In India around 20,000 to 25,000<br />
joint replacements happen which range from very minor to major implants.<br />
The UHMWHDPE is a <strong>technical</strong> textile product which varies based on the product or type <strong>of</strong> joint<br />
replacement.<br />
The current and future forecast <strong>of</strong> artificial joints <strong>consumption</strong> is given below:-<br />
Artificial joints<br />
<strong>Domestic</strong> usage<br />
Artificial joints (Quantity)<br />
Artificial joints (Value)<br />
2007-08 2012-13<br />
Around 3,500<br />
to 5,000 nos.<br />
Around 7,000<br />
to 10,000<br />
nos.<br />
Rs 10 crore<br />
approx.<br />
Rs 5 crore<br />
approx.<br />
Source: <strong>Industry</strong> survey, IMaCS Analysis<br />
The potential market for artificial joint industry in 2012-13 is estimated at Rs. 10 crore up from Rs. 5<br />
crore in 2007-08 (E). The growth the industry is assumed to be 15% based on the industry survey.<br />
Imports and Exports <strong>of</strong> artificial joints<br />
The estimated import figures for artificial joints are as given below:-
HS Code Description<br />
90189099, 90211000,<br />
90213100, 90189031<br />
ARTIFICIAL JOINTS,<br />
KNEE SHAPED<br />
COMPONENTS FOR<br />
ARTIFICIAL LIMBS,<br />
KNEE PROSTHESIS<br />
HEADS<br />
Imports Imports<br />
(Quantity) (Value)<br />
2007-08(E) 2007-08(E)<br />
Around 3500<br />
to 5000 nos.<br />
Rs 5 crore<br />
approx.<br />
Source: IBIS, IMaCS Analysis<br />
The artificial joints are primarily imported and around ~80% <strong>of</strong> the imports come from U. K. The<br />
remainder is supplied by USA, Germany, Turkey, Ireland and Egypt. The exports primarily go to<br />
Turkey which accounts for nearly 45% <strong>of</strong> exports followed by Egypt and Sri Lanka.<br />
The <strong>technical</strong> <strong>textiles</strong> based artificial joints are not exported from India.<br />
Quality Control and Standards – The specifications for joints is given in IS: 5810
Artificial Ligaments<br />
An artificial ligament is medical device for joining ends <strong>of</strong> two bones. The artificial ligaments are<br />
made from man-made fibres like polyester. The usage <strong>of</strong> the ligament varies based on type <strong>of</strong><br />
operation. The artificial ligaments are generally subject to lot <strong>of</strong> wear and tear. They also carry a risk<br />
<strong>of</strong> septic arthritis.<br />
Product characteristics<br />
Ligament is a multilayered or tubular woven structure having intra-articular region, at least one bend<br />
region and end regions. Each region is woven so as to possess the required flexibility and strength.<br />
Polyethylene Teraphthalate (PET) is primarily used for manufacturing artificial ligaments. The<br />
artificial ligament must be bio-compatible with contact blood and tissue and should have good<br />
bonding strength.<br />
Market for artificial ligaments and future forecast<br />
The artificial ligaments market in India is small and primarily artificial ligaments are imported. The<br />
ligaments are made <strong>of</strong> polyester which is the <strong>technical</strong> textile component. The current and future<br />
forecast <strong>of</strong> artificial joints <strong>consumption</strong> is given below:-<br />
Artificial ligaments<br />
<strong>Domestic</strong> usage<br />
2007-08 2012-13<br />
Artificial ligaments (Quantity) Around 500 nos. Around 750 nos.<br />
Artificial ligaments (Value) Rs 1.25 crore Rs 1.9 crore<br />
Source: <strong>Industry</strong> survey, IMaCS Analysis<br />
The potential market for artificial ligaments industry in 2012-13 is estimated at Rs.1.9 crore up from<br />
Rs. 1.25 crore in 2007-08 (E). The growth the industry is assumed to be 8-10% based on the industry<br />
survey. As <strong>of</strong> now, the domestic demand is completely satisfied by imports.<br />
Imports and Exports <strong>of</strong> artificial ligaments<br />
The estimated import figures for artificial joints are as given below:-<br />
HS Code Description<br />
Imports<br />
(Quantity)<br />
Imports<br />
(Value)<br />
2007-08(E) 2007-08(E)<br />
90189019<br />
ARTIFICIAL<br />
LIGAMENTS<br />
Around 500<br />
nos.<br />
Rs 1.25 crore<br />
Source: IBIS, IMaCS Analysis<br />
The artificial ligament imports arrive from Netherlands and USA. The exports <strong>of</strong> these products is<br />
negligible.
Artificial Cornea<br />
The cornea is the transparent front portion <strong>of</strong> the eye that permits light to enter the eye. Normally<br />
crystal clear, it can become cloudy or misshapen, causing gravely reduced vision or blindness.<br />
Diseased corneas can be replaced successfully through transplantation (medically termed<br />
"keratoplasty") using human donor cornea or artificial cornea (Keratoprosthesis). Human donors are<br />
primarily used for transplantation in India. Keratoprosthesis is made <strong>of</strong> clear plastic with excellent<br />
tissue tolerance and optical properties. The polymers used in artificial cornea need to be bio-<br />
compatible, flexible, sufficient mechanical strength.<br />
Product characteristics<br />
The Keratoprosthesis or artificial cornea is made using following materials:<br />
1. Poly methyl methacrylate (PMMA)<br />
2. Poly 2-hydroxythyl methacrylate hydrogels (PHEMA)<br />
3. Poly vinyl alcohol (PVA)<br />
The artificial cornea is expected to have the following characteristics:<br />
1. Withstand intraocular pressure<br />
2. Be transparent<br />
3. Have appropriate curvature<br />
4. Have suitable refractive index<br />
5. Sufficient tensile strength to allow surgical manipulation and fixation<br />
6. Scratch resistance<br />
Market for artificial cornea<br />
In India, approximately 30,000 cornea transplants are carried out every year. The usage <strong>of</strong> artificial<br />
cornea has started recently. Less than ten artificial cornea transplants have taken place in India so far.<br />
The price <strong>of</strong> this artificial cornea is around $3000 and the cornea is made available by the supplier on<br />
request only. The import <strong>of</strong> these items is set to increase with increasing medical tourism.
Artificial Skin<br />
Skin grafting is the procedure <strong>of</strong> replacing dead skin with live skin. There are two primary methods <strong>of</strong><br />
skin grafting – Autologous skin graft and allograft transfers.<br />
The autologous skin graft transfers skin from one part <strong>of</strong> the body to another. The allograft transfers<br />
skin from the bodies <strong>of</strong> other people / cadaver. Allografts <strong>of</strong>fer only temporary cover, as they are<br />
quickly rejected by a person’s immune system.<br />
The artificial skin is used in the skin grafting process. After removing burnt / damaged skin, surgeons<br />
blanket the wound with a covering (artificial skin) before applying a skin graft on top <strong>of</strong> this<br />
biomaterial to encourage the growth <strong>of</strong> new skin to close the wound.<br />
Product characteristics<br />
Artificial skin consists <strong>of</strong> two layers. The bottom layer, which is designed to regenerate the lower<br />
layer <strong>of</strong> real skin, is composed <strong>of</strong> a matrix <strong>of</strong> interwoven bovine collagen (a fibrous cow protein) and<br />
a sticky carbohydrate (sugar) molecule called glycosaminoglycan, which mimics the fibrous pattern <strong>of</strong><br />
the bottom layer <strong>of</strong> skin. This matrix then sticks to a temporary upper layer: a medical-grade, flexible<br />
silicon sheet that mimics the top, epidermal layer <strong>of</strong> skin. Integra® is major brand in artificial skin<br />
grafts. The Integra® skin grafts look somewhat like translucent plastic wrap.<br />
Market for artificial skin<br />
The artificial skin market in India is negligible due to very high costs involved. For example, a four<br />
inch by four inch skin patch costs Rs 40 lakh. The Burns Association <strong>of</strong> India is developing a skin<br />
bank to aid its grafting procedures. Indigenous development <strong>of</strong> artificial skin is already underway,<br />
however, there not many cases <strong>of</strong> clinical trials reported.
Artificial Heart<br />
In India, about 20 million patients suffer from heart failure every year. The number <strong>of</strong> heart failures is<br />
increasing by two million annually. About 20% <strong>of</strong> these patients die without medical-aid. The<br />
artificial heart is intended for use in patients whose hearts have been irreparably damaged left and/or<br />
right ventricles, and for whom, existing methods <strong>of</strong> surgical intervention and/or drug therapy are<br />
inadequate. Heart transplantation is limited by availability <strong>of</strong> donor organs. At present, donor supply<br />
limits heart transplantation to about 3,500 hearts globally every year.<br />
There is immense potential for artificial hearts. However, the device is very expensive at Rs 34 lakh<br />
and the overall cost <strong>of</strong> surgery as Rs 40 lakh. The cost <strong>of</strong> artificial heart is set to fall with<br />
improvements in technology.<br />
Artificial Lung<br />
Totally artificial lungs are not completely commercial. However, heart-lung machines are available in<br />
the market. The artificial lung device is connected to the heart’s right ventricle. It relies on the heart—<br />
not a mechanical pump—to send blood through the lung, where it receives oxygen (and <strong>of</strong>floads<br />
carbon dioxide) as it flows through the arrays <strong>of</strong> micr<strong>of</strong>ibers or membrane oxygenators. Oxygen rich<br />
blood passes from the device into the left atrium and then to the rest <strong>of</strong> the body. The micr<strong>of</strong>ibers or<br />
the membrane oxy-generator are the <strong>technical</strong> textile component in the device.<br />
Globally there have been less than 300 lung transplants. Cadaver donation or donation from brain<br />
dead patients is still the main source <strong>of</strong> transplants. The artificial lung does not have a market in India<br />
as yet and the awareness is low. Also the clinical efficacy <strong>of</strong> this product is not proven yet.
Artificial Liver<br />
Earlier, artificial support systems were not widely used in cases <strong>of</strong> liver failure, primarily because<br />
hepatic toxins are albumin-bound unlike most uremic toxins and hence cannot be removed by<br />
conventional dialysis. Recently, advances have been made for the removal <strong>of</strong> hepatic toxins making it<br />
now possible to support the patient with liver failure till the liver recovers or until liver transplantation<br />
is feasible.<br />
The major artificial liver support systems are – Peritoneal dialysis, Haemodialysis, Hem<strong>of</strong>ilteration,<br />
Continuous renal replacement therapy, Charcoal Haemoperfusion, Plasma exchange, Biologic – DT<br />
sorbent System and Molecular adsorbent recirculating system.<br />
In this system, patient's blood or plasma is pumped into bioreactors, which are hollow fibre devices,<br />
seeded on the dialysate side with freshly isolated or cryopreserved porcine hepatocytes or transformed<br />
human hepatoma cell line.<br />
Market for artificial liver<br />
India has done less than 300 liver transplantations. The liver transplants are primarily done through<br />
two modes in India –<br />
• Cadaveric donation where the liver <strong>of</strong> a brain dead person is used<br />
• Living Liver donation where half <strong>of</strong> the liver <strong>of</strong> patient’s relative is given to the patient, the<br />
liver then regenerates after some days in both donor and receiver.<br />
There has been no artificial liver transplant in India yet.
MOBILTECH<br />
Mobiltech segment <strong>of</strong> <strong>technical</strong> textile products includes applications in automotive and automotive<br />
components (including aircrafts and railways). The Mobiltech products can be broadly classified into<br />
two categories – Visible components and Concealed components. The visible components include –<br />
seat upholstery, carpets, seat belts, headliners, etc. The concealed components include – Noise<br />
Vibration and Harness (NVH) components, tyre cords, liners, etc.<br />
The <strong>technical</strong> textile products covered under mobiltech are as give below:-<br />
• Nylon tyre cord<br />
• Seat belt webbing<br />
• Airbags<br />
• Car body covers<br />
• Seat upholstery/fabric<br />
• Automotive carpets<br />
• Headliners<br />
• Insulation felts (NVH components)<br />
• Sunvisors / sunblinds<br />
• Helmets<br />
• Airline disposables<br />
• Webbings for aircrafts<br />
• Aircraft upholstery<br />
• Railways seating fabrics<br />
Technical <strong>textiles</strong> <strong>consumption</strong> under Mobiltech is estimated at around Rs 3,161 crore. Nylon tyre<br />
cord accounts for over 60% <strong>of</strong> the total <strong>technical</strong> textile <strong>consumption</strong> in the segment followed by seat<br />
upholstery / fabric with a share <strong>of</strong> around 13%. Insulation felts and helmets have share <strong>of</strong> around 5-<br />
10% each in the total <strong>consumption</strong>.<br />
The usage <strong>of</strong> <strong>technical</strong> <strong>textiles</strong> in tyres (Nylon tyre cords) is estimated as Rs 2,000 crore approx in<br />
2007-08 which is expected to increase to Rs 2,425 crore by 2012-13. Around 40% <strong>of</strong> the demand for<br />
nylon tyre cord is met through imports. The potential market for seat belts webbing in 2012-13 is<br />
estimated at Rs. 22.1 crore up from Rs. 10.6 crore in 2007-08. The potential market for seat covers<br />
fabric / upholstery industry in 2012-13 is estimated at Rs. 868 crore up from Rs. 402 crore in 2007-08.
The potential market for insulation felt industry in 2012-13 is estimated at Rs. 494 crore up from Rs.<br />
232 crore in 2007-08. The potential market for automotive interior carpet industry in 2012-13 is<br />
estimated at Rs. 290 crore up from Rs. 136 crore in 2007-08 while that for headliners is estimated at<br />
Rs. 59.3 crore in 2012-13 up from Rs. 28.7 crore in 2007-08. The potential market for sunvisors<br />
industry in 2012-13 is estimated at Rs. 154 crore up from Rs. 74 crore in 2007-08.<br />
The potential market for aircraft disposables is estimated at Rs. 5.3 crore in 2012-13 up from Rs 2.65<br />
crore in 2007-08 while that for aircraft webbings in 2012-13 is estimated at Rs. 5 crore up from Rs 2.5<br />
crore in 2007-08 and aircraft upholstery is estimated at Rs. 0.9 crore in 2012-13 up from Rs 0.45 crore<br />
in 2007-08. The potential market for railways seat cover fabric in Railways in 2012-13 is estimated at<br />
Rs. 1.54 crore up from Rs 1.3 crore in 2007-08 6 .<br />
Overall, the domestic <strong>consumption</strong> <strong>of</strong> <strong>technical</strong> <strong>textiles</strong> under mobiltech is expected to increase from<br />
around Rs 3,161 crore in 2007-08 to around Rs 5,137 crore by 2012-13.The demand for the mobiltech<br />
products is dependent on the passenger cars and commercial vehicles sector growth. The passenger<br />
vehicles have grown at 13.4% y-o-y over the last five years while commercial vehicles have grown at<br />
15.5% y-o-y. The passenger cars have grown at a CAGR <strong>of</strong> 13.8% y-o-y in the last 3 years while<br />
utility vehicles and multi-purpose vehicles have grown at 10.4% and 14.4% y-o-y respectively. The<br />
industry is expected to maintain similar growth levels over the next 5 years.<br />
The maximum growth is expected in the airbags, seat belt webbings and helmets segment. The usage<br />
<strong>of</strong> these products is driven primarily by the road safety measures enforced by the government. The<br />
airbag modules are presently made available through imports. The usage <strong>of</strong> airbags module is<br />
expected to grow at around 25% year on year. Similarly, the helmet segment is expected to achieve a<br />
growth <strong>of</strong> around 25% y-o-y.<br />
The other Mobiltech products with strong growth potential are – seat belt webbing, upholstery,<br />
automotive interior carpets, headliners and NVH components. The airlines disposables, airlines<br />
webbings and airlines seat covers / upholstery are also expected to grow at around 15% y-o-y.<br />
Summary <strong>of</strong> the market-sizing for Mobiltech<br />
Production Imports Exports<br />
2007-08 2012-13<br />
<strong>Domestic</strong><br />
Consumption<br />
<strong>Domestic</strong><br />
Consumption<br />
6 Analysis based on data/information received from Railways. IMaCS has made appropriate adjustments because <strong>of</strong><br />
insufficient data.<br />
Export<br />
Potential
Nylon tyre<br />
cord<br />
Seat belt<br />
webbing*<br />
Airbags<br />
(TT<br />
component)<br />
Car body<br />
covers<br />
Seat covers<br />
fabric /<br />
upholstery<br />
Automotive<br />
Interior<br />
carpets<br />
Headliners<br />
(TT<br />
component)<br />
Insulation<br />
felts<br />
Sunvisors /<br />
sunblinds<br />
Quantity<br />
Value<br />
Quantity<br />
Value<br />
Quantity<br />
Value<br />
Quantity<br />
Value<br />
Quantity<br />
Value<br />
Quantity<br />
Value<br />
Quantity<br />
Value<br />
Quantity<br />
Value<br />
Quantity<br />
Value<br />
Production Imports Exports<br />
2007-08 2012-13<br />
<strong>Domestic</strong><br />
Consumption<br />
<strong>Domestic</strong><br />
Consumption<br />
72,000 MT 47,500 MT 1,500 MT 118,000 MT 142,500 MT<br />
Rs 1,222<br />
crore<br />
4.3 million<br />
meters<br />
Rs 2.9<br />
crore<br />
-<br />
-<br />
1.04 lakh<br />
nos.<br />
Rs 800<br />
crore<br />
6.25<br />
million<br />
meters<br />
Rs 7.75<br />
crore<br />
2.25 lakh<br />
nos.<br />
Rs 12<br />
crore<br />
Rs 22<br />
crore<br />
-<br />
Rs 0.05<br />
crore<br />
-<br />
- -<br />
Rs 2,000<br />
crore<br />
10.56<br />
million<br />
meters<br />
Rs 10.63<br />
crore<br />
2.25 lakh<br />
nos.<br />
Rs 2,425<br />
crore<br />
21.3 million<br />
meters<br />
Rs 22.1 crore<br />
6.41 lakh<br />
nos.<br />
- Rs 12 crore Rs 35 crore<br />
1.04 lakh<br />
nos.<br />
2.1 lakh nos.<br />
Rs 9 crore - - Rs 9 crore Rs 17.5 crore<br />
13.58<br />
million<br />
meters<br />
Rs 372<br />
crore<br />
13.6<br />
million sq.<br />
m.<br />
Rs 136<br />
crore<br />
4.16<br />
million sq.<br />
m.<br />
Rs 27.18<br />
crore<br />
1.1 million<br />
meters<br />
Rs 30<br />
crore<br />
-<br />
- -<br />
14.68<br />
million<br />
meters<br />
31.56 million<br />
meters<br />
- Rs 402 crore Rs 868 crore<br />
13.6 million<br />
sq. m.<br />
29 million<br />
sq. m.<br />
- - Rs 136 crore Rs 290 crore<br />
0.25<br />
million sq.<br />
m.<br />
Rs 1.5<br />
crore<br />
-<br />
-<br />
4.41 million<br />
sq. m.<br />
Rs 28.68<br />
crore<br />
9.13 million<br />
sq. m.<br />
Rs 59.32<br />
crore<br />
22,500 MT - - 22,500 MT 48,000 MT<br />
Rs 232<br />
crore<br />
4.03<br />
million nos.<br />
Rs 70.52<br />
crore<br />
- - Rs 232 crore Rs 494 crore<br />
0.2 million<br />
nos.<br />
Rs 3.5<br />
crore<br />
-<br />
4.23 million<br />
nos.<br />
8.83 million<br />
nos.<br />
0.02 Rs 74 crore Rs 154 crore<br />
Export<br />
Potential<br />
Rs 29.5<br />
crore<br />
-<br />
-<br />
-<br />
-<br />
-<br />
-<br />
-<br />
-<br />
-<br />
-<br />
-<br />
-<br />
-<br />
-<br />
-<br />
-
Helmets<br />
Airlines<br />
disposables<br />
Webbings<br />
for aircrafts<br />
Aircrafts<br />
upholstery<br />
TT usage in<br />
Railways 2<br />
TOTAL<br />
Quantity<br />
Value<br />
Quantity<br />
Value<br />
Quantity<br />
Value<br />
Quantity<br />
Value<br />
Quantity<br />
Value<br />
Value<br />
Production Imports Exports<br />
16.7<br />
million nos.<br />
Rs 250<br />
crore<br />
13 million<br />
nos.<br />
Rs 2.25<br />
crore<br />
-<br />
-<br />
-<br />
-<br />
0.43<br />
million sq.<br />
m.<br />
Rs 1.3<br />
crore<br />
Rs 2,325<br />
crore<br />
2007-08 2012-13<br />
- -<br />
<strong>Domestic</strong><br />
Consumption<br />
16.7 million<br />
nos.<br />
<strong>Domestic</strong><br />
Consumption<br />
27.6 million<br />
nos.<br />
- - Rs 250 crore Rs 759 crore<br />
3.9 million<br />
nos.<br />
Rs 0.4<br />
crore<br />
0.25<br />
million<br />
meters<br />
Rs 2.5<br />
crore<br />
5,000<br />
meters<br />
Rs 0.45<br />
crore<br />
-<br />
-<br />
-<br />
16.9 million<br />
nos.<br />
Rs 2.65<br />
crore<br />
0.25 million<br />
meters<br />
33.8 million<br />
nos.<br />
Rs 5.3 crore<br />
0.5 million<br />
meters<br />
- Rs 2.5 crore Rs 5 crore<br />
- 5,000 meters<br />
-<br />
- -<br />
Rs 0.45<br />
crore<br />
0.43 million<br />
sq. m.<br />
10,000<br />
meters<br />
Rs 0.9 crore<br />
0.51 million<br />
sq. m.<br />
- - Rs 1.3 crore Rs 1.54 crore<br />
Rs 858<br />
crore<br />
Rs 22<br />
crore<br />
Rs 3,161<br />
crore<br />
Rs 5,137<br />
crore<br />
* Seat belt webbings estimate <strong>of</strong> domestic usage is excluding direct imports <strong>of</strong> seat belts by global<br />
auto OEMs; reduction in direct imports <strong>of</strong> seat belts is possible provided the manufacturing capacity<br />
<strong>of</strong> seat belt webbing and seat belts increases over the next five years<br />
As per ECTT report, the potential market sizing for 2007-08 was as given below:-<br />
Market size<br />
(ECTT report)<br />
Nylon tyre cord<br />
2001-02 2007-08 (P)<br />
Quantity 65,000 MT 75,000 MT<br />
Value Rs 812 crore Rs 937 crore<br />
Seat belt webbing Quantity 5.76 million meters 22.35 million meters<br />
Export<br />
Potential<br />
-<br />
-<br />
-<br />
-<br />
-<br />
-<br />
-<br />
-<br />
-<br />
-<br />
Rs 29.5<br />
crore
Market size<br />
(ECTT report)<br />
Airbags<br />
(TT component)<br />
Car body covers<br />
Seat covers / fabric<br />
Automotive Interior<br />
carpets<br />
Headliners<br />
(TT component)<br />
Insulation felts<br />
Helmets<br />
2001-02 2007-08 (P)<br />
Value Rs 9.22 crore Rs 35.76 crore<br />
Quantity 25,000 nos. 14.48 lakh nos.<br />
Value Rs 1 crore Rs 72.4 crore<br />
Quantity 50,000 nos. 80,000 nos.<br />
Value Rs 3.75 crore Rs 6 crore<br />
Quantity 2.5 million meters 5.96 million meters<br />
Value Rs 68.75 crore Rs 163.9 crore<br />
Quantity 2.5 million sq m 8 million sq m<br />
Value Rs 25 crore Rs 80 crore<br />
Quantity 1.34 million sq m 2.9 million sq m<br />
Value Rs 8.04 crore Rs 17.38 crore<br />
Quantity 6.31 lakh nos. 14.48 lakh nos.<br />
Value Rs 13.4 crore Rs 28.96 crore<br />
Quantity 12.65 lakh nos. 20.3 lakh nos.<br />
Value Rs 204.5 crore Rs 317.55 crore<br />
TOTAL Value Rs 1,169.24 crore Rs 1,699.21 crore<br />
Capital Employed and Pr<strong>of</strong>itability <strong>of</strong> key players <strong>of</strong> Mobiltech<br />
Company Name<br />
Capital Employed<br />
(Rs crore)<br />
Net Pr<strong>of</strong>it Margin<br />
(%)<br />
2006-07 2007-08 2006-07 2007-08<br />
Bharat Seats Ltd. 28.9 28.3 1.4% 1.4%<br />
Century Enka Ltd. 790.5 784.2 1.5% 1.0%<br />
Elgi Ultra Inds. Ltd. 33.3 34.2 0.4% 0.5%<br />
Entremonde Polyecoaters Ltd. 6.5 7.3 2.5% 2.3%
Faze Three Ltd. 133.2 139.3 3.3% 4.0%<br />
Fenoplast Ltd. 22.9 33.2 1.9% 2.5%<br />
Jasch Industries Ltd. 20.5 23.4 3.8% 3.3%<br />
Krishna Maruti Ltd. 83.0 96.6 2.1% 2.1%<br />
Mayur Uniquoters Ltd. 25.1 28.9 3.7% 5.2%<br />
N R C Ltd. 132.7 -31.6 -5.9% -50.5%<br />
S R F Ltd. 1285.9 1330.9 14.6% 7.7%<br />
S R M Energy Ltd. 5.0 7.3 -0.1% -45.6%<br />
Shamken Multifab Ltd. 178.8 166.8 -29.2% -49.2%<br />
Uniproducts (India) Ltd. 57.1 76.4 2.8% 2.9%<br />
Source: Prowess Database, IMaCS Analysis<br />
Mobiltech segment <strong>of</strong> <strong>technical</strong> <strong>textiles</strong> is estimated to provide employment to 28,000 people 7 <strong>of</strong><br />
whom number <strong>of</strong> <strong>technical</strong> employees 8 is estimated at 22,000 and number <strong>of</strong> non-<strong>technical</strong> employees<br />
is estimated at 6,000.<br />
The growth <strong>of</strong> the mobiltech products industry in India is dependent on the growth <strong>of</strong> automobiles<br />
production in India. The key impediments to growth being faced by the industry are:-<br />
1. <strong>Domestic</strong> availability <strong>of</strong> raw materials like Nylon and polyester filaments is low<br />
2. Availability <strong>of</strong> competitively priced imports from the south-asian countries<br />
3. Low demand <strong>of</strong> airbags in the country because <strong>of</strong> which domestic production <strong>of</strong> airbags is not<br />
economical<br />
Key growth driver for the Mobiltech segment (and products)<br />
The passenger vehicles have grown at 13.4% y-o-y over the last five years while CVs have grown at<br />
15.5% y-o-y. The passenger cars have grown at a CAGR <strong>of</strong> 13.8% y-o-y in the last 3 years while UVs<br />
and MPVs have grown at 10.4% and 14.4% y-o-y respectively. The industry is expected to maintain<br />
similar growth levels over the next 5 years.<br />
Automobile production trend in India<br />
7 Employment has been estimated based on the analysis <strong>of</strong> primary and secondary data available for the<br />
<strong>technical</strong> textile manufacturers. IMaCS has made appropriate adjustments because <strong>of</strong> insufficient data.<br />
8 Technical includes managerial staff and skilled labour whereas non-<strong>technical</strong> includes unskilled labour.
(Vehicles in '000 numbers) Production<br />
<strong>Segment</strong> 2002-03 2003-04 2004-05 2005-06 2006-07 2007-08<br />
Passenger Vehicles ( PVs )<br />
Passenger Cars 557.4 781.8 960.5 1,045.9 1,238.0 1,416.5<br />
UVs 114.5 146.1 182.0 196.4 222.5 244.6<br />
MPVs 51.4 60.7 67.4 66.7 84.7 101.0<br />
Total Passenger Vehicles 723.3 988.5 1,209.9 1,308.9 1,545.2 1,762.1<br />
Commercial Vehicles (CVs)<br />
M&HCVs<br />
Passenger Carriers 21.2 27.6 30.4 29.0 32.8 46.5<br />
Goods Carriers 99.3 138.5 184.4 190.3 261.4 244.6<br />
Total M&HCVs 120.5 166.1 214.8 219.3 294.3 291.1<br />
LCVs<br />
Passenger Carriers 19.8 21.0 22.6 25.4 29.4 33.9<br />
Goods Carriers 63.4 88.1 116.3 146.4 196.3 220.2<br />
Total LCVs 83.2 109.1 138.9 171.8 225.7 254.1<br />
Total Commercial Vehicles 203.7 275.2 353.7 391.1 520.0 545.2<br />
Source: SIAM<br />
The passenger cars are further classified as given below in 6 categories:-<br />
Production<br />
2002-03 2003-04 2004-05 2005-06 2006-07 2007-08<br />
A1: Mini - (Upto 3400 mm) 148187 178,364 127175 98047 99400 77039<br />
A2: Compact (3401-4000mm) 310824 443,774 614137 714805 881528 1044848<br />
A3: Mid-size (4001-4500 mm) 93,174 142,016 187345 204179 212662 244670<br />
A4: Executive (4501-4700 mm) 2,039 13,467 26673 23428 39693 43955<br />
A5: Premium (4701-5000 mm) 3,109 4,047 5017 5333 4489 5443<br />
A6: Luxury (5001mm & above) 77 96 140 89 249 525<br />
Source: SIAM<br />
Seat belt webbing<br />
Seat belts function as a safety harnesses which secure the passengers in a vehicle against harmful<br />
movements during collision or similar incidents. Seat belts minimise injuries during accidents. Seat<br />
belts are woven narrow fabric made from nylon filament yarns or high tensile polyester filament yarn.<br />
The load specification is an important criterion for usage in vehicles.<br />
According to the Government Notification under Central Motor Vehicle Regulation (CMVR) all four<br />
wheelers have to be equipped with front and rear seat belts. Further, as per the Supreme Court<br />
Notification, all State Governments are expected to ensure that the driver and co-driver use the seat<br />
belts. The usage and demand for seat belts increased after the above two notifications were<br />
implemented.
At present, the seat belts, which are used in the cars, are called three-point which has single<br />
continuous length <strong>of</strong> webbing. They are called three-point because these belts help spread out energy<br />
<strong>of</strong> the moving body in a collision over the chest, pelvis and shoulders.<br />
Seat belts are classified as:-<br />
1. Static belts<br />
2. ELR (Emergency Locking Retractor) belts<br />
Product Characteristics<br />
The seat belts are made from nylon filament yarn or polyester filament yarn which is woven to<br />
produce the webbing pattern. The linear density <strong>of</strong> synthetic yarns should be between 100dtex and<br />
3000dtex, preferably 550-1800dtex. The filament linear density should be between 5dtex and 30dtex,<br />
preferably 8-20dtex. A typical seat belt is made <strong>of</strong> 320 ends <strong>of</strong> 1,100 dtex polyester each. Most weft<br />
yarns made from polyester are 550dtex.The critical characteristics <strong>of</strong> the webbing are abrasion<br />
resistance, resistance to light and heat, capable <strong>of</strong> being removed and put back in place easily and<br />
good retraction behaviour. The load bearing capacity <strong>of</strong> seat belts is 1500 kilograms. The surface <strong>of</strong><br />
the webbing (generally smooth) is <strong>of</strong> particular significance because its structure and properties<br />
decisively influence the retraction behaviour.<br />
Key growth drivers <strong>of</strong> the seat belts market in India<br />
The seat belt usage is mandatory in the four wheeler vehicles and hence, the growth <strong>of</strong> seat belts is<br />
pegged to move in line with the growth in the four wheeler vehicles in India. The overall seat belt<br />
market in India is pegged at around Rs. 303 crore assuming an average seat belt price <strong>of</strong> Rs. 600.<br />
Consumption norms and the market size<br />
The usage <strong>of</strong> seat belts in vehicles varies from two in LCVs to seven in MUVs & SUVs.<br />
Unit UVS MPV<br />
Passenger cars<br />
A1 A2 A3 A4 A5 A6<br />
Seat Belts Nos. 7 4 2 2 2 4 4 5<br />
Source: <strong>Industry</strong> survey<br />
The seat belt webbing (the strap) is the <strong>technical</strong> textile in the complete seat belt assembly. The<br />
webbing is made <strong>of</strong> polyester or nylon. The <strong>consumption</strong> norm for seat belt is around 2.5 to 3 meters<br />
webbing per seat belt.<br />
The current and future forecast <strong>of</strong> seat belt industry is given below:-
Seat belts webbings<br />
Effective domestic<br />
<strong>consumption</strong>#<br />
Number <strong>of</strong> seat belts<br />
(<strong>Domestic</strong> <strong>consumption</strong> +<br />
Exports)<br />
Seat belt webbings Quantity<br />
(<strong>Domestic</strong> usage - effective)*<br />
Seat belt webbings Quantity<br />
(<strong>Domestic</strong> usage - actual)<br />
2007-08 2012-13<br />
5.1 million number 10.34 million number<br />
13.9 million meters 28.1 million meters<br />
10.56 million meters 21.3 million meters<br />
Value (<strong>Domestic</strong> usage - actual) Rs 10.63 crore Rs 22.1 crore<br />
Source: <strong>Industry</strong> survey, IMaCS Analysis<br />
* including webbings as direct imports <strong>of</strong> seat-belts<br />
# Effective domestic <strong>consumption</strong> includes seat belt webbings used in direct exports <strong>of</strong> seat belts<br />
The potential market for seat belts webbing in 2012-13 is estimated at Rs. 22.1 crore up from Rs.<br />
10.63 crore in 2007-08 (E). No inflationary increase has also been assumed for the price <strong>of</strong> the<br />
webbing material. In volume terms, the domestic usage <strong>of</strong> seat belt webbing is expected to grow from<br />
10.6 million meters in 2007-08 to 21.3 million meters in 2012-13. The growth in the seat belts usage<br />
is expected to be more than the overall growth in passenger cars/UVs/MPVs due to the stronger<br />
growth <strong>of</strong> the high-end cars with more seat-belts.<br />
The direct imports <strong>of</strong> seat-belts account for around 1.23 million seat-belts out <strong>of</strong> 5.1 million seat-belts<br />
(approx 24%). Hence, the webbings usage for automotive seat-belts is around 10.6 million meters.<br />
Imports account for around 60% <strong>of</strong> webbings usage for seat-belts. The domestic production <strong>of</strong> seat<br />
belt webbings is around 4.3 million meters.<br />
Key manufacturers and exporters<br />
Some <strong>of</strong> the major seat belt global players have presence in India through JVs. The major<br />
manufacturers <strong>of</strong> seat belts in India are IFB Autoliv India, Abhishek Auto Industries, Bond Safety<br />
Belt and Rane TRW.<br />
IFB Autoliv has its main facility for seatbelt assembly in Bangalore. The company’s is today the clear<br />
leader in the Indian seatbelt market with a market share <strong>of</strong> more than 50%. Major customers include<br />
Suzuki, Telco and Hyundai and sales totalled approximately Rs 200 crore in 2006-07.<br />
Seat belt Manufacturers Year Capacity Production<br />
Quantity<br />
Sales Value<br />
IFB Autoliv 2006-07 Rs 200 crore<br />
(seat-belts)<br />
Rane TRW 2006-07 1 million 0.686 million Rs 27.7 crore<br />
numbers seat belts<br />
Bond Safety Belts 2005-06 0.3 million seat<br />
belts<br />
Rs 6.5 crore
Source: <strong>Industry</strong> Survey, Company web-sites, Capitaline<br />
The source <strong>of</strong> seat belt webbing in India is domestic production and imports. The domestic<br />
manufacturers for seat belt webbing are small in size like Shivam Narrow Fabrics, D.I. Plast India<br />
Pvt. Limited, UP Filaments and others <strong>of</strong> similar size.<br />
Manufacturer Year Production<br />
Quantity<br />
Shivam Narrow Fabrics * 2007-08 2.5 million<br />
meters<br />
UP Filaments** 2007-08 1200 MT<br />
Source: <strong>Industry</strong> Survey<br />
* Includes only seat-belt webbing for automobiles<br />
** Includes webbings for all applications<br />
Rane TRW utilised 1.647 million meters seat-belt webbings (Rs 2.3 crore at Rs 13.97 per meter) in<br />
2006-07 for manufacturing 0.686 million seat-belts (i.e. 2.4 meter webbing per seat-belt).<br />
Auto component manufacturer NK Minda Group has announced the formation <strong>of</strong> a joint venture (JV)<br />
with Japan's Tokai Rika to manufacture automotive seat belts in Bangalore.<br />
Imports & Exports <strong>of</strong> webbings for seat-belts (four-wheelers)<br />
The import figures for webbings with application in four wheelers seat belts manufacture are as given<br />
below:-<br />
HS Code Description Imports Imports<br />
2007-08(E) 2007-08(E)<br />
58063200 SEAT BELT WEBBINGS*<br />
Around 2.25<br />
million meters<br />
Rs 2.5 crore<br />
approx.<br />
59119090** SEAT BELT WEBBINGS<br />
Around 4 million<br />
meters<br />
Rs 5.25 crore<br />
approx.<br />
Source: IBIS, IMaCS Analysis<br />
* These webbings find usage in automotive belts and host <strong>of</strong> other applications;<br />
non-webbing products under this HS code have been excluded<br />
** In addition, seat belt webbings are also imported under HS code 59111000 in<br />
very small amounts<br />
Under the HS code 59X, Thailand accounts for two-thirds <strong>of</strong> automotive seat-belt webbings imports<br />
while Japan accounts for one-third <strong>of</strong> the imports, China accounts for 2-3% and Malaysia, Turkey &<br />
Phillipenes account for around 1% <strong>of</strong> the seat-belts webbings imports approximately.<br />
Under the HS code 58X, Korea accounts for over 90% imports <strong>of</strong> automotive seat-belt webbings<br />
imports while Thailand accounts for the remaining imports.
The exports <strong>of</strong> seat belt webbing from India are almost negligible.<br />
In addition to the webbings, the direct imports and exports <strong>of</strong> seat belts is as given below. The import<br />
figures for seat belt are as given below:-<br />
HS Code Description Imports (in Rs crore) Imports (Quantity)<br />
2005-06 2006-07 2007-08(E) Unit 2005-06 2006-07 2007-08(E)<br />
87082100<br />
SAFETY SEAT<br />
BELTS<br />
346 389 456<br />
Million<br />
Nos.<br />
1.267 1.074 1.228<br />
Source: DGCIS, IMaCS Analysis<br />
The direct export figures for seat belts are as given below:-<br />
HS Code Description Exports (in Rs crore) Exports (Quantity)<br />
2005-06 2006-07<br />
Unit<br />
2005-06 2006-07<br />
87082100<br />
SAFETY SEAT<br />
BELTS<br />
India is a net importer <strong>of</strong> seat belts.<br />
Raw-materials and machinery<br />
14 19 Million<br />
Nos.<br />
0.055 0.053<br />
Source: DGCIS, IMaCS Analysis<br />
The seat belts are woven using nylon or polyester yarn on needle looms. The machinery used for<br />
webbing is primarily imported. The yarn formation machine is supplied by Muller (Germany) and the<br />
webbing formation machine by Bonus (England).<br />
Quality Control and Standards<br />
The manufacturer <strong>of</strong> the seat belt webbing usually follows the load specification given by the seat belt<br />
manufacturer. There is no standard at this level. However the overall seat belt assembly follows AIS<br />
2005/2000 safety assembly specification <strong>of</strong> Automotive Research Association <strong>of</strong> India (ARAI).<br />
Law on Use <strong>of</strong> Seatbelt: As per the provisions <strong>of</strong> sub-rule (3) <strong>of</strong> Rule 138 <strong>of</strong> the Central Motor<br />
Vehicle Rules, 1989 'in a motor vehicle, in which seat-belts have been provided under sub-rule (1) or<br />
sub-rule (1A) <strong>of</strong> rule 125 or rule 125A, as the case may be, it shall be ensured that the driver, and the<br />
person seated in the front seat or the persons occupying front facing rear seats, as the case may be,<br />
wear the seat belts while the vehicle is in motion.<br />
Rule 125 (1) requires the manufacturer <strong>of</strong> every motor vehicle other than motor cycles and three-<br />
wheelers <strong>of</strong> engine capacity not exceeding 500 cc, shall equip every such vehicle with a seat belt for<br />
the driver and for the person occupying the front seat.
Rule 125 (1A) requires the manufacturer <strong>of</strong> every motor vehicle that is used for carriage <strong>of</strong> passengers<br />
and their luggage and comprising no more than 8 seats in addition to the driver's seat, shall equip it<br />
with a seat belt for a person occupying the front facing rear seat.
Car upholstery: Seat cover fabrics<br />
Woven seat cover is one <strong>of</strong> the important contributors <strong>of</strong> <strong>technical</strong> textile in an automobile. With<br />
gradual improvement in vehicle models and increased emphasis on luxury and comfort, the seat cover<br />
market has witnessed uptrend in the market. Seat covers are made from cotton, vinyl, velvet and<br />
leather.<br />
Product characteristics<br />
The fabric used for the manufacture <strong>of</strong> seat covers is woven on looms. The desired product<br />
characteristics are durability, ultra-violet fade and wear resistance, water-pro<strong>of</strong>ing, flexibility and<br />
stretchableness. The type <strong>of</strong> seat cover used varies based on the automobile model and desired styling<br />
<strong>of</strong> the upholstery. The yarn required for the seat covers is in the range <strong>of</strong> 500 deniers to 1300 deniers.<br />
Market dynamics and key growth drivers<br />
The primary growth driver for seat cover fabrics is the sales <strong>of</strong> passenger cars, MUVs and SUVs<br />
(explained in the beginning <strong>of</strong> the Mobiltech segment). The commercial vehicles (buses and trucks) as<br />
well as two-wheelers use PVC / PU / resin for manufacturing seat covers.<br />
Key manufacturers <strong>of</strong> seat covers<br />
The major producers <strong>of</strong> seat covers include Faze Three Limited, Shamken Multifab and Bhilwara<br />
Melba Limited. The production figures <strong>of</strong> the key producers <strong>of</strong> seat covers are as given below:-<br />
Manufacturer Product Year Quantity<br />
(million<br />
meters)<br />
Value<br />
(Rs crore)<br />
Unit Price<br />
(Rs / meter)<br />
Installed<br />
capacity<br />
(million meters)<br />
Faze Three Made-ups 2006-07 1.77 117 Rs 403 3.0<br />
Shamken Multifab Plush fabrics 2006-07 0.29 5.77 Rs 218 ~1.97<br />
Source: Capitaline<br />
Bharat Seats and Krishna Maruti Ltd are the major manufacturers <strong>of</strong> automotive seats. Bharat Seats<br />
produces 3.18 lakh seats in 2007-08 with value <strong>of</strong> Rs 221 crore (for the seat including cover). In<br />
addition to the large producers, a large number <strong>of</strong> small producers are also supplying to the Indian<br />
market.<br />
Consumption norms, market size and future forecast <strong>of</strong> seat covers
The seat cover requirement in vehicles varies from two meters in small cars to eleven meters in multi<br />
utility vehicles and luxury end cars.<br />
Unit UVS MPV<br />
A1 A2<br />
Passenger cars<br />
A3 A4 A5 A6<br />
Value<br />
(Rs/meter)<br />
Seat Cover meters 11 5 3 5 7 8 9 11 275<br />
sq m 16 8 5 7 10 12 14 16<br />
Average life <strong>of</strong> seat covers (adjusted for customers who rarely change their seat covers) is estimated<br />
as 5 years.<br />
The current and future forecast <strong>of</strong> passenger car seat covers industry is given below:-<br />
Seat upholstery<br />
<strong>Domestic</strong> usage<br />
Seat upholstery<br />
(in million meters)<br />
Seat upholstery<br />
Value (in Rs. crore)<br />
Market 2007-08 2012-13<br />
New car sales 9.91 20.44<br />
Replacement market 4.7 11.12<br />
Total 14.68 31.56<br />
New car sales 272.6 562.1<br />
Replacement market 129.4 305.9<br />
Total 402.0 868.0<br />
Source: <strong>Industry</strong> survey, IMaCS Analysis<br />
The potential market for seat cover industry in 2012-13 is estimated at Rs. 868 crore up from Rs. 402<br />
crore in 2007-08 (E). No inflationary increase has also been assumed for the price <strong>of</strong> the seat-cover<br />
material. In volume terms, the usage <strong>of</strong> seat cover (including the replacement market) is expected to<br />
grow from 14.68 million meters in 2007-08 to 31.56 million meters in 2012-13.<br />
Imports & Exports <strong>of</strong> car-seat fabrics<br />
The import figures for car seat fabrics are as given below:-
HS Code Description Imports Imports<br />
2007-08(E) 2007-08(E)<br />
59039090*<br />
PU LAMINATING<br />
FABRICS FOR CAR SEAT<br />
Around 1.1<br />
million meters<br />
Rs 30 crore<br />
approx.<br />
Source: IBIS, IMaCS Analysis<br />
*Imports <strong>of</strong> fabric for car seat covers under the HS code 58110090 and car seat<br />
covers under HS code 63049990 account for less than 1% share<br />
Korea accounts for two-third <strong>of</strong> the imports <strong>of</strong> the car-seats fabrics followed by China with one-third<br />
<strong>of</strong> the share.<br />
The exports <strong>of</strong> car seat fabrics from India are almost negligible.<br />
The direct import figures for passenger car seats (fully-built) are as given below:-<br />
HS Code Description<br />
94012000, 94019000<br />
PASSNGER CAR SEATS<br />
(FRONT/REAR)<br />
Imports Imports<br />
(in MT) (in Rs crore)<br />
2007-08(E) 2007-08(E)<br />
0.22 million Rs 120 crore<br />
Source: IBIS, IMaCS Analysis<br />
Almost 85% <strong>of</strong> the direct seat exports to India are from Czech Republic and the remaining from<br />
Mexico, Sweden and Germany.<br />
Raw-materials and Machinery<br />
Seat covers are made from cotton, vinyl, velvet and leather. The cotton or synthetic yarn is woven on<br />
power looms to produce fabric which is further sentered on sentering machine to smoothen out the<br />
fabric (remove bumps). The fabric is further laminated to provide desired protection characteristics.<br />
The fabric is further finished as per the deisred specifications <strong>of</strong> automobile original equipement<br />
manufacturer (OEM).<br />
Quality Control and Standards<br />
The manufacturers <strong>of</strong> seat covers adhere to the specifications given by the automobile OEMs.
Car upholstery: Car Body Covers<br />
Car body covers are used to cover the car if no covered space for parking (parking garage) is<br />
available.<br />
Product characteristics<br />
The car body cover is a 100% <strong>technical</strong> textile product based on the raw material used. The car body<br />
covers are made <strong>of</strong> a variety <strong>of</strong> fabrics including canvas covers, HDPE, PVC reinforced cotton<br />
material and Nylon.<br />
Consumption norms and the market size<br />
The penetration <strong>of</strong> car body covers is very low in India. These covers are required only if covered<br />
parking garage is not available. Even in the absence <strong>of</strong> covered parking space, most <strong>of</strong> the car owners<br />
do not use car body covers. The penetration <strong>of</strong> car body covers is around 4-5%.<br />
Car body covers<br />
Number <strong>of</strong> cars on road at the start <strong>of</strong><br />
2007-08<br />
9.5 million<br />
Additional cars on road in 2007-08 1.76 million<br />
Penetration 4-5%<br />
Life <strong>of</strong> car body covers 5 to 7 years<br />
Demand for car body covers 1.04 lakh<br />
Source: <strong>Industry</strong> survey, IMaCS Analysis<br />
The car body cover prices range from Rs 600 to Rs 1100. The average price <strong>of</strong> car body cover is Rs<br />
850. The prices have seen a drop over the years. The substitute <strong>of</strong> car body cover is a layer <strong>of</strong><br />
protective coating laid over the car surface. This surface treatment costs about Rs. 3000 to Rs. 4000.<br />
The penetration <strong>of</strong> car body covers is expected to drop marginally because <strong>of</strong> the surface treatment<br />
substitute.<br />
The current and future forecast <strong>of</strong> car body covers domestic usage is given below:-<br />
Car body covers<br />
<strong>Domestic</strong> usage<br />
2007-08 2012-13
Quantity 1.04 lakh nos. 2.1 lakh nos.<br />
Value Rs 9 crore Rs 17.5 crore<br />
Source: <strong>Industry</strong> survey, IMaCS Analysis<br />
The potential market for car body covers industry in 2012-13 is estimated at Rs.17.5 crore up from<br />
Rs. 9 crore in 2007-08 (E). The volume <strong>of</strong> car body covers is expected to grow to 2.2 lakh covers by<br />
2012-13 from 1.04 lakh covers in 2007-08. No change in the price <strong>of</strong> covers has been assumed for<br />
market sizing.<br />
Key players manufacturing car body covers<br />
Car body covers are typically unbranded and are made by several small local players. Maruti Suzuki<br />
sells branded car body covers, however, in very limited numbers. One <strong>of</strong> the first manufacturers <strong>of</strong><br />
covers in organised market is Polco in Mumbai.<br />
Quality Control and Standards – No available standards
Automobile interior carpets<br />
All passenger cars have company fitted carpets. The carpets are laid in the cabin and parcel shelf at<br />
the back. The carpets are primarily non-woven textile material. The usage <strong>of</strong> carpets varies based on<br />
the interior designs which vary across car models. Usage <strong>of</strong> carpets in buses and other M&HCVs is<br />
minimal.<br />
Product characteristics<br />
The automotive interior carpets are non-woven <strong>technical</strong> <strong>textiles</strong>, made primarily from polypropylene<br />
fibres. The carpet is laid on the vehicle floor above which rubber mats are placed. The desired<br />
characteristics <strong>of</strong> automobile interior carpets typically are as given below:<br />
1. High durability<br />
2. High abrasion resistance<br />
3. Tensile strength – warp around 50 KGF and weft around 45 KGF<br />
4. Low in-flammability<br />
5. Good compression recovery<br />
The fabric is around 500 GSM with a thickness <strong>of</strong> about 3mm.<br />
Key growth drivers <strong>of</strong> Automobile interior carpets industry<br />
The primary growth driver for automobile interior carpets is the sales <strong>of</strong> passenger cars, MUVs and<br />
SUVs (explained in the beginning <strong>of</strong> the Mobiltech segment).<br />
Consumption norms, market size and future forecast<br />
The automobile interior carpet is a 100% <strong>technical</strong> textile product. The usage varies based on the<br />
dimensions <strong>of</strong> the cabin floor and parcel shelf. The usage varies from 6.25 square meters to 9 square<br />
meters across models.<br />
Interior<br />
Carpets<br />
Unit UVS MPV<br />
sq. m. 9 9<br />
Passenger cars<br />
A1 A2 A3 A4 A5 A6<br />
6.25 7.25 8.25 8.25 8.25 8.25<br />
The current and future forecast <strong>of</strong> automobile interior carpet industry is given below:-<br />
Automotive interior carpets<br />
<strong>Domestic</strong> <strong>consumption</strong><br />
2007-08 2012-13<br />
Source: <strong>Industry</strong> survey<br />
Value<br />
(Rs/sq.<br />
m)<br />
100
Quantity 13.6 million sq. m. 29 million sq. m.<br />
Value Rs 136 crore Rs 290 crore<br />
Source: <strong>Industry</strong> survey, IMaCS Analysis<br />
The potential market for automotive interior carpet industry in 2012-13 is estimated at Rs. 290 crore<br />
up from Rs. 136 crore in 2007-08 (E). No inflationary increase has been assumed for the price <strong>of</strong> the<br />
interior carpet material. In volume terms, the usage <strong>of</strong> carpet is expected to grow from 13.6 million<br />
square meters in 2007-08 to 29 million square meters in 2012-13.<br />
Key producers <strong>of</strong> automotive interior carpets<br />
The major producers <strong>of</strong> carpets in India include Uniproducts India, Bajaj Carpets, Hitkari Fibres and<br />
Supreme Non-wovens. The automobile carpet industry would follow the vehicle manufacturing trend.<br />
The production figures <strong>of</strong> major interior carpet manufacturers are as given below:-<br />
Manufacturer Year Quantity<br />
(million Sq m)<br />
Value (Rs<br />
crore)<br />
Unit Price (Rs) Installed<br />
capacity<br />
(million Sq m)<br />
Uniproducts 2007-08 3.61 69 191 2.6<br />
Hitkari Fibres 2007-08 1.29 7 54 NA<br />
Bajaj Carpet<br />
Industries Ltd<br />
2005-06 1.74* 24.23*<br />
* Bajaj carpet Industries Ltd production quantity and value are for automotive interior carpets and felts<br />
Source: <strong>Industry</strong> survey, Capitaline, Ministry <strong>of</strong> Textiles<br />
The other major automotive carpet manufacturers are Jeevan Non-Wovens and Entremonde<br />
Polycoaters. In addition to these manufacturers there are other small players catering to the domestic<br />
demand.<br />
Raw-materials and Machinery<br />
The automotive interior carpets are non-woven (needle-punched) <strong>technical</strong> <strong>textiles</strong>, made primarily<br />
from polypropylene fibres.<br />
The needle punching machine is imported from Austria, Taiwan and China<br />
1. Oerlikon Neumag GmbH, Austria – Fehrer needle punching technology<br />
2. Shoou Shyng, Taiwan- SPL-03+SVP<br />
Quality Control and Standards - The manufacturers <strong>of</strong> automotive interior carpet adhere to the<br />
specifications given by the automobile OEMs.
Headliners<br />
Headliners are used in passenger cars and multi/sports utility vehicles as non-woven light weight<br />
ro<strong>of</strong>ing material. The cars were earlier fitted with knitted/woven fabric with hard cardboard type <strong>of</strong><br />
backing. The trend has changed and increasingly non-woven headliners are being used in vehicles.<br />
Product characteristics<br />
A headliner is a composite material that consists <strong>of</strong> a face fabric with nonwoven or foam backing that<br />
is adhered to the inside ro<strong>of</strong> <strong>of</strong> automobiles. Most headliners consist <strong>of</strong> a tricot knit fabric that is<br />
knapped to provide a s<strong>of</strong>t touch and uniform appearance. The fabric is adhered with melted<br />
polyurethane foam. This fabric-foam composite is glued to the interior fiberglass ro<strong>of</strong> <strong>of</strong> the<br />
automobile.<br />
Headliners non-woven fabrics have GSM in the range <strong>of</strong> 185-220 GSM. The desired characteristics <strong>of</strong><br />
headliners are good sound damping properties and good aesthetics. The manufacturing process and<br />
material used varies across manufacturers and as per OEM specifications.<br />
Key growth drivers <strong>of</strong> Headliners industry<br />
The primary growth driver for the headliners is the sales <strong>of</strong> passenger cars, MUVs and SUVs<br />
(explained in the beginning <strong>of</strong> the Mobiltech segment).<br />
Consumption norms and the market size<br />
The headliner is a 100% polyester non-woven <strong>technical</strong> textile product. The usage varies based on the<br />
dimensions <strong>of</strong> the ro<strong>of</strong>. The usage varies from 2 square meters in small cars to 4 square meters in<br />
large cars.<br />
Unit UVS MPV<br />
Headliners sq. m. 4 3<br />
Passenger cars<br />
A1 A2 A3 A4 A5 A6<br />
2 2 3 3 3.5 4<br />
The current and future forecast <strong>of</strong> headliners fabric domestic usage is given below:-<br />
Source: <strong>Industry</strong> survey<br />
Value<br />
(Rs/sq.<br />
m)<br />
65
Headliner fabrics domestic<br />
usage<br />
Quantity<br />
2007-08 2012-13<br />
4.41 million<br />
sq m<br />
9.13 million<br />
sq m<br />
Value Rs 28.7 crore Rs 59.3 crore<br />
Source: <strong>Industry</strong> survey, IMaCS Analysis<br />
The potential market for headliners industry in 2012-13 is estimated at Rs. 59.3 crore up from Rs.<br />
28.7 crore in 2007-08 (E). No inflationary increase has been assumed for the price <strong>of</strong> the headliner<br />
fabric. In volume terms, the usage <strong>of</strong> headliner is expected to grow from 4.41 million square meters in<br />
2007-08 to 9.13 million square meters in 2012-13.<br />
Key manufacturers <strong>of</strong> automobile headliners<br />
The production figures <strong>of</strong> major headliners manufacturers are as given below:-<br />
Manufacturer Year Production<br />
Quantity<br />
( million Nos)<br />
Quantity<br />
( million Nos)<br />
Krishna Maruti 2007-08 ~0.6 ~0.6<br />
Multivac India 2007-08 ~0.2 ~0.2<br />
Total 2007-08 ~0.8 ~0.8<br />
Source: Krishna Maruti, MultivacIndia<br />
Krishna Maruti has around 12-14% market share in the headliners market (indicating total headliners<br />
market <strong>of</strong> around 4.5 million headliners per annum).<br />
Uniproducts (I) Ltd and Supreme Non-woven Pvt Ltd are the key manufacturers <strong>of</strong> headliner fabric in<br />
India. The production <strong>of</strong> Uniproducts (I) and Supreme Non-woven are as given below:-<br />
Manufacturer Product Year Production<br />
Quantity<br />
Installed<br />
capacity<br />
Uniproducts* Non-woven<br />
light weight<br />
2007-08 214 MT 650 MT<br />
Supreme Non- Non-woven 2005-06 2.45 million 15,000 MT<br />
woven** fabrics<br />
meters<br />
Non-woven<br />
fabrics<br />
2007-08 15,000 MT 25,000 MT<br />
Source: Capitaline, Ministry <strong>of</strong> Textiles<br />
* Includes moulded carpets, chemical & thermo bond nonwovens and ro<strong>of</strong> liners<br />
** Includes other non-woven products as well<br />
Automobile products account for around 50% <strong>of</strong> Supreme Non-woven production. The estimated<br />
capacity utilisation <strong>of</strong> Supreme Non-woven is around 60%. Supreme non-woven has increased its
capacity from 15,000 MT in 2005-06 to 25,000 MT in 2007-08 and is expected to increase to 40,000<br />
MT by the end <strong>of</strong> 2008-09.<br />
Imports and Exports <strong>of</strong> Headliner fabrics<br />
The estimated import figures for headliners are as given below:-<br />
HS Code Description<br />
56039400<br />
HEADLINER NON-<br />
WOVEN<br />
FABRICS*<br />
Imports Imports<br />
Quantity (in Rs crore)<br />
2007-08(E) 2007-08(E)<br />
Approx. 0.25<br />
million sq m<br />
Rs 1.5 crore<br />
approx<br />
Source: IBIS, DGCIS, IMaCS Analysis<br />
The contribution <strong>of</strong> imports in the overall headliner fabrics <strong>consumption</strong> in India is very low. Almost<br />
100% <strong>of</strong> the Indian imports <strong>of</strong> Headliner fabrics are from Italy.<br />
The exports <strong>of</strong> headliner fabrics from India are negligible.<br />
Raw-materials and machinery<br />
Typically the headliners are non-woven <strong>technical</strong> <strong>textiles</strong> made <strong>of</strong> PSF, polypropylene or<br />
polyurethane core sprayed between two reinforcing layers. Needle loom is the key machinery for<br />
manufacturing headliners non-wovens. The needle looms are generally imported. One <strong>of</strong> the most<br />
famous needle punch machine manufacturers in the world is Dilo (Germany).
Insulation Felts<br />
Insulation felts, <strong>of</strong>ten known as NVH products (Noise, Vibration, and Harshness parts) are used for<br />
acoustic and thermal insulation in the automobiles. These are Bonnet liner, Outer dash, Wheelhouse,<br />
and Outer floor under shield. These parts not only provide noise protection inside the car but also a<br />
reduction in the noise emission outside. Uses <strong>of</strong> NVH parts in automobiles started after introduction<br />
<strong>of</strong> EURO norms in the sector.<br />
Product characteristics<br />
The NVH products or insulation felts are 100% polyester non-woven <strong>technical</strong> textile products. These<br />
products are classified based on the manufacturing process as needle-punched, phenolic resin bonded<br />
and thermoplastic. The felts are generally s<strong>of</strong>t and used with or without harder backing. The thermal<br />
insulation products provide dissipation <strong>of</strong> heat at high temperature areas in the engine and under car<br />
body. The NVH products combine noise and heat protection function into the integrated comfort<br />
system.<br />
Key growth drivers <strong>of</strong> Insulation felts industry<br />
The primary growth driver for the insulation felts is the sales <strong>of</strong> passenger cars, MUVs and SUVs<br />
(explained in the beginning <strong>of</strong> the Mobiltech segment). The insulation felt industry is expected grow<br />
in line with the automotive market.<br />
Consumption norms, market size and future forecast<br />
The insulation felt is a 100% polyester non-woven <strong>technical</strong> textile product. The usage varies based<br />
on the location and <strong>technical</strong> requirement. The usage varies typically from 12 kilograms in small cars<br />
to 15 kilograms in large vehicles.<br />
Insulation<br />
felts<br />
Unit UVS MPV<br />
kg 15 15<br />
Passenger cars Value<br />
A1 A2 A3 A4 A5 A6<br />
(Rs/kg)<br />
12 12 13 14 15 15<br />
103<br />
The current and future forecast <strong>of</strong> insulation felts domestic usage is given below:-<br />
Source: <strong>Industry</strong> survey
Insulation felts domestic usage 2007-08 2012-13<br />
Quantity 22,500 MT 48,000 MT<br />
Value Rs 232 crore Rs 494 crore<br />
Source: <strong>Industry</strong> survey, IMaCS Analysis<br />
The potential market for insulation felt industry in 2012-13 is estimated at Rs. 494 crore up from Rs.<br />
232 crore in 2007-08 (E). No inflationary increase has been assumed for the price <strong>of</strong> the material. In<br />
volume terms, the usage <strong>of</strong> insulation felt is expected to grow from 22,500 MT in 2007-08 to 48,000<br />
MT in 2012-13.<br />
Key manufacturers <strong>of</strong> insulation felts<br />
The major producers <strong>of</strong> insulation felts are Uniproducts India and Supreme Non-woven sister concern<br />
Supreme Treves Pvt. Limited. Uniproducts India has an installed capacity <strong>of</strong> 4.2 million kilograms<br />
and has annual sale <strong>of</strong> 4.1 million kilograms. The annual sales turnover from NVH products is around<br />
Rs. 42.57 crore.<br />
Manufacturer Year Production Sales Value Unit Price Installed<br />
Quantity (Rs crore) (Rs per kg) capacity<br />
Supreme Non- Non-woven 2007-08 15,000 MT 25,000 MT<br />
woven*<br />
products<br />
Uniproducts NVH<br />
products<br />
2006-07 3,510 MT 39.22 111.66 2,800 MT<br />
2007-08 4,136 MT 42.57 102.82 4,200 MT<br />
Source: Uniproducts India<br />
* Includes other non-woven products as well<br />
Automobile products account for around 50% <strong>of</strong> Supreme Non-woven production. The estimated<br />
capacity utilisation <strong>of</strong> Supreme Non-woven is around 60%. Supreme non-woven has increased its<br />
capacity from 15,000 MT in 2005-06 to 25,000 MT in 2007-08 and is expected to increase to 40,000<br />
MT by the end <strong>of</strong> 2008-09.<br />
Uniproducts increased its capacity <strong>of</strong> NVH products from 2,800 MT to 4,200 MT in 2006-07.<br />
Imports and Exports <strong>of</strong> Insulation Felts<br />
The Indian imports and exports <strong>of</strong> insulation felts for automobile usage are negligible.<br />
Raw-materials and machinery
The manufacturing process for NVH products is based on the raw materials used. The two broad<br />
manufacturing processes are for Non-Polyurethane based NVH (Non-PU) and Polyurethane based<br />
NVH products.<br />
The machinery used for manufacturing NVH components is primarily imported. The details are as<br />
given below:<br />
1. Opening and Blending machine – (Key supplier - Reisky and Schlese)<br />
2. Needle Loom – (Key supplier - Dilo (Germany))<br />
3. Foaming and Moulding machine<br />
4. Lamination machine<br />
5. Resin felt manufacturing machine<br />
6. Thermo-bond interlining manufacturing machine
Sunvisors / Sunblinds<br />
The sunvisors are located in the interiors <strong>of</strong> a four-wheeler just above the windshield. The sunvisors<br />
are used to block the light from the sun from entering through the windshield. The blinds can also be<br />
turned to the front side window to reduce lateral sun exposure. There are two sunvisors in a car, one<br />
for driver and the other for the co-passenger. However, the high end car models have up to four<br />
sunvisors.<br />
Product characteristics<br />
Sunvisor needs to effectively reduce the sun obstruction to the driver and passenger. Nowadays, a<br />
small mirror is also fitted on one <strong>of</strong> the two sunvisors (on one side). The blinds are primarily made <strong>of</strong><br />
three parts, the synthetic backbone made <strong>of</strong> polypropylene or kenaf fibres, scrim – coarse woven<br />
reinforcement fabric and upholstery – typically artificial leather.<br />
Key manufacturers <strong>of</strong> sunvisors in India<br />
The key manufacturers <strong>of</strong> automobile sun blinds are:<br />
1. Krishna Grupo Antolin Pvt. Ltd., Pune<br />
2. Mayur Industries Ltd., Haryana<br />
3. The Krishna Polymer Technologies, Noida<br />
Consumption norms, market size and future forecast<br />
The usage <strong>of</strong> sunvisors varies from 2-4 sunvisors per car based on vehicle model.<br />
Unit UVS MPV<br />
A1 A2<br />
Passenger cars<br />
A3 A4 A5 A6<br />
Value<br />
(Rs/unit)<br />
Sun blinds Nos 4 4 2 2 2 2 4 4 175<br />
Source: <strong>Industry</strong> survey<br />
The current and future forecast <strong>of</strong> sunvisors domestic usage is given below:-<br />
Sunvisors<br />
<strong>Domestic</strong> usage<br />
Quantity<br />
2007-08 2012-13<br />
4.23 million<br />
nos.<br />
8.83 million<br />
nos.<br />
Value Rs 74 crore Rs 154 crore<br />
Source: <strong>Industry</strong> survey, IMaCS Analysis<br />
The potential market for sunvisors industry in 2012-13 is estimated at Rs. 154 crore up from Rs. 74<br />
crore in 2007-08 (E). No inflationary increase has been assumed for the price <strong>of</strong> the sunvisor material.
The potential market for sunvisors in volume terms is expected to grow from 4.23 million nos. in<br />
2007-08 to 8.83 million nos. in 2012-13.<br />
Imports and Exports <strong>of</strong> sunvisors<br />
The estimated import figures for sunvisors are as given below:-<br />
HS Code Description<br />
Imports<br />
Quantity<br />
Imports<br />
(in Rs crore)<br />
2007-08(E) 2007-08(E)<br />
87089900 Sun visors RH/LH<br />
Approx. 0.2<br />
million nos.<br />
Rs 3.5 crore<br />
approx<br />
Source: IBIS, DGCIS, IMaCS Analysis<br />
Over 75% <strong>of</strong> sunvisors imports are from Korea followed by Czeck, Thailand, Sweden and Japan<br />
accounting for the remaining.<br />
The import and usage <strong>of</strong> sunscreens and sunblinds is very low (around Rs 25 lakhs per annum).<br />
The estimated export figures for sunvisors are as given below:-<br />
HS Code Description<br />
Exports<br />
Quantity<br />
Exports<br />
(in Rs crore)<br />
2007-08(E) 2007-08(E)<br />
87089900 Sun visors RH/LH<br />
Approx. 0.0005<br />
million nos.<br />
Rs 0.02 crore<br />
approx<br />
Source: IBIS, DGCIS, IMaCS Analysis<br />
The export <strong>of</strong> sunvisor is negligible however most <strong>of</strong> the automobile sunvisor exports from India are<br />
to Spain, Ethiopia and UAE.<br />
Raw materials<br />
The fibres <strong>of</strong> polypropylene, kenaf and polyethylene tetra fluoride or blend <strong>of</strong> these is used for<br />
formation <strong>of</strong> the core. The core is further reinforced with scrim fabric and then the unit is upholstered<br />
to for the sunvisor unit.<br />
Quality Control and standards in India/other countries<br />
The sunvisors are manufactured as per the specifications given by original equipment manufacturers.<br />
There is no set standard for this product.
Automotive Airbags<br />
Airbags are inflatable protective equipment which reduces injuries during an accident or impact in co-<br />
ordination with the seat belt.<br />
Product characteristics<br />
The airbags are manufactured in the following manner:-<br />
Fiber Yarn Fabric<br />
Module Assembly<br />
Cut/Sew<br />
Silicone/Others<br />
The yarn / fabric is primarily nylon 66 or polyamide 66, lighter denier, lower dpf and silicone coated.<br />
Approximately, 1.8 square meter <strong>of</strong> fabric is used per airbag module.<br />
Key growth drivers<br />
Airbag installation in Indian cars is not mandatory in India. The airbags are typically fitted only in the<br />
high-end cars. The low-end cars and M&HCV / LCV commercial vehicles do not have airbags. The<br />
high cost <strong>of</strong> airbags is the key reason behind lower usage <strong>of</strong> airbags. The airbag installation costs<br />
around Rs. 5000 per piece in addition to airbag sensor and installation cost <strong>of</strong> over Rs 5000 per piece.<br />
In addition, airbags, once inflated in case <strong>of</strong> any accident, have to be replaced.<br />
However, with increasing exports <strong>of</strong> passenger cars and increasing emphasis on safety, most <strong>of</strong> the car<br />
manufacturers have initialised installation <strong>of</strong> airbags for driver and co-passenger in the high end car<br />
models. In some cases, the installation <strong>of</strong> airbags is optional for the customer. The installations are set<br />
to increase with enforcement <strong>of</strong> the rules making airbags mandatory.<br />
Key airbag manufacturers<br />
There is no domestic manufacturer <strong>of</strong> automotive airbags in India and the requirement is primarily<br />
met through imports.<br />
Airbag<br />
Coating
Autoliv is global leader in airbag modules followed by TRW, Takata / Petri and Delphi. India’s<br />
leading seat belt assembly manufacturer Abhishek Auto Industries is entering into a joint venture with<br />
Key Safety Systems (KSS) to manufacture airbag modules and steering wheel modules.<br />
Consumption norms and the market size<br />
Around 50% <strong>of</strong> the car exports have airbags fitted, depending upon the geography <strong>of</strong> exports.<br />
Approximately, 1.8 square meter <strong>of</strong> fabric is used per airbag module. The installations <strong>of</strong> airbags in<br />
cars are expected to increase due to increase in awareness about safety.<br />
Automotive airbags<br />
Cars export in 2007-08 0.22 million growing at 25% y-o-y<br />
Cars production (Total) for domestic<br />
usage<br />
Cars production (A4 – A6) for domestic<br />
usage<br />
Penetration <strong>of</strong> airbags<br />
1.76 million<br />
49,923 (nos.)<br />
Demand for automotive airbags 2.25 lakh nos.<br />
Fabric usage per airbag 1.8 sq. m.<br />
Around 50% <strong>of</strong> exports and 7-8% <strong>of</strong><br />
cars for domestic usage<br />
Usage <strong>of</strong> airbag fabric 0.4 million sq. m.<br />
Source: SIAM, <strong>Industry</strong> survey, IMaCS Analysis<br />
The current and future forecast <strong>of</strong> airbags domestic usage is given below:-<br />
Automotive airbags<br />
<strong>Domestic</strong> usage<br />
2007-08 2012-13<br />
Automotive airbag volume 2.25 lakh nos. 6.5 million nos.<br />
Automotive airbag fabric<br />
Volume<br />
0.4 million sq. m.<br />
1.15 million sq.<br />
m.<br />
Automotive airbag fabric Value Rs 12 crore Rs 35 crore<br />
Source: <strong>Industry</strong> survey, IMaCS Analysis<br />
The potential market for airbag fabric industry in 2012-13 is estimated at Rs. 35 crore up from Rs. 12<br />
crore in 2007-08 (E). No inflationary increase has been assumed for the price <strong>of</strong> the material. In<br />
volume terms, the installation <strong>of</strong> airbag modules is expected to grow from 2.25 lakh modules in 2007-<br />
08 to 6.5 lakh modules in 2012-13.<br />
Imports and Exports <strong>of</strong> airbags<br />
The estimated import figures for airbags are as given below:-
HS Code Description<br />
87082900, 87089900,<br />
87089500<br />
87082900, 87089900,<br />
87089500, 87089400<br />
AIRBAG MODULE<br />
AIRBAGS, AIRBAG<br />
ASSEMBLY UNITS<br />
Imports Imports<br />
Quantity (in Rs crore)<br />
2007-08(E) 2007-08(E)<br />
Approx. 0.75 Rs 15 crore<br />
lakh nos. approx<br />
Approx. 1.5 Rs 50 crore<br />
lakh nos. approx<br />
Source: IBIS, IMaCS Analysis<br />
Almost 80% <strong>of</strong> the imports <strong>of</strong> Airbag assembly units and airbag modules are from Korea followed by<br />
around 10-15% from Czech and marginally from Germany & Mexico.<br />
Quality Control and Standards – There are no Indian standards.
Helmets<br />
Helmets are used as protective headgear for two wheelers. The typical motorcycle helmet has an inner<br />
layer <strong>of</strong> polystyrene or polypropylene foam and an outer layer made <strong>of</strong> plastic, glass, and other<br />
synthetic fibres. The chief purpose <strong>of</strong> a helmet is to absorb the impact <strong>of</strong> a crash and thus prevent<br />
primary injury to the brain, rather than preventing skull and face fractures. The outer shell prevents<br />
sharp objects from puncturing the skull and also protects the inner liner upon contact with the road.<br />
The inner foam lining is crushed following impact, thereby increasing the stopping time and distance<br />
<strong>of</strong> the helmet. This, in turn, limits the accelerative forces on the brain, reducing the chance <strong>of</strong> primary<br />
brain injury.<br />
Product characteristics<br />
The two types <strong>of</strong> helmets available are:<br />
1. Full face helmet<br />
2. Open face helmet<br />
The critical characteristics <strong>of</strong> the helmets are -- protection <strong>of</strong> head, clear vision through the visor,<br />
quick release chin strap and appropriate ventilation (in case <strong>of</strong> full face helmets). The outer shell is<br />
made from Acrylonitrile-Butadiene-Styrene (ABS) or Polypropylene or glass fibre plastic which is<br />
hard in nature. The inner side <strong>of</strong> the shell is expected to provide cushion to the rider and is made from<br />
regulated density concussion padding.<br />
Market dynamics and key growth drivers<br />
The sales <strong>of</strong> helmets are primarily driven by growth in the two-wheeler sales. The trend <strong>of</strong> the two-<br />
wheeler market is described below:<br />
Number <strong>of</strong> two wheeler sales in India<br />
(in million nos) 2002-03 2003-04 2004-05 2005-06 2006-07 2007-08<br />
<strong>Domestic</strong> Sales 4.8 5.36 6.21 7.05 7.87 7.25<br />
Exports 0.18 0.27 0.37 0.51 0.62 0.82<br />
Total Sales 4.99 5.63 6.58 7.57 8.49 8.07<br />
Source: SIAM<br />
In the last five years, the sale <strong>of</strong> two wheelers in the domestic market has increased by 8.5% CAGR<br />
and a similar growth <strong>of</strong> around 8% is expected for the next five years as well.<br />
The following cities account for around 20% <strong>of</strong> the two-wheelers on road.
(in million numbers)<br />
Sno City Number <strong>of</strong> on-road Two<br />
Wheelers in 2003-04<br />
1 Mumbai & Suburbs 1.11<br />
2 Pune 0.60<br />
3 Ahemdabad 0.75<br />
4 Chennai 1.01<br />
5 Bangalore 0.75<br />
6 Hyderabad 0.73<br />
7 Vizag 0.20<br />
8 Delhi 1.84<br />
9 Lucknow 0.39<br />
10 Ludhiana 0.41<br />
11 Indore 0.36<br />
12 Jamshedpur 0.21<br />
Source: Dept <strong>of</strong> road transport and highways, IMaCS Analysis<br />
The total estimated on-road two-wheelers and future projections are as given below:-<br />
(in million nos) 2004-05 2005-06 2006-07 2007-08 2008-09 2009-10 2010-11 2011-12 2012-13<br />
Total TW<br />
vehicle park<br />
40.7 46.5 52.9 58.5 64.9 72.0 79.9 88.7 98.5<br />
Source: SIAM, IMaCS Analysis<br />
Though the actual sales/vehicle-park might differ from projections on a year-to-year basis, over the<br />
long term, the projections are expected to hold true.<br />
Wearing helmets has been made compulsory across several states. The growth in helmet demand is<br />
expected to be more than the growth in two wheelers as more and more states/cities implement usage<br />
<strong>of</strong> helmets for riders and pillions compulsorily. In addition to the new helmets, considerable demand<br />
from the replacement market is expected as well.<br />
Existing market size and future forecast<br />
The current and future forecast <strong>of</strong> Helmet market in India is given below:-
Helmets market - <strong>Domestic</strong><br />
usage<br />
Quantity<br />
2007-08 2012-13<br />
16.7 million<br />
nos.<br />
27.6 million<br />
nos.<br />
Value Rs 250 crore Rs 759 crore<br />
Source: <strong>Industry</strong> survey, IMaCS Analysis<br />
The helmet market in India is estimated as Rs. 250 crore in 2007-08. By 2012-13, the average price <strong>of</strong><br />
a branded helmet is expected to increase from Rs 300 at present to around Rs 500. Thus, the total<br />
market size is expected to increase to around Rs 759 crore by 2012-13.<br />
Key players manufacturing helmets<br />
The size <strong>of</strong> the helmets industry in India was only around Rs 50 crore in 1997. The market was<br />
pegged at around Rs 100 crore in 2003-04 by the industry experts, <strong>of</strong> which only 20% was organised.<br />
The existing capacity <strong>of</strong> helmet manufacturers in India is around 18 million helmets per year. Of<br />
these, the 28 large players (BIS certified) account for around 50% <strong>of</strong> the market. The existing market<br />
<strong>of</strong> helmets is estimated as 16.7 million units and Rs 250 crore approx. The sharp increase in the<br />
helmets market size has been due to regulations forcing use <strong>of</strong> helmets.<br />
Consumers are shifting from low end to high end helmets. Therefore, various international players<br />
like KBC (price range from Rs 3,600 to Rs 11,500) and Sparx (price range from Rs. 3,600 to 5,600)<br />
are launching their helmets in India. The famous Indian brands <strong>of</strong> helmets are Spark, Wrangler,<br />
Steelbird etc.<br />
Quality Control and Standards<br />
The Bureau <strong>of</strong> Indian Standards (BIS) has made quality control mandatory for all helmets across<br />
India, although non-BIS-approved helmets are also available in the market. Now, all helmets sold<br />
across India are required to have an ISI mark — IS: 4151 — to meet BIS standards.<br />
Certain internationally followed standards are:<br />
• Economic Commission for Europe (ECE) is one <strong>of</strong> four regional economic commissions set up by<br />
the United Nations and not limited to the EU.<br />
• The Federal Government’s Department <strong>of</strong> Transportation (DOT) sets minimum standards that all<br />
helmets sold for motorcycling must meet. The standard, developed in 1974, is the Federal Motor<br />
Vehicle Safety Standard 218, but is commonly known as the DOT standard.<br />
• The Snell Memorial Foundation was founded in 1957 for William “Pete” Snell after he died from<br />
massive head trauma he sustained in a race car accident. It is a non-pr<strong>of</strong>it organization that is
focused on learning more about head injuries and how to prevent them. Snell standards are<br />
updated and tested every five years, forcing helmet makers to continually improve their products<br />
so that they will be approved by Snell standards. They have standards that apply to motorcycle,<br />
bike and automobile racing helmets, along with other protective headgear.
Nylon tyre cord fabric<br />
Nylon tyre cord fabric provides strength to a tyre. The tyre industry consumes nearly 98% <strong>of</strong> the total<br />
nylon tyre <strong>consumption</strong>. The nylon tyre cord fabric is 100% <strong>technical</strong> textile. Nylon tyre cord fabric<br />
gradually replaced the usage <strong>of</strong> rayon and polyester cords in the tyre industry.<br />
Product characteristics<br />
Nylon 6 grey and dipped tyre cord fabrics having high strength, fatigue resistance, impact resistance,<br />
high adhesion characteristics, are mainly used as reinforcements <strong>of</strong> bias tyres. The tyre cords are<br />
generally available with the fabric characteristics <strong>of</strong> 930dtex, 1400dtex, 1870dtex, 2100dtex. The<br />
critical specifications drive the characteristics such as Breaking strength, elongation, adhesion, ply<br />
twists and hot-air shrinkage.<br />
Market dynamics and growth drivers<br />
Tyre production in India (in ‘000 numbers) (including the replacement market for tyres)<br />
(in '000 numbers) 2000 - 01 2001 - 02 2002 - 03 2003 – 04 2004 - 05 2005 - 06 2006 - 07 2007-08<br />
Truck & Bus 8612 8474 9863 10821 11092 11941 12367 13137<br />
Passenger Car 6813 7481 8544 9959 11862 13605 14264 16437<br />
Jeep 1155 1247 1384 1440 1462 1272 1368 1467<br />
LCV 2108 2352 2844 3271 3945 4529 4820 5320<br />
Tractor Front 1186 1150 1125 1148 1311 1383 1754 1814<br />
Tractor Rear 852 785 825 842 1096 1134 1296 1234<br />
Tractor Trailer 277 320 470 415 408 596 823 886<br />
Animal Drawn Vehicle 511 488 456 295 197 325 381 409<br />
Scooter/Moped 9504 8682 10060 9442 10116 9574 9643 11604<br />
Motor Cycle 11196 12275 15654 16688 18127 21053 26079 27921<br />
Industrial 219 214 309 295 377 514 635 733<br />
Off the Road (OTR) 38 46 51 74 89 106 115 141<br />
Aero 0 0 0 0 0 0 0 0<br />
TOTAL 42471 43514 515585 54690 60082 66032 73545 81103<br />
Source: Automotive Tyre Manufacturers Association<br />
The tyre industry in India has been growing at around 12% CAGR for the last five years and is<br />
expected to grow at around 10% yoy in the future.<br />
Tyre <strong>Industry</strong> is witnessing a shift to radial tyres
Current level <strong>of</strong> radialisation in the tyre industry is around 20%. 95% <strong>of</strong> all passenger cars have radial<br />
tyres while 12% <strong>of</strong> LCVs have radial tyres and only 3% <strong>of</strong> M&HCV vehicles have radial tyres. In<br />
future, tyre manufacturers are expected to shift further from nylon tyre cord based tyres to radial tyres<br />
which do not need nylon fabric. In the next 5 years, the radialisation is expected to increase from 20%<br />
to around 40% in the next 5 years.<br />
Consumption norms and the market size<br />
Nylon tyre cord fabric constitutes 18% <strong>of</strong> the raw material cost and around 12-14% by weight <strong>of</strong> a<br />
tyre.<br />
Nylon tyre cord <strong>consumption</strong> norms (Tyre industry)<br />
Tyre production (MT) 11,35,000<br />
No <strong>of</strong> tyres produced (million) 81.1<br />
% <strong>of</strong> nylon tyre cord by weight 12-14%<br />
Market share <strong>of</strong> Nylon tyre cord 80%<br />
Total nylon tyre cord (MT) 118,000<br />
Source: Automotive Tyre Manufacturers Association, <strong>Industry</strong> survey, IMaCS Analysis<br />
The current and future forecast <strong>of</strong> tyre cord <strong>consumption</strong> is given below:-<br />
Nylon Tyre Cord<br />
<strong>Domestic</strong> usage<br />
2007-08 2012-13<br />
Quantity 118,000 MT 142,500 MT<br />
Value<br />
Rs 2,000 Rs 2,425<br />
crore crore<br />
Source: <strong>Industry</strong> survey, IMaCS Analysis<br />
The potential market for nylon tyre cord fabric in 2012-13 is estimated at Rs. 2,425 crore up from Rs<br />
2,000 crore in 2007-08 (E). No inflationary increase has been assumed for the price <strong>of</strong> nylon tyre<br />
cord. In weight terms, the market is expected to grow from 118,000 MT in 2007-08 to 142,500 MT in<br />
2012-13.<br />
Key manufacturers <strong>of</strong> nylon tyre cord
The production <strong>of</strong> nylon tyre fabric in India is limited to very few producers like SRF and Century<br />
Enka. India is a net importer <strong>of</strong> nylon tyre fabric. Around one-third <strong>of</strong> nylon tyre fabric <strong>consumption</strong><br />
is met through imports. The total shortfall <strong>of</strong> nylon tyre cord fabric in India is around 40,000-50,000<br />
MT in 2007-08.<br />
The production figures for major nylon tyre cord manufacturers Century Enka and SRF limited is as<br />
given below:-<br />
Manufacturer Year Quantity (MT) Value (Rs Unit Price Installed<br />
crore) (Rs) capacity (MT)<br />
Century Enka 2007-08 21,076 392 1,94,245 22000<br />
SRF 2007-08 48,248* 957 1,98,342 52880<br />
NRC Ltd 2006-07 8,078 148 1,87,631 12000<br />
Source: Capitaline<br />
* including Industrial yarn fabric<br />
SRF is setting up a new manufacturing unit to produce polyester yarns to be used for radial tyres. It<br />
will have a capacity <strong>of</strong> 14,500 MT a year and is expected to commence production by April 2009.<br />
Imports and Exports <strong>of</strong> nylon tyre cord fabric<br />
The import figures for nylon tyre cord / nylon tyre cord fabric is as given below:-<br />
HS Code Description<br />
59021010, 59021090<br />
59022010, 59022090,<br />
59029090<br />
NYLON TYRE CORD<br />
FABRIC / WARPSHEET<br />
POLYESTER OR RAYON<br />
TYRE CORD FABRIC<br />
Imports Imports<br />
Quantity (in Rs crore)<br />
2007-08(E) 2007-08(E)<br />
Approx. 45,000 Rs 750 - 850<br />
- 50,000 MT crore approx<br />
Approx. 5,000 Rs 55 crore<br />
MT approx<br />
Source: IBIS, IMaCS Analysis<br />
China accounts for 35-40% <strong>of</strong> the imports <strong>of</strong> nylon tyre cord fabric while Thailand, Indonesia and<br />
Taiwan for 15-20% each. Egypt, UAE & Belarus account for around 10% <strong>of</strong> the imports.<br />
The export figures for nylon tyre cord / nylon tyre cord fabric is as given below:-<br />
HS Code Description<br />
Exports<br />
Quantity<br />
Exports<br />
(in Rs crore)<br />
2007-08(E) 2007-08(E)<br />
59021010, 59021090 NYLON TYRE CORD Approx. 1,500 Rs 22 crore
59022010, 59022090,<br />
59029090<br />
FABRIC / WARPSHEET MT approx<br />
RAYON TYRE CORD Approx. 4,000 Rs 80 crore<br />
FABRIC<br />
MT approx<br />
Source: IBIS, DGCIS, IMaCS Analysis<br />
Indonesia accounts for over 80% <strong>of</strong> the exports <strong>of</strong> nylon tyre cord fabric while Thailand, Phillipines<br />
and Iran account for the rest. Japan accounts for around 60-70% <strong>of</strong> the exports <strong>of</strong> Rayon tyre cord<br />
fabric while Italy accounts for the rest.<br />
The exports <strong>of</strong> nylon tyre cord fabric are estimated to be Rs 29.4 crore in 2012-13.
Usage <strong>of</strong> <strong>technical</strong> <strong>textiles</strong> in airlines industry<br />
The Indian Aviation <strong>Industry</strong><br />
The Indian aviation industry was stagnant until a few years back due to excessive regulation, limited<br />
private participation, no service delivery innovation and higher travel costs. However, with the<br />
removal <strong>of</strong> regulatory barriers, growing proportion <strong>of</strong> consuming class <strong>of</strong> population, growth in<br />
tourism & business travel and entry <strong>of</strong> low-cost carriers (LCC), the growth in the sector has<br />
accelerated. The entry <strong>of</strong> LCC led fall in air travel fares and the demand soared. The number <strong>of</strong><br />
players in the aviation sector grew from just 2-3 to more than 10. The domestic traffic grew to about<br />
70 million in 2006-07 at a CAGR <strong>of</strong> 30% over the period 2004 to 2007.<br />
Air passenger traffic 2001-02 2002-03 2003-04 2004-05 2005-06 2006-07<br />
<strong>Domestic</strong> 26.4 28.9 32.1 39.9 51.0 70.6<br />
International 13.6 14.8 16.6 19.4 22.4 25.8<br />
Source: The Aviation Arena, way2Wealth, DGCA<br />
Over the last one year, due to increasing prices <strong>of</strong> air turbine fuel (ATF), the air fares have been rising<br />
steadily. The rise in air fares has resulted in the slow-down <strong>of</strong> passenger growth. According to<br />
Directorate General Civil Aviation (DGCA), the domestic air passenger growth has slowed down<br />
from around 43% in 2007 to 11% in March 2008. As a result, there is a lot <strong>of</strong> overcapacity in the<br />
overall market and airline operators are suffering from huge losses. Plagued with falling yields and<br />
excess capacity, airlines have initiated route rationalisation and consolidation.<br />
The fleet size and market share <strong>of</strong> the major domestic airlines is as given below:<br />
Airline Operator Fleet size Market share<br />
(in FY08) (July 2008)<br />
Jet Airways 52 23.5%<br />
Kingfisher Airlines 42 15.4%<br />
Indian Airlines 76 18.3%<br />
Jet Lite 24 8.3%<br />
Air Deccan 41 11.3%<br />
Indigo 17 10.5%<br />
SpiceJet 15 8.4%<br />
Paramount 12 1.6%<br />
Go Air 6 2.5%<br />
MDLR 0.2%<br />
TOTAL 285<br />
Source: Edelweiss Aviation Report, Karvy Aviation Sector Update<br />
The fleet size and market share <strong>of</strong> the major Indian airlines operating international flights is as given<br />
below:<br />
Airline Operator Fleet size
Jet Airways 20<br />
Air India 72<br />
Source: Air India, Jet Airways, Edelweiss Aviation Report, Karvy Aviation Sector Update<br />
Market Share <strong>of</strong> major airlines in India<br />
Others<br />
5%<br />
Source: DGCA<br />
As a result, <strong>of</strong> the slowdown, the airlines have reduced capacity in the recent past – Kingfisher<br />
Airlines reduced 20% <strong>of</strong> domestic capacity, Jet Airways reduced around 13% <strong>of</strong> domestic capacity<br />
and SpiceJet reduced 5 aircrafts from the fleet. The airlines are gradually shedding excess capacity in<br />
the domestics market. With current overcapacity, the there are no expansion plans for 2009 and<br />
several existing orders are being rescheduled or cancelled.<br />
Product characteristics <strong>of</strong> <strong>technical</strong> <strong>textiles</strong> used in Aircrafts<br />
Item Specifications<br />
Tea pot cover 100% Polypropylene Spunbonded<br />
Disposable Headrest<br />
cover<br />
70 GSM, 16 cms by 14 cms<br />
100% Polypropylene Spunbonded<br />
40-50 GSM for domestic flights and 60-<br />
90 GSM for international flights<br />
Headphone bag (premier) 100% Polypropylene Spunbonded<br />
Consumption norms and market sizing <strong>of</strong> aircraft disposables<br />
40 GSM, 22 cms by 24 cms<br />
The market size <strong>of</strong> Aircraft disposables have been estimated based on discussion with industry players<br />
and annual tender documents <strong>of</strong> Jet Airways. Though the industry has witnessed 25-30% growth, the<br />
growth in 2008 has slowed down to around 10%. We have assumed a growth rate <strong>of</strong> 15% for the<br />
future projections.<br />
SpiceJet<br />
9%<br />
Indigo<br />
9%<br />
Air India<br />
18%<br />
Jet<br />
Airways<br />
30%<br />
Kingfisher<br />
29%
The current and future forecast <strong>of</strong> aircraft disposables is given below:-<br />
Aircraft disposables<br />
<strong>Domestic</strong> usage<br />
Disposable Headrest covers<br />
Quantity<br />
Disposable Headrest covers<br />
Value<br />
Tea pot covers<br />
Quantity<br />
Tea pot covers<br />
Value<br />
Premier headphone bags<br />
Quantity<br />
Premier headphone bags<br />
Value<br />
2007-08 2012-13<br />
Around 15<br />
million nos.<br />
Around 30<br />
million nos.<br />
Rs 2 crore Rs 4 crore<br />
Around 1.5<br />
million nos.<br />
Rs 0.25<br />
crore<br />
Around 0.3<br />
million nos.<br />
Around 3<br />
million nos.<br />
Rs 0.5 crore<br />
Around 0.6<br />
million nos.<br />
Rs 0.4 crore Rs 0.8 crore<br />
Source: <strong>Industry</strong> survey, IMaCS Analysis<br />
The potential market for aircraft disposable headrest covers in 2012-13 is estimated at Rs. 4 crore up<br />
from Rs 2 crore in 2007-08 (E). No inflationary increase has been assumed for the price <strong>of</strong> the items.<br />
In volume terms, the market is expected to grow from 15 million nos. <strong>of</strong> in 2007-08 to 30 million nos.<br />
in 2012-13.<br />
The potential market for aircraft teapot covers in 2012-13 is estimated at Rs. 0.5 crore up from Rs<br />
0.25 crore in 2007-08 (E). No inflationary increase has been assumed for the price <strong>of</strong> the items. In<br />
volume terms, the market is expected to grow from 1.5 million nos. <strong>of</strong> tea-pot covers in 2007-08 to 3<br />
million nos. in 2012-13.<br />
The potential market for premier headphone bags in 2012-13 is estimated at Rs. 0.8 crore up from Rs<br />
0.4 crore in 2007-08 (E). No inflationary increase has been assumed for the price <strong>of</strong> the items. In<br />
volume terms, the market is expected to grow from 0.3 million nos. <strong>of</strong> premier headphone bags in<br />
2007-08 to 0.6 million nos. in 2012-13.<br />
The current and future forecast <strong>of</strong> other usages <strong>of</strong> <strong>technical</strong> <strong>textiles</strong> for aircrafts is given below:-<br />
Aircraft disposables<br />
<strong>Domestic</strong> usage<br />
Aircraft webbings<br />
Quantity<br />
Aircraft webbings<br />
Value<br />
Aircraft upholstery<br />
Quantity<br />
2007-08 2012-13<br />
Around 0.25<br />
million meters<br />
Around 0.5<br />
million meters<br />
Rs 2.5 crore Rs 5 crore<br />
Around 5,000<br />
meters<br />
Around 10,000<br />
meters
Aircraft upholstery<br />
Value<br />
Rs 0.45 crore Rs 0.9 crore<br />
Source: <strong>Industry</strong> survey, IMaCS Analysis<br />
The potential market for aircraft webbings in 2012-13 is estimated at Rs. 5 crore up from Rs 2.5 crore<br />
in 2007-08 (E). No inflationary increase has been assumed for the price <strong>of</strong> webbing. In volume terms,<br />
the market is expected to grow from 0.25 million meters <strong>of</strong> aircraft webbings in 2007-08 to 0.5<br />
million meters in 2012-13.<br />
The potential market for aircraft upholstery in 2012-13 is estimated at Rs. 0.45 crore up from Rs 0.9<br />
crore in 2007-08 (E). No inflationary increase has been assumed for the price <strong>of</strong> aircraft upholstery. In<br />
volume terms, the market is expected to grow from 5,000 meters <strong>of</strong> aircraft upholstery in 2007-08 to<br />
10,000 meters in 2012-13.<br />
Key players manufacturing airline disposables in India<br />
Chaitanya fibres and JMDI Group are the two key manufacturers <strong>of</strong> airline disposables. Due to strong<br />
margin pressure, Chaitanya Fibres, which was supplying around 0.5 million headrest covers has<br />
discontinued the supply.<br />
Imports & Exports <strong>of</strong> webbings for aircraft seat belts<br />
The import figures for webbings with application in aircrafts are as given below:-<br />
HS Code Description Imports Exports<br />
2007-08 2007-08<br />
54073090<br />
WEBBINGS - PARTS FOR<br />
AIRCRAFTS<br />
Around 0.15<br />
million meters<br />
Rs 1.5 crore<br />
approx.<br />
59022090<br />
WEBBINGS - PARTS FOR<br />
AIRCRAFTS<br />
Around 0.1<br />
million meters<br />
Rs 1 crore<br />
approx.<br />
Source: IBIS, IMaCS Analysis<br />
All the imports <strong>of</strong> these webbings are from USA. The exports <strong>of</strong> aircraft seat belt webbing from India<br />
are almost negligible.<br />
Imports & Exports <strong>of</strong> upholstery for aircrafts<br />
The import figures for Aircrafts upholstery are as given below:-<br />
HS Code Description Imports Imports<br />
2007-08(E) 2007-08(E)<br />
54034990<br />
UPHOLSTERY –<br />
AIRCRAFT MATERIAL<br />
Around 4,000<br />
meters<br />
Rs 0.35 crore<br />
approx.<br />
54034990 AIRCRAFT SEAT COVERS<br />
Around 2,000<br />
numbers<br />
Rs 0.10 crore<br />
approx.<br />
Source: IBIS, IMaCS Analysis
UK accounts for over 50% <strong>of</strong> the imports <strong>of</strong> the upholstery for aircrafts followed by Germany with<br />
30-35% share, USA with 10% share. Indonesia and Singapore account for the remaining imports<br />
(around 5%).<br />
The exports <strong>of</strong> aircraft upholstery from India are almost negligible.<br />
The direct import figures for aircraft seats (fully built) are as given below:-<br />
HS Code Description<br />
Exports<br />
(in MT)<br />
Exports<br />
(in Rs crore)<br />
2007-08 2007-08<br />
94011000 AIRCRAFT SEATS 1200 seats Rs 16 crore<br />
Source: IBIS, IMaCS Analysis<br />
Almost 85% <strong>of</strong> the direct seat exports to India are from Czech Republic and the remaining from<br />
Mexico, Sweden and Germany.<br />
Imports & Exports <strong>of</strong> disposable headrest covers for aircrafts<br />
The import figures for Aircrafts disposable headrest covers are as given below:-<br />
HS Code Description Imports Imports<br />
2007-08(E) 2007-08(E)<br />
48114100, 48189000 HEADREST COVERS<br />
Around 1.5<br />
million nos.<br />
Rs 0.19 crore<br />
approx.<br />
63022200, 63049300,<br />
63049230, 63029900<br />
HEADREST COVERS<br />
Around 2.4<br />
million nos.<br />
Rs 0.21 crore<br />
approx.<br />
Source: IBIS, IMaCS Analysis<br />
China and Thailand account for most <strong>of</strong> the imports <strong>of</strong> Headrest covers followed by UK. The exports<br />
<strong>of</strong> Headrest covers from India are almost negligible.<br />
Usage <strong>of</strong> <strong>technical</strong> <strong>textiles</strong> in Railways<br />
The Indian Railways<br />
The Indian Railways is an over than 150 years old, one <strong>of</strong> the largest rail networks in the world, has<br />
contributed significantly to the economic growth and the transport needs <strong>of</strong> the country. The<br />
developmental role <strong>of</strong> the railways is particularly important in the context <strong>of</strong> both passenger and<br />
freight sectors. In 2007, Indian Railways carried 17 million passengers and two million tonnes <strong>of</strong><br />
freight traffic daily over its ~63,327 kilometre network.<br />
The key Indian Railways statistics are as given below:<br />
Particulars 2007 Figures<br />
Route Length 63,327 kms
Locomotives 8,153<br />
Passenger Service Vehicles 45,350<br />
Other coaching vehicles 5,905<br />
Wagons 207,719<br />
Railway Stations 6,909<br />
Source: Indian Railways Year Book 2007<br />
Around 2,000 to 3,000 passenger coaches were added in each <strong>of</strong> the last 3 years to the Railways<br />
network.<br />
Railways – Passenger coaches addition 2005-06 2006-07 2007-08<br />
Central Railway 92 103 156<br />
Eastern Railway 129 141 175<br />
East Central Railway 169 167 309<br />
East Coast Railway 97 107 82<br />
Northern Railway 270 372 304<br />
North Central Railway 27 34 75<br />
North Eastern Railway 59 74 201<br />
Northeast Frontier Railway 108 123 155<br />
North Western Railway 132 48 208<br />
Southern Railway 225 300 198<br />
South Central Railway 157 112 173<br />
South Eastern Railway 153 45 213<br />
South East Central Railway 86 78 50<br />
South Western Railway 109 186 223<br />
Western Railway 134 236 203<br />
West Central Railway 75 30 97<br />
Total 2022 2156 2822<br />
Source: Indiastat<br />
The annual growth <strong>of</strong> passenger coaches is around 3-4%. Approximately there are 72 berths in non air<br />
conditioned coaches and around 64 in air conditioned coaches.<br />
Railways seat cover fabric<br />
In Railways, the material for seat berths fabric is the key <strong>technical</strong> textile usage. Material used in the<br />
berths is polyurethane foam and rexine cloth.<br />
Product characteristics<br />
Rexine material is used in railway seat covers. The rexine material is constructed from single or<br />
multiple poly vinyl film layers with choice <strong>of</strong> backing cloth. Synthetic cloth like polyester and rayon<br />
is used. The rexine material is fire retardant coated fabric.<br />
Consumption norms and market size
The typical usage 9 <strong>of</strong> the material usage in a berth is as given below:<br />
1. Rexine packing – 272x515 sq. cm.(1unit)<br />
2. Rexine packing – 235x515 sq. cm. (4units)<br />
3. Side rexine – 150x600 sq. cm.(2 units)<br />
4. Top rexine – 1450x1900 sq. cm.(1 unit)<br />
5. Rexine – 500x1750 sq. cm. (1 unit)<br />
The coach construction data and hence, rexine requirement <strong>of</strong> Railway Coach Factory (RCF) is as<br />
given below:<br />
RCF Data Berths/Coach 2004-05 2006-05 2006-07 2007-08<br />
Non-AC 72 879 923 780 998<br />
AC 55 322 340 486 482<br />
Total Coaches - 1201 1263 1266 1480<br />
Non-AC<br />
Berths<br />
- 63288 66456 56160 71856<br />
AC Berths - 17710 18700 26730 26510<br />
Total Berths - 80998 85156 82890 98366<br />
Rexine<br />
(Quantity sq.<br />
m.)<br />
4.4 sq.m/berth 359160 377597 367549 436173<br />
Rexine (Value<br />
in Rs crore)<br />
Rs. 30/sq. m. 1.08 1.13 1.10 1.31<br />
Source: Rail Coach Factory (RCF), IMaCS Analysis<br />
The annual growth <strong>of</strong> passenger coaches is around 3-4%.<br />
The current and future forecast <strong>of</strong> rexine <strong>consumption</strong> for Railway coaches berth covers is given<br />
below:-<br />
Seat covers - Railways<br />
<strong>Domestic</strong> usage<br />
Quantity<br />
2007-08 2012-13<br />
0.43 million<br />
sq. m.<br />
0.51 million<br />
sq. m.<br />
Value Rs 1.3 crore Rs 1.54 crore<br />
Source: <strong>Industry</strong> survey, IMaCS Analysis<br />
The potential market for railways seat cover fabric in Railways in 2012-13 is estimated at Rs. 1.3<br />
crore up from Rs 1.54 crore in 2007-08 (E). No inflationary increase has been assumed for the price<br />
9 Analysis based on data/information received from Railways. IMaCS has made appropriate adjustments because <strong>of</strong><br />
insufficient data.
<strong>of</strong> the fabric. In volume terms, the market is expected to grow from 0.43 million sq. m. in 2007-08 to<br />
0.51 million sq. m. in 2012-13.<br />
Key Suppliers <strong>of</strong> Rexine<br />
The suppliers to RCF are primarily domestic manufactures as given below:<br />
1. Aurora Vinyl Pvt. Ltd., New Delhi<br />
2. Premier Polyfilms Ltd., Ghaziabad - Capacity <strong>of</strong> 16200 MT<br />
3. Delkon Textile Pvt. Ltd., Haryana<br />
4. Prabhat Industries, Gujarat<br />
Quality control and standards in India<br />
The material follows the standard set by Research Design and Standards Organisation (RDSO). The<br />
standards followed for the railway seat material is RDSO spec. C-9503 and RDSO spec. C-9901.
PACKTECH<br />
Packtech includes several flexible packing material made <strong>of</strong> textile used for packing various goods for<br />
industrial, agricultural, consumer and other goods. It ranges from polymer based bags used for<br />
industrial packing to jute based sacks used for packaging food grains and packaging used for tea. This<br />
packaging (excluding jute) is also referred to as flexible packaging materials.<br />
The <strong>technical</strong> textile products covered under Packtech are as give below:-<br />
• Polyolefin Woven Sacks (excluding FIBC)<br />
• FIBC<br />
• Leno bags<br />
• Wrapping fabric<br />
• Jute Hessian and Sacks (including Food grade jute bags)<br />
• S<strong>of</strong>t luggage products (TT component)<br />
• Tea-bags (filter paper)<br />
Technical <strong>textiles</strong> <strong>consumption</strong> under Packtech is estimated at around Rs 14,067 crore. Woven sacks<br />
(excluding FIBC) account for around 50% <strong>of</strong> the <strong>technical</strong> <strong>textiles</strong> <strong>consumption</strong> under Packtech<br />
followed by Jute hessian and sacks (including Food grade jute bags) with around 30% share. FIBC<br />
and wrapping fabrics account for around 20% <strong>of</strong> the total usage. Usage <strong>of</strong> <strong>technical</strong> <strong>textiles</strong> in s<strong>of</strong>t<br />
luggage products, leno bags and tea-bags is less than 5% <strong>of</strong> the total usage in Packtech.<br />
Most <strong>of</strong> the demand for these products is satisfied by domestic production with imports <strong>of</strong> only<br />
around Rs 86 crore. Exports <strong>of</strong> Packtech products (<strong>technical</strong> <strong>textiles</strong> component) from India has been<br />
estimated as Rs 563 crore.<br />
The domestic <strong>consumption</strong> <strong>of</strong> <strong>technical</strong> <strong>textiles</strong> under Packtech is expected to increase from around<br />
Rs 14,067 crore in 2007-08 to around Rs 25,913 crore by 2012-13.The demand for the packaging<br />
products is dependent on the industrial growth. In the medium term (next 5 years), the packaging<br />
industry is expected to achieve growth at the rate <strong>of</strong> 13% year on year. The polymer based segment<br />
containing products like woven sacks, FIBC, leno bags and wrapping fabric are expected to grow at a<br />
CAGR <strong>of</strong> 17% till 2012-13.<br />
The maximum growth is expected in the FIBC segment which is used for bulk packaging segment.<br />
Use <strong>of</strong> FIBC will also increase with the increase in exports. The share <strong>of</strong> FIBC in the total Packtech<br />
market is expected to double over the next 5 years. Moreover, the Leno bags which are mainly used
for packaging onion and potato are very effective medium for packaging and their application is<br />
expected to increase in the packaging <strong>of</strong> various other fruits and vegetables.<br />
S<strong>of</strong>t goods industry also has high growth potential and has been growing at around 25%.<br />
Summary <strong>of</strong> the market-sizing for Packtech<br />
Polyolefin<br />
Woven<br />
Sacks<br />
(excluding<br />
FIBC)<br />
FIBC<br />
Leno bags<br />
Wrapping<br />
fabric<br />
Jute Hessian<br />
and Sacks<br />
(including<br />
Food grade<br />
jute bags)<br />
S<strong>of</strong>t luggage<br />
products<br />
(TT<br />
component)<br />
Tea-bags<br />
filter paper<br />
TOTAL<br />
Quantity<br />
Value<br />
Quantity<br />
Value<br />
Quantity<br />
Value<br />
Quantity<br />
Value<br />
Quantity<br />
Value<br />
Quantity<br />
Value<br />
Quantity<br />
Value<br />
Value<br />
Production Imports Exports<br />
0.641<br />
million MT<br />
Rs 6,725<br />
crore<br />
0.175<br />
million MT<br />
Rs 1,750<br />
crore<br />
2007-08 2012-13<br />
- -<br />
- -<br />
-<br />
-<br />
0.025<br />
million<br />
MT<br />
Rs 250<br />
crore<br />
<strong>Domestic</strong><br />
Consumption<br />
0.641 million<br />
MT<br />
Rs 6,725<br />
crore<br />
0.15 million<br />
MT<br />
Rs 1,500<br />
crore<br />
<strong>Domestic</strong><br />
Consumption<br />
1.127 million<br />
MT<br />
Rs 12,950<br />
crore<br />
0.45 million<br />
MT<br />
Rs 5,000<br />
crore<br />
5,400 MT 5,400 MT 10,800 MT<br />
Rs 57 crore<br />
0.128<br />
million MT<br />
Rs 1,350<br />
crore<br />
1.33<br />
million MT<br />
Rs 4,325<br />
crore<br />
11 million<br />
sq m<br />
Rs 142<br />
crore<br />
Rs 0.5<br />
crore<br />
Rs 0.5<br />
crore<br />
- -<br />
- -<br />
0.01<br />
million<br />
MT<br />
Rs 50<br />
crore<br />
2.5 million<br />
sq m<br />
Rs 30<br />
crore<br />
0.05<br />
million<br />
MT<br />
Rs 300<br />
crore<br />
1 million<br />
sq m<br />
Rs 12<br />
crore<br />
Rs 57 crore Rs 125 crore<br />
0.128 million<br />
MT<br />
Rs 1,350<br />
crore<br />
1.291 million<br />
MT<br />
Rs 4,075<br />
crore<br />
12.5 million<br />
sq m<br />
0.256 million<br />
MT<br />
Rs 2,950<br />
crore<br />
1.1 million<br />
MT<br />
Rs 3,947<br />
crore<br />
38 million sq<br />
m<br />
Rs 160 crore Rs 500 crore<br />
7,100 MT 800 MT - 7,900 MT 17,650 MT<br />
Rs 195<br />
crore<br />
Rs 14,544<br />
crore<br />
Rs 5 crore - Rs 200 crore Rs 441 crore<br />
Rs 86<br />
crore<br />
Rs 563<br />
crore<br />
Rs 14,067<br />
crore<br />
As per ECTT report, the potential market sizing for 2007-08 was as given below:-<br />
Rs 25,913<br />
crore<br />
Export<br />
Potential<br />
-<br />
Rs 441<br />
crore<br />
Rs 0.7<br />
crore<br />
-<br />
Rs 383<br />
crore<br />
Rs 15.3<br />
crore<br />
-<br />
Rs 840<br />
crore
Market size<br />
(ECTT report)<br />
Polyolefin woven<br />
sacks including FIBC<br />
S<strong>of</strong>t Luggage<br />
products<br />
(TT component)<br />
Food grade jute bags<br />
Jute sacks and<br />
hessian<br />
2001-02 2007-08 (P)<br />
Quantity 0.45 million MT 0.91 million MT<br />
Value Rs 2,925 crore Rs 5,915 crore<br />
Quantity 5 million meters 11.5 million meters<br />
Value Rs 60 crore Rs 138 crore<br />
Quantity 5,118 MT 12,650 MT<br />
Value Rs 17.96 crore Rs 44.28 crore<br />
Quantity 53,700 MT 112,000 MT<br />
Value Rs 194.72 crore Rs 400 crore<br />
TOTAL Value Rs 3,197.68 crore Rs 6,497.28 crore<br />
Capital Employed and Pr<strong>of</strong>itability <strong>of</strong> key players <strong>of</strong> Packtech<br />
Company Name<br />
Capital Employed<br />
(Rs crore)<br />
Net Pr<strong>of</strong>it Margin<br />
(%)<br />
2006-07 2007-08 2006-07 2007-08<br />
Aristocrat Luggage Ltd. [Merged] 15.0 NA 3.0% NA<br />
Ashok Polymers Ltd. 8.5 11.3 0.8% 0.7%<br />
Bajaj Steel Inds. Ltd. 37.8 48.3 1.3% 3.2%<br />
Birla Corporation Ltd. 788.7 1100.8 18.0% 19.5%<br />
Budge Budge Co. Ltd. 51.9 52.5 0.3% 1.1%<br />
Cheviot Co. Ltd. 153.0 158.1 14.2% 11.8%<br />
East India Commercial Co. Ltd. 53.0 58.9 4.1% 3.9%<br />
Emmsons International Ltd. 20.8 50.8 1.7% 1.7%<br />
Flexituff International Ltd. 74.8 NA 4.9% NA<br />
Gopala Polyplast Ltd. 42.5 38.3 1.0% -3.1%<br />
Hooghly Mills Projects Ltd. 109.9 NA 0.2% NA<br />
Indian Products Ltd. 28.3 37.5 14.5% 3.6%<br />
Jai Corp Ltd. 410.9 2642.0 20.2% 27.6%<br />
Kamarhatty Co. Ltd. 14.9 23.5 1.2% 1.2%<br />
Landale & Clark Ltd. 0.1 0.2 20.0% 42.9%<br />
Ludlow Jute & Specialities Ltd. 18.7 24.8 1.1% 1.8%<br />
Naihati Jute Mills Co. Ltd. 6.7 7.4 0.3% 1.2%<br />
Neo Corp Intl. Ltd. 30.1 43.6 1.4% 6.2%<br />
Reliance Jute Mills (International) Ltd. 9.1 8.3 0.2% 3.2%
Company Name<br />
Capital Employed<br />
(Rs crore)<br />
Net Pr<strong>of</strong>it Margin<br />
(%)<br />
2006-07 2007-08 2006-07 2007-08<br />
Rishi Packers Ltd. 18.4 15.6 1.6% -4.6%<br />
Safari Industries (India) Ltd. 13.5 13.9 0.2% 1.3%<br />
Samsonite South Asia Pvt. Ltd. 66.1 81.6 9.6% 10.6%<br />
Texplast Industries Ltd. 11.4 11.2 21.6% -2.0%<br />
Tulsyan N E C Ltd. 106.8 132.0 1.4% 2.4%<br />
V I P Industries Ltd. 149.3 152.4 3.1% 3.7%<br />
Winsome International Ltd. 5.4 8.2 3.0% 3.7%<br />
Source: Prowess Database, IMaCS Analysis<br />
Packtech segment <strong>of</strong> <strong>technical</strong> <strong>textiles</strong> is estimated to provide employment to 3.1 lakh people 10 <strong>of</strong><br />
whom number <strong>of</strong> <strong>technical</strong> 11 employees is estimated at 1.4 lakh and number <strong>of</strong> non-<strong>technical</strong><br />
employees is estimated at 1.7 lakh.<br />
Impediments to growth<br />
The usage <strong>of</strong> jute hessian and sacks is expected to decline marginally over the next 5 years. Due to the<br />
South Asian Free Trade Agreement (SAFTA), import <strong>of</strong> jute goods in India from Bangladesh has<br />
gone up considerably because <strong>of</strong> complete withdrawal <strong>of</strong> import duty effective from 1st January, 2008<br />
which is posing a severe threat to Indian jute goods market. Discontinuance <strong>of</strong> External Market<br />
Assistance is also negatively impacting the jute exports. Moreover, there is a continuous threat from<br />
the substitute synthetic packaging industry as the trend is shifting towards synthetic counterparts.<br />
Further, the smaller players are also hindered by their inability to cope with the volatility in raw-<br />
material prices as the raw material (HDPE, PP) costs form a significant percentage <strong>of</strong> total costs.<br />
Indian Raffia <strong>Industry</strong><br />
The Raffia <strong>Industry</strong> can be categorized into six main categories depending upon the type <strong>of</strong> woven<br />
bag made. They are namely:<br />
• Polyolefin Woven Sacks (excluding FIBC)<br />
• Flexible Intermediate Bulk Containers (FIBC)<br />
10 Employment has been estimated based on the analysis <strong>of</strong> primary and secondary data available for the<br />
<strong>technical</strong> textile manufacturers. IMaCS has made appropriate adjustments because <strong>of</strong> insufficient data.<br />
11 Technical includes managerial staff and skilled labour whereas non-<strong>technical</strong> includes unskilled labour.
• Tarpaulins<br />
• Leno bags<br />
• Lamination<br />
• Wrapping fabric<br />
• Others<br />
Source: AIFTMA –32 nd Annual session Report, IMaCS Analysis<br />
For around 50% <strong>of</strong> the applications above, Polypropylene (PP) is used exclusively (cement, etc.). For<br />
around 7.5% applications, (Polymer, lamination etc.), Poly Ethylene (PE) is used. The remaining 42%<br />
is an overlap <strong>of</strong> PP & PE where either can be used (Fertilizer, wrapping fabric, chemicals, cattle feed,<br />
food grains, sugar etc).<br />
Expected Growth rates<br />
Break-up <strong>of</strong> the Indian Raffia <strong>Industry</strong> in 2006<br />
Lamination<br />
1.00%<br />
Leno<br />
0.20%<br />
Tarpaulins<br />
6.50%<br />
Wrapping<br />
fabric<br />
8.90%<br />
FIBC<br />
10.40%<br />
Others<br />
7.10%<br />
PP/HDPE<br />
Woven Sacks<br />
65.90%<br />
Category Expected Growth Category Expected Growth<br />
PP/HDPE Woven Sacks 11% Leno 15%<br />
FIBC 25% Lamination 12%<br />
Tarpaulins 12% Wrapping fabric 25%<br />
Others 12%<br />
Source: <strong>Industry</strong> survey, IMaCS Analysis<br />
The Indian Raffia industry has crossed the 1 million MT mark. This industry is expected to grow at a<br />
CAGR <strong>of</strong> 15%. The maximum growth potential is seen in the FIBC, woven sacks exports, leno bags<br />
& wrapping fabric. The future expected size <strong>of</strong> the industry is shown in the chart below.
The current and future forecast <strong>of</strong> Raffia industry is given below:- below:<br />
Raffia industry size 2007-08 2012-13<br />
Quantity<br />
1.07 million<br />
MT<br />
2.1 million<br />
MT<br />
Value<br />
Rs 11,250<br />
crore<br />
Rs 24,200<br />
crore<br />
Source: <strong>Industry</strong> survey, IMaCS Analysis<br />
The average average price price <strong>of</strong> one kg kg <strong>of</strong> the output output has increased increased to to Rs Rs 105 105 from from Rs Rs 65 three years years back. back. This This is<br />
due to to the the higher higher petroleum petroleum prices. prices. The The price price rise is expected to slow down in the coming years. We<br />
have considered 2% y-o-y y price increase as the prices in the last few years have shown an increasing<br />
trend.<br />
in '000 MT<br />
2500<br />
2000<br />
1500<br />
1000<br />
500<br />
Key manufacturers<br />
Though the the Raffia Raffia industry industry is spread all over India, it is mainly concentrated around the region which<br />
has major fertilizer and cement players like the states <strong>of</strong> Gujarat, Maharashtra, Punjab, Rajasthan,<br />
Karnataka, MP MP and and Tamil Tamil Nadu. Though Though there are are several small scale units, there are a few big<br />
players with with capacity as high as as 36,000 36,000 MT MT per per annum. Thus the player player size size ranges from 200 200 MTPA<br />
to 36,000 MTPA.<br />
Manufacturer Year<br />
0<br />
654<br />
Texplast Inds. 2007-08<br />
Tulsyan NEC 2007-08<br />
Shankar Package 2006-07<br />
Rishi Packers 2006-07<br />
816<br />
Indian Raffia <strong>Industry</strong><br />
933<br />
1,070<br />
1,218<br />
1,390<br />
1,592<br />
1,827<br />
2005 2006 2007 2008 2009 2010 2011 2012 2013 2014<br />
Source: <strong>Industry</strong> survey, IMaCS Analysis<br />
Quantity Value<br />
(Rs crore)<br />
Unit Price<br />
1,849.42 MT 16.85 Rs 91.11/kg<br />
11,109 MT 104.15 Rs 93.75/kg<br />
6,139 MT 99.12 Rs 123.32/kg<br />
1,909 MT 16.35 Rs 85.64/kg<br />
2,103<br />
2,427<br />
Installed<br />
capacity<br />
2,836 MT<br />
20,541 MT<br />
4,200 MT
Neo Corp Intern<br />
2006-07<br />
2007-08<br />
7,612 MT 86.68 Rs 113.87/kg 5,200 MT<br />
10,800 MT<br />
Ashok Polymers 2006-07 7,309 TPA<br />
(Production)<br />
NA NA 9,060 TPA<br />
Bajaj Steel Inds 2007-08 795.46 MT 7.52 Rs 94.53/kg 11,250 MT<br />
Deccan Polypacks 2006-07 NA 30.38 NA 3,243 MT<br />
KG Petrochem 2007-08 NA 12.38 NA NA<br />
Marvel Inds. 2005-06 6,709.21 MT 49.7 Rs 70.07/kg 5,820 MT<br />
Mewar Polytex 2007-08 2,797.45 MT NA NA NA<br />
Narendra Plastic 2006-07 6,928.83 MT 57.94 Rs 83.62/kg 12,000 MT<br />
Pankaj Polymers 2007-08 2,298.54 MT 22.05 Rs 95.93/kg 6,695 MT<br />
Polyspin Exports 2007-08 3,144.49 MT 34.52 Rs 109.77/kg NA<br />
Promact Plastics 2006-07 NA NA NA 6,750 MT<br />
Karnavati Alfa<br />
(Sacks)<br />
2006-07 41.72 million pcs 2.52 Rs 6.04/pc NA<br />
Karnavati Alfa<br />
(Other products)<br />
2006-07 1,247 MT 5.47 Rs 43.85/kg NA<br />
Jai Corp Ltd. 2007-08 13,148 MT 132.06 Rs 100.44/kg 57,380 MT<br />
Sah Polymers 2006-07 2,280 MT<br />
Sh. Jagdamba Pol 2006-07 180.56 MT 2.33 Rs 129.04/kg NA<br />
Virgo Polymers 2006-07 3,424 MT 33.02 Rs 96.42/kg 4,960 MT<br />
Ultramarine Pig. 2007-08 710 MT 6.93 Rs 97.6/kg 1,500 MT<br />
Gujarat Raffia 2006-07 1,750 MT 16 Rs 92.6/kg 4,440MT<br />
Gujarat Craft 2006-07 73 MT 0.63 Rs 86.3/kg 1,800 MT<br />
Veer Group 2007-08 36,000 MT<br />
Gopala Polyplast 2007-08 158.4 mn pcs<br />
(Production<br />
12,140 MT)<br />
12,500 MT<br />
Oswal Agloimpex 2007-08 24,000 MT<br />
Daman Polyfabs 6,900 MT<br />
Arwin Tex<br />
Industries<br />
3,900 MT<br />
PVN Plastics Ind 4,920 MT<br />
Kandoi Fabrics<br />
Pvt.Ltd<br />
3,480 MT<br />
Kandoi Polytex<br />
Pvt.Ltd<br />
1,020 MT<br />
Wopolin Plastics 2005-06 6,838 MT 58.54 Rs 85.61/kg 11,000 MT<br />
Source: Capitaline, Annual reports, Company Websites, <strong>Industry</strong> survey<br />
Other players in the Raffia industry are:<br />
• Flexituff International Limited, Pithampur<br />
• Bardanwala Plastics Pvt. Ltd., Jamnagar<br />
• Dura Syntex Ltd, Ahmedabad<br />
• Gujarat Dyestuff Ind P Ltd, Ahmedabad<br />
• Garrison Polysacks, Baroda<br />
• Eastern Synpacks
• Kanpur Plastipack, Kanpur<br />
• Dhoot Compack, Ahmednagar<br />
• Pet Fiber, Daman<br />
• Lamifab Industries<br />
• Jakhotia Plastics Pvt. Ltd., Hyderabad<br />
• Texplast Industries Ltd, Mumbai<br />
• TPI India Ltd., Mumbai<br />
• J B Packaging, Ahmedabad<br />
• India Packaging, Bangalore<br />
• Supreme Polymer, Jaipur.<br />
• Commercial Syn Bag, Indore<br />
• Svar Polymers, Ahmedabad<br />
• Vindhya Polymers, Ahmedabad<br />
• Times Pack, Kolkata<br />
• Bajaj Plastics Ltd., Nagpur<br />
• SPL Inds.<br />
• Victory Lamin.<br />
• Suniti Commerc.<br />
• Mayur Extrusion, Ahmedabad<br />
• Mayur Polypacks Pvt. Ltd., Ahmedabad<br />
Besides the ones mentioned above, there are various other players spread across the country.
Polyolefin Woven Sacks (excluding FIBC)<br />
Product Characteristics<br />
HDPE Bag Capacity Weight <strong>of</strong> the HDPE Bag (100% TT)<br />
50 kgs 110 – 116 grams<br />
Source: <strong>Industry</strong> survey, IMaCS Analysis<br />
Cement bags on an average weigh 70g and fertilizer bags 130g.<br />
Material PP / HDPE<br />
WOVEN BAG FABRIC DETAILS<br />
Fabric Weave 5x5 to 14x14 per sq. in. OR 20x20 to 56x56 per sq. dm.<br />
Tape Specification Standard 2.5 mm. width.<br />
Denier: 500 D to 2000 D<br />
Fabric Colour Natural, Milky or coloured<br />
Additives Ultra Voilet Stabilized. TiO2, CaCO3 or antislip coated or as specified.<br />
Lamination Laminated or Unlaminated<br />
APPLICATIONS Fertilizers, Cement, Sugar, Food grains, Salt, Flour, Cattle Feed, Seeds, Sand, Chemicals<br />
The various advantages that HDPE/PP bags have conventional packing materials are:<br />
• Higher Strength<br />
• Light Weight<br />
• Minimal Seepage<br />
• Moisture Pro<strong>of</strong><br />
• Long Lasting (Durable)<br />
• Cheaper (as it can be reused)<br />
Market dynamics and key growth drivers<br />
Polyolefin (HDPE/PP) woven sacks are versatile packing materials used extensively in the packing <strong>of</strong><br />
cement, fertilizers, thermo plastic raw materials, food grains, sugar etc. The list <strong>of</strong> user-industries<br />
where they are used is:<br />
1. Cement<br />
2. Fertilizers<br />
3. Chemicals<br />
4. Food Grains<br />
5. Cattle Feed<br />
6. Salt<br />
7. Sugar<br />
8. Polymers<br />
9. Sacks - Export
10. Others<br />
Expected Growth rates <strong>of</strong> end-user industries<br />
Source: AIFTMA –32 nd Annual session Report, IMaCS Analysis<br />
Category Expected Growth Category Expected Growth<br />
Cement 12% Polymers 4%<br />
Fertilizers 10% Cattle Feed 8%<br />
Chemicals 10% Salt 5%<br />
Food Grains 6% Sugar 4%<br />
Sacks - Export 25%<br />
Source: <strong>Industry</strong> survey, IMaCS Analysis<br />
PP/HDPE printed sandwich bags are made by sandwiching PP and HDPE. They have a very good<br />
appearance and are used for packaging costlier products like pesticides, seeds, wheat flour, high-end<br />
chemicals, etc. They may also be used for secondary packaging <strong>of</strong> smaller 1kg bags.<br />
Market Size<br />
End user industries <strong>of</strong> PP/HDPE Woven sacks in India in<br />
2006<br />
Cement<br />
49%<br />
Fertilizers<br />
25%<br />
Chemicals<br />
7%<br />
Sugar<br />
1%<br />
The HDPE bags manufactured in India are used for domestic <strong>consumption</strong> as well as exported to<br />
Europe and US. The Woven sacks industry in India is expected to grow at a CAGR <strong>of</strong> 11% and reach<br />
a size <strong>of</strong> almost 1.127 million MT in the year 2012-13 from 0.641 million MT in 2007-08.<br />
The current and future forecast <strong>of</strong> woven sacks <strong>consumption</strong> is given below:-<br />
Food Grains<br />
6%<br />
Polymers<br />
5%<br />
Sacks - Export<br />
4%<br />
Cattle<br />
Feed<br />
2%<br />
Market size for woven sacks 2007-08 2012-13<br />
Quantity 0.641 million MT 1.127 million MT<br />
Salt<br />
1%
Value Rs 6,725 crore Rs 12,950 crore<br />
Exports <strong>of</strong> woven sacks<br />
The estimated export figures for woven sacks are as given below:-<br />
HS Code Description*<br />
Exports<br />
Quantity<br />
63053900 PP Nonwoven Sacks 53,200 pcs<br />
Source: <strong>Industry</strong> survey, IMaCS Analysis<br />
Exports<br />
(in Rs crore)<br />
2007-08(E) 2007-08(E)<br />
Less than Rs 0.1<br />
crore<br />
Source: IBIS, DGCIS, IMaCS Analysis<br />
* Other woven sack exports are included in FIBC exports<br />
The HDPE bags manufactured in India are used for domestic <strong>consumption</strong> as well as exported to<br />
Europe and US. The key exports destinations are Germany and Netherlands.<br />
Key raw-material suppliers<br />
The major raw material (polymer granules) suppliers in India are:<br />
1. Reliance Industries Ltd.(including IPCL)<br />
2. GAIL (India) Ltd.<br />
3. Haldia<br />
4. Others<br />
Reliance is the largest player for PP.<br />
The prices <strong>of</strong> all the players for raw material are more or less similar so the customers are usually<br />
flexible in their choice, depending upon who is able to provide with regular supply. The industry is<br />
facing a raw material shortage due to which it is not able to reach its true potential.<br />
Key machinery suppliers for manufacturing woven sacks in India<br />
The main machine required for woven sacks manufacturing is the Shuttle Loom. The main suppliers<br />
<strong>of</strong> these looms in India are:<br />
o Lohia Starlinger Limited<br />
o J. P. Industries<br />
o Kabra Extrusiontechnik Ltd. (KET) – Kolsite
o Windsor Machines Limited<br />
Quality Control and Standards<br />
• IS 6899:1997 Textiles - High density polyethylene (HDPE) woven fabrics<br />
• IS 8069:1989 High density polyethylene (HDPE) woven sacks for May packing pesticides<br />
[amalgamating IS 8069(Part 2):1981]<br />
• IS 9755:2003 Textiles - High density polyethylene (HDPE)/Polypropylene (PP) woven sacks<br />
for packing fertilizers<br />
• 9 IS 11652:2000 Textiles - Woven sacks for packing cement - High density polyethylene/<br />
Polypropylene<br />
• IS 12100:1987 High density polyethylene (HDPE) woven sacks for packing flour<br />
• IS 14252:2003 Textiles -High Density Polyethylene (HDPE)/Polypropylene (PP) woven bags<br />
for filling sand<br />
• IS 14887:2000 Textiles - High density polyethylene (HDPE)/ polypropylene (PP) woven<br />
sacks for packing food grains<br />
• IS 14968:2001 Textiles - High density polyethylene (HDPE)/polypropylene (PP) woven sacks<br />
for packing 50 kg/25 kg sugar
Flexible Intermediate Bulk Containers (FIBC)<br />
Flexible Intermediate Bulk Containers (FIBC), popularly known as “Jumbo Bags”, is similar to the<br />
HDPE/PP bags but that <strong>of</strong> a larger size. FIBC’s are one <strong>of</strong> the most cost effective and ideal types <strong>of</strong><br />
packaging for shipping and storing dry bulk products. They can be produced from either tubular or<br />
flat polypropylene (PP) woven fabrics. These fabrics can be coated or uncoated and vary in terms <strong>of</strong><br />
weights depending upon the requirements <strong>of</strong> the Safe Working Load (SWL), or Safety Factor (SF).<br />
There are three types <strong>of</strong> FIBC bags<br />
• Panel Type<br />
• Circular woven<br />
• Baffle type (Square bags)<br />
The general bag specifications used in the industry are as follows:<br />
Capacity<br />
(cubic feet)<br />
Empty size<br />
width (inches) X<br />
depth (inches)<br />
Filled diameter<br />
(inches)<br />
5 to 20 29 X 29 to 31 X 31 38<br />
21 to 75 35 X 35 to 37 X 37 46<br />
76 and above 41 X 41 to 43 X 43 53<br />
In general the approximate weight <strong>of</strong> FIBCs is as follows:<br />
Type <strong>of</strong> bag Weight in grams<br />
Builder bag 900-1200<br />
Technical bag 1800-2200<br />
Speciality bag 1800-2400<br />
Applications<br />
For higher bulk density products<br />
or smaller weight requirements<br />
Most common sizes for all<br />
products. Used in truck shipments<br />
and export containers<br />
For smaller bulk density products<br />
or where height restrictions occur.<br />
Used for rail shipments<br />
Source: <strong>Industry</strong> survey, IMaCS Analysis<br />
These bags have capacities ranging from 500-4000 kgs. The weight <strong>of</strong> fabric varies from 180-275<br />
gsm. FIBCs can vary from 900 gms to 3 kgs in weight depending upon the bag properties and weight<br />
to be carried.<br />
FIBC Bag Capacity Weight <strong>of</strong> the FIBC Bag (100% TT)<br />
500 kgs 1-2 kg
Advantages <strong>of</strong> FIBC:<br />
• Low cost <strong>of</strong> material handling from the manufacturer to the end user, inclusive <strong>of</strong> wastage <strong>of</strong><br />
material<br />
• Easy filling and discharge<br />
• Savings in loading/unloading time due to ease <strong>of</strong> handling<br />
• Low weight packing for transport<br />
• Built in safety factor <strong>of</strong> at least 5:1 on nominal load<br />
• Transportation <strong>of</strong> empty FIBCs is cheap and space saving<br />
• No requirement <strong>of</strong> pallets when compared to small bags – self supporting<br />
• Good chemical and organic resistance<br />
• Eco-friendly, since product is recyclable<br />
• Can be used for storage in open air (if UV stabilised)<br />
Market dynamics and key growth drivers<br />
It is used in bulk packaging <strong>of</strong><br />
• Polymers, such as PET and PVC<br />
• Petrochemicals, such as DMT, PTA and polyester chips<br />
• Minerals, such as bentonite, alumina, ebonite, magnesite, mineral ores like nickel<br />
• Agro-products, such as wheat, rice, starch, lactose and sugar<br />
• Chemicals, such as carbon black, dyes and intermediates and fertilisers<br />
• Oil cakes (powder form)<br />
• Detergents<br />
• Oat meal<br />
• Clay, mica and feldspar<br />
• Cement<br />
• Pharmaceuticals<br />
• Fish meal<br />
The bulk packaging is done usually for long distance transportation like exports. As the exports <strong>of</strong> the<br />
above mentioned items increasing from India, the demand for FIBC will also increase. Moreover<br />
FIBC is also directly exported, the exports <strong>of</strong> which are growing sharply.<br />
Market Size and future forecast<br />
The market for these FIBC Jumbo bags is estimated as around Rs. 1,500 crore in 2007-08 and is<br />
expected to cross Rs 5,000 crore by 2012-13. We have considered 2% y-o-y price increase as the
prices in the last few years have shown an increasing trend. Due to the high awareness about its<br />
advantages and higher exports, the FIBC production in India is expected to grow at over 20% y-o-y.<br />
Many <strong>of</strong> the existing regular HDPE/PP bag manufacturers are now moving to Jumbo bags. Currently,<br />
FIBC produced in India is primarily exported. The key exports markets are USA and Europe, which<br />
comprise approximately 2/3rd <strong>of</strong> the global demand. There is a small market in Australia as well. The<br />
requirement <strong>of</strong> FIBC in India is primarily in West Bengal by Mitsubishi PTA and South Asian<br />
Petrochemicals with a combined requirement <strong>of</strong> 675,000 pieces per year. With Mitsubishi gearing up<br />
for a new PTA plant in Haldia by end <strong>of</strong> 2008, the requirement is likely to go up to 1 million pieces <strong>of</strong><br />
FIBC per year. The other consumers <strong>of</strong> FIBC in India are large chemical companies like Birla<br />
Cellulosic, Lion Chemicals, Gujarat Heavy Chemicals, etc. their combined annual requirement will be<br />
<strong>of</strong> the order <strong>of</strong> 100,000 pieces per year. The domestic demand for FIBC in India is likely to grow at 7-<br />
8% p.a. in line with industrial growth rate.<br />
The current and future forecast <strong>of</strong> FIBC <strong>consumption</strong> is given below:-<br />
Market size for FIBC 2007-08 2012-13<br />
Quantity 0.15 million MT 0.45 million MT<br />
Value Rs 1,500 crore Rs 5,000 crore<br />
Imports & Exports <strong>of</strong> FIBC<br />
The estimated import figures for FIBC are as given below:-<br />
HS Code Description<br />
63053200,<br />
63053300<br />
FIBC<br />
Source: <strong>Industry</strong> survey, IMaCS Analysis<br />
Imports<br />
Quantity<br />
Imports<br />
(in Rs crore)<br />
2007-08(E) 2007-08(E)<br />
1700 - 1800<br />
pieces<br />
Rs 0.30 crore<br />
Source: IBIS, DGCIS, IMaCS Analysis<br />
* Note: It also includes woven sacks<br />
The imports <strong>of</strong> FIBC are very few. Around 90% <strong>of</strong> the imports are from Germany and the rest from<br />
China.<br />
The estimated export figures for FIBC are as given below:-<br />
HS Code Description<br />
Exports<br />
Quantity<br />
Exports<br />
(in Rs crore)<br />
2007-08(E) 2007-08(E)
63053200,<br />
63053300<br />
Rs 250 crore<br />
FIBC 13 million pieces<br />
approx.<br />
Source: IBIS, DGCIS, IMaCS Analysis<br />
* Note: It also includes woven sacks<br />
Around 15% <strong>of</strong> the exports take place to USA and Germany. Spain, UK, France & Italy each have a<br />
share <strong>of</strong> around 10% in the exports <strong>of</strong> FIBC from India. Small quantities are also exported to various<br />
other countries like Australia, Canada, Belgium, Egypt etc. The exports <strong>of</strong> FIBC are estimated to<br />
grow at 12% CAGR to reach a size <strong>of</strong> Rs 441 crore by 2012-13.<br />
Key machinery suppliers for manufacturing FIBC in India<br />
The main machine required for FIBC manufacturing is the Shuttle Loom. The main suppliers <strong>of</strong> these<br />
looms in India are:<br />
• Lohia Starlinger Limited<br />
• J. P. Industries<br />
• Kabra Extrusiontechnik Ltd. (KET) – Kolsite<br />
• Windsor Machines Limited<br />
Quality Control and Standards<br />
FIBCs are usually issued with individual test certificates to the Safe Working Load and Safety Factor.<br />
There are specified standards for performance evaluation <strong>of</strong> FIBCs. These include the following:<br />
• Cyclic top lift test<br />
• Compression / stack test<br />
• Drop and topple test<br />
• Tear test<br />
• Vibration test<br />
• Righting test<br />
• UV stability test
Leno Bags<br />
Leno bags are excellent for packing & preserving vegetables like potato, onion, ginger, garlic,<br />
cabbage etc. and fruits like pineapple, citrus fruits, raw mango, coconut etc.<br />
Product Characteristics<br />
The Leno bags have widths between 20cm to 72cm. The length also varies as per the<br />
customer’s requirements. The mesh again is as per requirement with a maximum <strong>of</strong> 574 tapes<br />
in the warp in different colours. Leno bags on an average weigh 50g (or less).<br />
Size (In cm) Application<br />
Width x height<br />
56.0 x 105.0 50 Kg Potato/ Onion<br />
45.8 x 84.0 25 Kg Potato/ Onion<br />
30.5 x 66.0 10 Kg Potato / Onion<br />
The Leno Bag is made <strong>of</strong> netted fabric <strong>of</strong> virgin Polypropylene (PP) with colour Masterbatch.<br />
Advantages <strong>of</strong> a Leno Bag<br />
• Superior aesthetics<br />
• Excellent mechanical properties<br />
• Chemically Inert<br />
• Ease in handling & storage<br />
• Reuse & recyclable<br />
• Cost Effective<br />
Market dynamics and key growth drivers<br />
There is great potential for the leno bags in India and few reasons <strong>of</strong> the same are mentioned below:<br />
• Suitable for dry skin vegetables (Potato (3 rd biggest producer), Onion, Garlic etc.)<br />
• India is the 2 nd biggest producer <strong>of</strong> fruit and vegetables in the world, which has still not been<br />
captured by Leno bags<br />
• Suitable for cold storage<br />
• High output from a single loom: Output <strong>of</strong> single loom = 3.3 MT/month
Market Size and future forecast<br />
The current and future forecast <strong>of</strong> Leno bags <strong>consumption</strong> is given below:-<br />
Market size for Leno bags 2007-08 2012-13<br />
Quantity in ‘000s 5.4 MT 10.8 MT<br />
Value Rs 57 crore Rs 125 crore<br />
Source: <strong>Industry</strong> survey, IMaCS Analysis<br />
The size <strong>of</strong> the Leno bags industry today is very small - around Rs 57 crore, but, is expected to grow<br />
at over 12% CAGR and reach a size <strong>of</strong> Rs 125 crore by 2012-13. In India, there are about 1000 Leno<br />
looms.<br />
Imports & Exports <strong>of</strong> Leno Bag<br />
The estimated import figures for Leno Bag are as given below:-<br />
HS Code Description<br />
Imports<br />
Quantity<br />
63053300 Leno Bag 4 million pieces<br />
Most <strong>of</strong> the leno bags imports are from China.<br />
The estimated export figures for leno bag are as given below:-<br />
HS Code Description<br />
Imports<br />
Value<br />
2007-08(E) 2007-08(E)<br />
Rs 0.5 crore<br />
approx<br />
Source: IBIS, DGCIS, IMaCS Analysis<br />
Exports<br />
Quantity<br />
Exports<br />
Value<br />
2007-08(E) 2007-08(E)<br />
63053900 Leno Fabric 1.5 million meters<br />
Source: IBIS, DGCIS, IMaCS Analysis<br />
Most <strong>of</strong> the exports <strong>of</strong> leno fabric are to Uruguay.<br />
Exports <strong>of</strong> Leno bag are estimated to grow to Rs 0.7 crore by 2012-13.<br />
Key machinery suppliers for manufacturing Leno bags in India<br />
Rs 0.5 crore<br />
approx<br />
The Leno Bags are made <strong>of</strong> netted fabric <strong>of</strong> virgin Polypropylene (PP) with colour Masterbatch.
The main machine required for leno bags manufacturing is the Loom. The main suppliers <strong>of</strong> these<br />
looms in India are:<br />
• Lohia Starlinger Limited<br />
• J. P. Industries<br />
• Kabra Extrusiontechnik Ltd. (KET) – Kolsite<br />
• Windsor Machines Limited<br />
Quality Control and Standards<br />
DOC.TXD 23(906) Textiles- Polypropylene (PP)/ High Density Polyethylene (HDPE) Woven Leno<br />
Sacks for Packing <strong>of</strong> Fruits and Vegetables<br />
Future Opportunities in Leno bags industry:<br />
• Suitable for dry skin vegetables (Potato (3 rd biggest producer), Onion, Garlic etc.)<br />
• India is the 2 nd biggest producer <strong>of</strong> Fruit and Vegetables in the world, which has still not been<br />
captured by Leno<br />
• Suitable for cold storage<br />
• High output from a single loom: Output <strong>of</strong> single loom = 3.3 MT/month
Wrapping Fabric<br />
Wrapping fabric is made out <strong>of</strong> HDPE/PP, cotton canvas, etc. Unlaminated PP/HDPE Woven Fabric<br />
is mainly used for wrapping <strong>of</strong> paper rolls, paper bundles, steel coils, tyres, yarn cones etc.<br />
Product Characteristics<br />
Wrapping fabric weighs 50 to 200 gsm and its size varies from 20 to 210 cms. The fabric is generally<br />
packed in roll form and can be run on automatic cutting and stitching machines.<br />
Clear Woven Sheets (Natural Woven Laminated Sheets) are used for packing <strong>of</strong> used clothes etc.<br />
These sheets are see through and are mainly used as a wrapping material. The most common size is<br />
40" * 54" with side lamination and weighs up to 100 grams.<br />
Lumber Cloth is a wide width fabric used to cover huge logs <strong>of</strong> wood. It can either be one side or both<br />
side laminated. It can be printed or non-printed as is available in roll form.<br />
Market dynamics and key growth drivers<br />
These fabrics are widely used in industries such as paper bundles, wrapping <strong>of</strong> paper rolls, steel coils,<br />
yarn cones, tyres etc. These fabrics can be utilized with automatic cutting & stitching machines for<br />
manufacturing bags too.<br />
The current and future forecast <strong>of</strong> Wrapping fabric <strong>consumption</strong> is given below:-<br />
Market size for Wrapping fabric 2007-08 2012-13<br />
Quantity 0.128 million MT 0.256 million MT<br />
Value Rs 1350 crore Rs 2950 crore<br />
Source: <strong>Industry</strong> survey, IMaCS Analysis<br />
The current size <strong>of</strong> the wrapping fabric industry in India is around Rs 1,350 crore and is expected to<br />
be almost Rs. 2950 crore by 2012-13 growing at a rate <strong>of</strong> 15% pa.<br />
Quality Control and Standards<br />
IS 6899:1997 Textiles - High density polyethylene (HDPE) woven fabrics
S<strong>of</strong>t Luggage<br />
The luggage industry is classified into hard and s<strong>of</strong>t luggage. Hard luggage are mainly the large travel<br />
bags made from moudled plastic. S<strong>of</strong>t luggage is made out <strong>of</strong> woven fabrics like nylon and polyester.<br />
It comprises <strong>of</strong> uprights, totes, duffle and sky bags which can be with or without wheels and handles.<br />
The s<strong>of</strong>t luggage today is becoming very popular due to the ease <strong>of</strong> carry as it is light and flexible. It<br />
includes handbags, military backpacks, athletic backpacks, wallets, briefcases and other s<strong>of</strong>t sided<br />
luggage items.<br />
Product Characteristics<br />
Outer dimensions <strong>of</strong> a s<strong>of</strong>t luggage bag vary from 460mmX340mmX160mm to<br />
790mmX620mmX280mm. The size <strong>of</strong> a small s<strong>of</strong>t suitcase can vary from 20” to 31”. A standard 64”<br />
fabric used for s<strong>of</strong>t luggage weighs around 350 grams.<br />
Market dynamics and key growth drivers<br />
Out <strong>of</strong> the total luggage industry, 40% is hard luggage while 60% belongs to the s<strong>of</strong>t goods. Due to<br />
increasing pressure from input costs in recent months, prices <strong>of</strong> moulded luggage are on an upward<br />
spiral. Prices <strong>of</strong> polypropylene, the primary raw material, have shot up by over 100% in the past one<br />
year. Polypropylene makes up around 75% <strong>of</strong> the raw material pie for hard luggage. Hence, more and<br />
more people are shifting from hard luggage to s<strong>of</strong>t goods. In the s<strong>of</strong>t goods market, around 60% <strong>of</strong><br />
the market belongs to the unorganised sector. The price <strong>of</strong> a s<strong>of</strong>t luggage in the organized market<br />
ranges from Rs 800 to Rs. 9,000 depending upon its size, raw material, etc.<br />
Most luggage and travel bags companies in India are following international trends and designs<br />
closely because they are aware that the buyer is becoming more conscious <strong>of</strong> design and exclusive<br />
patterns looking luggage/baggage. With more and more people travelling, manufacturers, exporters<br />
and suppliers <strong>of</strong> handbags, bags, luggage and travel accessories ensure that each and every luggage<br />
item are given away with ample safety features, theft-pro<strong>of</strong>, sturdy and strong.<br />
The current and future forecast <strong>of</strong> S<strong>of</strong>t Luggage is given below:-<br />
Particulars<br />
% <strong>of</strong> s<strong>of</strong>t luggage industry in total luggage 60%<br />
Value <strong>of</strong> textile in the total value <strong>of</strong> s<strong>of</strong>t goods 15%<br />
Average price <strong>of</strong> fabric used in s<strong>of</strong>t luggage Rs 130 per sq m<br />
Share <strong>of</strong> organised sector in s<strong>of</strong>t luggage industry 40%<br />
Expected growth rate <strong>of</strong> the organised segment 23%<br />
Expected growth rate <strong>of</strong> the unorganised segment 28%
The size <strong>of</strong> the s<strong>of</strong>t luggage industry in India today is estimated as Rs 1080 crore. The s<strong>of</strong>t luggage<br />
industry in India is expected to grow at a rate <strong>of</strong> around 25% to reach a size <strong>of</strong> over Rs 3300 crore by<br />
2012-13. Higher growth is expected from the unorganised sector as compared to the organised in the<br />
initial 2-3 years due to the high price differential. Later, the quality conscious customers will switch<br />
from the unorganised to the organised segment.<br />
Key manufacturers<br />
Market size for s<strong>of</strong>t luggage 2007-08 2012-13<br />
Value Rs 1,080 crore Rs 3,300 crore<br />
Quantity <strong>of</strong> Technical Textile 12.5 million sq m 38 million sq m<br />
Value <strong>of</strong> Technical Textile Rs 160 crore Rs 500 crore<br />
Source: <strong>Industry</strong> survey, IMaCS Analysis<br />
Manufacturer Year Quantity Value*<br />
Price<br />
Installed<br />
(million pieces) (Rs crore) (Rs per unit) capacity<br />
VIP industries 2007-08 NA 552 NA NA<br />
Universal Luggage 2006-07 NA 77.40 NA NA<br />
Safari Industries 2007-08 NA 62.45 NA NA<br />
Source: Capitaline, Company Annual Reports, Company websites, <strong>Industry</strong> Survey<br />
*These are Net Sales figures which includes hard luggage and other goods as well.<br />
Universal luggage (Aristocrat) has now been amalgamated with VIP<br />
S<strong>of</strong>t goods market is highly unorganised. In the organised segment, the leading players are VIP,<br />
Samsonite and Safari. VIP’s portfolio <strong>of</strong> brands includes V.I.P., Aristocrat, Alfa, Skybags and Delsey.<br />
During the fiscal year ended March 31, 2008, Aristocrat Luggage Limited and Quality Plastics<br />
Limited were amalgamated with the company. In the organised sector, VIP is the market leader with<br />
almost 60% <strong>of</strong> the market share whereas Samsonite leads in the premium segment. Samsonite’s global<br />
revenues in the year 2006-2007 were US$ 1,070 million, out <strong>of</strong> which 7% were from India. More than<br />
the competition amongst each other like VIP, Samsonite, Safari face bigger competition from<br />
unorganised players due to cost advantage.<br />
Imports & Exports <strong>of</strong> s<strong>of</strong>t luggage<br />
The estimated import figures for s<strong>of</strong>t luggage are as given below:-
HS Code* Description<br />
42021110/20/30/40/50/60/90,<br />
42022210/20/30/90, 42022910/90,<br />
42021910/20/30/40/60/90, 42021190,<br />
42022110/20/90,<br />
42021210/20/30/40/50/60/80/90,<br />
42023110/20/90, 42023290, 42029900,<br />
42029200<br />
Imports<br />
Quantity<br />
S<strong>of</strong>t goods 2.5 million pieces<br />
Imports<br />
(in Rs crore)<br />
2007-08(E) 2007-08(E)<br />
Rs 200 crore (TT<br />
component <strong>of</strong><br />
around Rs 30<br />
crore)<br />
Source: IBIS, DGCIS, IMaCS Analysis<br />
*The above codes constitute over 95% <strong>of</strong> imports<br />
** These are the imports under the 4202 HS code only, but the industry believes the<br />
imports <strong>of</strong> these goods are much higher than the number mentioned above.<br />
Maximum imports (over one third) are under the HS code <strong>of</strong> 42021290. Over 62% <strong>of</strong> the total imports<br />
take place from China, next highest contributor is Hongkong around 14% and France with 12% share.<br />
Imports also take place from countries like Italy, Singapore, Vietnam, Malaysia, UK etc.<br />
About 20% <strong>of</strong> the fabric used for manufacturing s<strong>of</strong>t luggage in India is also imported primarily from<br />
China. These fabrics are mainly <strong>of</strong> polyester 600D.<br />
The estimated export figures for s<strong>of</strong>t luggage are as given below:-<br />
HS Code Description<br />
42021110/20/30/40/50/60/90,<br />
42022210/20/30/90, 42022910/90,<br />
42021910/20/30/40/60/90, 42021190,<br />
42022110/20/90,<br />
42021210/20/30/40/50/60/80/90,<br />
42023110/20/90, 42023290,<br />
42029900, 42029200<br />
S<strong>of</strong>t Goods<br />
Exports<br />
Quantity<br />
Exports<br />
(in Rs crore)<br />
2007-08(E) 2007-08(E)<br />
1.75 million<br />
pieces<br />
Source: IBIS, DGCIS, IMaCS Analysis<br />
Rs 85 crore<br />
(TT component <strong>of</strong><br />
around Rs 12<br />
crore)<br />
UK and USA each have a share <strong>of</strong> around 25% in the exports <strong>of</strong> s<strong>of</strong>t goods from India. Other major<br />
countries to which the exports are around 5% each are UAE, France, Italy, Australia, Germany and<br />
Israel. In the year 2012-13 the s<strong>of</strong>t luggage exports are estimated to be Rs 15.3 crore.<br />
Raw Material<br />
Synthetic fabrics made out <strong>of</strong> nylon (70, 42, 840, 1680 D) / polyester (600, 1200, 1800D) filament<br />
yarns are the major raw material for this industry. There are various variants <strong>of</strong> fabric which are used
like ballistic pro<strong>of</strong>, abrasion resistant or fire retardant material, these special kinds <strong>of</strong> fabrics usually<br />
cost higher and thus the end products are expensive. Nylon though more expensive than polyester it<br />
has proved to be more durable and hence is more popular. Other fabrics like canvas and coated<br />
fabrics (artificial leather) are also used.
Jute Hessian and Sacks (including Food grade jute bags)<br />
Jute Hessian<br />
Jute Hessian also termed as Burlap is a finer quality jute fabric that has been long used as the most<br />
preferred packaging material for all kinds <strong>of</strong> goods. Hessian is used for bags and many other coarse<br />
fabric uses, such as wrappers, wall coverings, etc. Presently, shopping bags are being made out <strong>of</strong><br />
hessian fabrics. It is also used in the upholstery and home furniture. Also available in "dyed" or<br />
"bleached" form and treated with vegetable oil, Burlap meets the latest international standards for<br />
food safety.<br />
Product characteristics<br />
A plain weave cloth made wholly <strong>of</strong> Jute with single warp and weft interwoven, weighing not more<br />
than 576 g/m 2 . Hessian fabrics are lighter than sacking fabrics.<br />
Jute Sacks<br />
A range <strong>of</strong> heavy jute fabrics either in plain or twill weaves manufactured by using coarse jute fibre in<br />
larger percentage than used for manufacturing tarpaulin, hessian or such light fabrics.<br />
Sacking refers to the coarser and heavier cloth, used primarily for sacks for packing materials, which<br />
do not need special protection, but has higher weight.<br />
Jute bagging material is in demand because <strong>of</strong> the openness <strong>of</strong> the weave, which allows air to<br />
circulate while protecting the contents.<br />
Sacking bags, specifically used for the purpose <strong>of</strong> storing agro-based products, are known as Hydro<br />
carbon free bags that have been treated with vegetable oils to destroy the harmful effect <strong>of</strong><br />
hydrocarbons. Thus sacking bags have great demand not just in the cement industry but also in the<br />
agro-based industries.<br />
Different categories <strong>of</strong> sacking are:-<br />
• A-Twill<br />
• B-Twill<br />
• L-Twill<br />
• D.W. Flour<br />
• D.W. Salt
• D. W. Nitrates<br />
• Heavy Cees<br />
• Light Cees<br />
• Sydney Woolpacks<br />
• Australian Woolpacks<br />
• Australian Cornsacks<br />
• New Zealand Cornsacks<br />
• New Zealand Woolpacks<br />
• Fine Twill Cloth<br />
• Cement Bags<br />
Product characteristics<br />
Either plain or twill weave cloth made wholly <strong>of</strong> jute, inter-woven and weighing not less than 407<br />
g/m 2 .<br />
Twill<br />
The weave that produces diagonal patterns on the surface <strong>of</strong> the cloth. In the Jute<br />
industry, generally 2 x 1 simple twill weave is used.<br />
A-Twill Cloth A double warp, 2/1-twill weave sacking jute cloth weighing 750 g/m 2<br />
B- Twill Cloth A double warp 2/1-twill weave sacking jute cloth weighing 643 g/m 2<br />
L- Twill Cloth A double warp twill weave sacking cloth weighing approx. 716 g/m 2<br />
Oslo Twill Cloth A twill sacking cloth for making bags <strong>of</strong> about 108 cm width weighing about 534 g/m 2<br />
Brattice Cloth Hessian fabrics, which after rot and firepro<strong>of</strong>ing is used in mines as windscreens and for<br />
ventilation purposes.<br />
Heavy Cee A double warp plain weave sacking jute cloth having 68 ends/dm and 35 picks/dm and<br />
weighing 673 g/m 2<br />
The difference between hessian and sacking is in the quality <strong>of</strong> the cloth and the jute used for its<br />
production, the difference being primarily one <strong>of</strong> fineness, the former being made <strong>of</strong> finer grade jute,<br />
the latter <strong>of</strong> coarser qualities. Hessian can be available in cloth lengths while the mills usually convert<br />
sacking cloth into bags and sacks.<br />
Food Grade Jute Bags<br />
Food grade jute bags are jute sacks which comply with the IJO Standard 98/01. The Government <strong>of</strong><br />
India has maintained the compulsory packing <strong>of</strong> food grains and sugar at 100% under Jute Packaging<br />
Materials (Compulsory use for Packing Commodities) Act, 1987 (JPMA).<br />
Key manufacturers <strong>of</strong> Jute packaging materials
Manufacturer Year Quantity (MT) Value<br />
(Rs crore)<br />
Unit Price Installed<br />
capacity<br />
Cheviot Co Ltd 2007-08 46,448 MT 176.36 Rs 37.96/kg 64,034 MT<br />
Gloster Jute Mills<br />
Ltd<br />
2006-07 36,066 MT 126.29 Rs 35.01/kg 906+13,408**<br />
Birla Corp Ltd 2007-08 33,317 MT 113.94 Rs 34.19/kg 32 +822***<br />
Champdany Inds. 2004-05 50,898 MT 177.46 Rs 34.86/kg 64,457 MT<br />
Caledonian Jute<br />
(Hessian)<br />
Caledonian Jute<br />
(Sacking)<br />
2006-07 8,482 MT 31.05 Rs 36.61/kg NA<br />
2006-07 14,925 MT 42.06 Rs 28.18/kg NA<br />
AI Champdany 2007-08 67,429 MT 246.29 Rs 36.53/kg 108451 MT<br />
Auckland Intern. 2006-07 20,187 MT 64.78 Rs 32.09/kg 25820 MT<br />
Budge Budge &<br />
Co<br />
2005-06 11,685 MT 36.29 Rs 31.05/kg 32,906 MT<br />
East India Comm 2006-07 42,940 MT 155.31 Rs 36.16/kg NA<br />
Ganges Mfg. Co. 2005-06 50,207 MT 150.44 Rs 29.96/kg 14080 *<br />
Howrah Mills Co 2006-07 31,861 MT 100.78 Rs 31.63/kg 40,000 MT<br />
Kamarhatty Co. 2005-06 28,233 MT 92.38 Rs 32.72/kg NA<br />
Kanknarrah Co. 2005-06 24,963 MT 83.22 Rs 33.34/kg 35,394 MT<br />
Reliance Jute 2007-08 51,055 MT 165.06 Rs 32.33/kg 916 Looms<br />
New Central Jute 2006-07 31,506 MT 103.89 Rs 32.97/kg 58,109 MT<br />
Ludlow Jute 2007-08 46360 MT 155.21 Rs 33.48/kg 57,500 MT<br />
Prabartak Jute 2006-07 12,538 MT 41.87 Rs 33.39/kg 17,500 MT<br />
Nellimarla Jute 2006-07 11,111 MT 36.68 Rs 33.01/kg 33,000 MT<br />
Sri Bajrang Jute 2006-07 17,958 MT 54.74 Rs 30.48/kg 22,000 MT<br />
Market size <strong>of</strong> Jute products and future forecast<br />
* Spindles<br />
** Looms + Spindles<br />
***Broad Looms + Narrow Looms<br />
Source: Capitaline, Company Annual Reports<br />
The current and future forecast <strong>of</strong> Jute hessian and sacks industry size is given below:-
Jute Goods industry 2007-08 2012-13<br />
Jute Hessian Quantity<br />
0.338 million<br />
MT<br />
0.373 million<br />
MT<br />
Jute Hessian Value Rs 1,216 crore Rs 1,492 crore<br />
Jute Sacks Quantity<br />
0.953 million<br />
MT<br />
0.737 million<br />
MT<br />
Jute Sacks Value* Rs 2,859 crore Rs 2,455 crore<br />
Source: <strong>Industry</strong> survey, IMaCS Analysis<br />
* Sacks including food grade bags<br />
The current production <strong>of</strong> the jute hessian and sacks in India is around 1.291 million MT valuing Rs<br />
4,075 crore. There is not much growth expected in the next five years as sacking segment faces threat<br />
from the polymer sacks, though hessian is expected to grow moderately by around 2%.<br />
Imports & Exports <strong>of</strong> Jute Goods<br />
The estimated import figures for Jute goods are as given below:-<br />
HS Code Description<br />
53101012-4,<br />
53101019,<br />
53101091/2/9<br />
JUTE GOODS*<br />
Imports<br />
Quantity<br />
Imports<br />
(in Rs crore)<br />
2007-08(E) 2007-08(E)<br />
Approx. 15<br />
million sq m<br />
Rs 50 crore<br />
Source: DGCIS, IMaCS Analysis<br />
* This includes Hessian, Sacks, Wrapping fabric <strong>of</strong> jute, woven fabric <strong>of</strong><br />
jute and jute & hessian canvas cloth<br />
The estimated import figures for Jute goods are as given below:-<br />
HS Code Description<br />
53101013,<br />
53101092/9<br />
Imports<br />
Quantity<br />
JUTE GOODS* 125 - 150 MT<br />
Imports<br />
Value<br />
2007-08(E) 2007-08(E)<br />
Rs 0.5 crore<br />
approx
Source: IBIS, IMaCS Analysis<br />
* This includes Hessian, Sacks, Wrapping fabric <strong>of</strong> jute, woven fabric <strong>of</strong><br />
jute and jute & hessian canvas cloth<br />
The imports <strong>of</strong> Jute goods are very low in India as compared to its exports. The imports happen from<br />
countries like China, Indonesia and Bangladesh.<br />
The estimated export figures for Jute goods are as given below:-<br />
HS Code Description<br />
53101011-4, 53101019,<br />
53109010/20, 53101091/2/9<br />
Exports<br />
Quantity<br />
Exports<br />
Value<br />
2007-08(E) 2007-08(E)<br />
JUTE GOODS* 50,000 MT Rs 300 crore<br />
Source: IBIS, DGCIS, IMaCS Analysis<br />
* This includes Hessian, Sacks, Wrapping fabric <strong>of</strong> jute, woven fabric <strong>of</strong><br />
jute and jute & hessian canvas cloth<br />
Hessian cloth comprises <strong>of</strong> more than 90% <strong>of</strong> the overall jute goods exported. The major destinations<br />
<strong>of</strong> exports are USA, Egypt, UAE, Germany, Saudi and Japan. These countries totally constitute over<br />
50% <strong>of</strong> total exports. The exports <strong>of</strong> jute goods will grow and reach a size <strong>of</strong> Rs 383 crore by the year<br />
2012-13.<br />
Type <strong>of</strong> Raw materials<br />
Jute yarn is the main raw material required to make the jute fabric. This is sourced locally from<br />
various suppliers in India.<br />
Key machinery manufacturers/suppliers in India<br />
One <strong>of</strong> the key suppliers <strong>of</strong> machinery in India is Lagaan Engineering Company Ltd. situated in<br />
Kolkata.<br />
Laws governing usage <strong>of</strong> Food grade jute bags<br />
The Government <strong>of</strong> India has maintained the compulsory packing <strong>of</strong> food grains and sugar at 100%<br />
under Jute Packaging Materials (Compulsory use for Packing Commodities) Act, 1987 (JPMA).<br />
However, the Hon'ble High Court <strong>of</strong> Gujarat has stayed the notification and diluted the Jute<br />
Packaging Materials (Compulsory use for Packing Commodities) Act, 1987 (JPMA) by 25% in sugar<br />
and 20% in food grains which is being contested by the Government <strong>of</strong> India.<br />
The Cabinet Committee on Economic Affairs has given its approval for compulsory packing <strong>of</strong> 100%<br />
<strong>of</strong> food grains and sugar in jute bags, for the Jute Year 2008-09 (July-June).
Following exemptions will be prescribed in the order under the JPM Act:<br />
• In case <strong>of</strong> any shortage or disruption in supply <strong>of</strong> jute packaging material, the<br />
Ministry <strong>of</strong> Textiles will, in consultation with the user Ministries concerned, relax<br />
these provisions up to a maximum <strong>of</strong> 20% for food grains and sugar respectively;<br />
• Sugar fortified with vitamins will be exempted from the purview <strong>of</strong> this order;<br />
• Packaging for export <strong>of</strong> the commodities will be exempted;<br />
• Small consumer packs <strong>of</strong> 25-kg and below will be exempted; and<br />
Bulk packaging <strong>of</strong> more than 100 kg will be exempted.<br />
Quality Control and standards in India / other countries<br />
The various standards applicable to Jute goods in India are listed below:<br />
• IS 1943:1995 A-twill jute bags<br />
• IS 2566:1993 B-twill jute bags for packing<br />
• IS 2580:1995 Jute sacking bags for packing cement<br />
• IS 2818(Part 1):1990 Indian hessian<br />
• IS 2818(Part 2):1971 Indian hessian<br />
• IS 2818(Part 3):1971 Indian hessian<br />
• IS 2818(Part 4):1971 Indian hessian<br />
• IS 2818(Part 5):1974 Indian hessian<br />
• IS 2818(Part 6):1977 Indian hessian<br />
• IS 2873:1991 Packaging <strong>of</strong> jute products in bales<br />
• IS 2874:1993 Heavy cee jute bags<br />
• IS 2875:1993 Jute corn bags<br />
• IS 3667:1993 B-twill jute cloth<br />
• IS 3750:1993 Jute corn sack cloth<br />
• IS 3751:1993 Heavy cee jute cloth<br />
• IS 3790:1991 Hessian bags<br />
• IS 3966:1967 DW-Flour jute cloth<br />
• IS 3984:2002 DW-Flour bags<br />
• IS 4436:1989 Jute bagging for wrapping cotton bales<br />
• IS 7406(Part 1):1984 Jute bags for packing fertilizers<br />
• IS 8569:1977 Jute fabrics used in the packing <strong>of</strong> textile products<br />
• IS 9113:1993 Jute sacking - General requirements<br />
• IS 9685:2002 Sand bag<br />
• IS 7406(Part 2):1986 Jute bags for packing fertilizers<br />
• IS 10036(Part 1):1982 Jute canvas<br />
• IS 10036(Part 2):1982 Jute canvas
• IS 11193:1984 Jute canvas postal bags<br />
• IS 12001:1987 Jute Sacking cloth for cement bag<br />
• IS 12154:1987 Light weight jute bags for packing cement<br />
• IS 12174:1987 Jute synthetic union bags for packing cement<br />
• IS 12493:1988 Specification for jute bags for packing sugar<br />
• IS 12494:1988 Specification for jute bags for packing urea<br />
• IS 12626:1989 Specification for laminated jute bags for packing milk<br />
• IS 12650:2003 Jute bags for packing 50 kg. foodgrains<br />
• IS 13649:1993 Polyethylene lined jute bags for packing tea<br />
• IS 14342:1996 Jute yarn/twine - Packaging code<br />
• IS 15138:2002 Jute bags for packing 50 kg sugar<br />
Standards set for food grade jute bags in India and internationally are:<br />
• IJO Standard 98/01<br />
• Sacks for the Transport <strong>of</strong> food aid, European Standard EN 766<br />
• Erstwhile British Standard 3845:1990<br />
Besides the above mentioned established standards the draft standards are listed below:<br />
• DOC.TXD 3(687) Jute sacking - General requirements<br />
• 2 DOC.TXD 3(688) Jute bags for packing 50 kg sugar<br />
• DOC.TXD 3(9001) Food grade jute packaging materials
Tea Bags<br />
Tea bags are sold by organised tea producers to the high-end consumers. Tea bags consist <strong>of</strong> a filter<br />
paper pouch with a thread, which holds the tea powder and a tag. The tea bag is dipped in hot water /<br />
milk to produce the beverage. The two major marketers <strong>of</strong> tea bags in India are Hindustan Unilever<br />
Limited (HUL) and Tata Tea Limited.<br />
Product characteristics<br />
Tea bag filter paper is made with a blend <strong>of</strong> wood and vegetable fibers. The vegetable fiber is<br />
bleached pulp abaca hemp, a small plantation tree grown for the fiber, mostly in the Philippines and<br />
Colombia. Heat-sealed tea bag paper usually has a heat-sealable thermoplastic such as PVC or<br />
polypropylene, as a component fiber (100% non-woven <strong>technical</strong> textile) on inner side <strong>of</strong> the teabag<br />
surface. The filter paper used for making tea-bags is a 12-17 GSM non-woven material. The heat-<br />
sealing type tea-bag paper is <strong>of</strong> 16.5 to 17 GSM approx while the non-heat sealed tea-bag paper is<br />
around 12 – 13 GSM.<br />
Organised Tea market in India<br />
The domestic <strong>consumption</strong> <strong>of</strong> tea in India is in excess <strong>of</strong> 800 million kilograms with a per capita<br />
<strong>consumption</strong> <strong>of</strong> around 750-800 grams per annum. Around 45-50% <strong>of</strong> the tea industry in India is<br />
organised.<br />
Tea Bags market in India<br />
The total size <strong>of</strong> the organised tea market in India is around 400 million kilograms. The penetration <strong>of</strong><br />
tea bags in the country is around 1.5-2% <strong>of</strong> the organised tea market. Hence, the size <strong>of</strong> the domestic<br />
tea (sold as tea-bags) market is around 6,900 MT. HUL and Tata Tea are the leading manufacturers <strong>of</strong><br />
tea bags in India.<br />
Most <strong>of</strong> the tea-bags contain 2 grams <strong>of</strong> tea though some <strong>of</strong> the bags contain up to 4 grams <strong>of</strong> tea.<br />
Hence, the total number <strong>of</strong> tea-bags used in India is estimated as around 3 – 3.5 billion.<br />
Market size <strong>of</strong> tea-bags filter and future forecast<br />
The <strong>consumption</strong> <strong>of</strong> filter paper is around 1.05 kilograms to 1.25 kilograms per kilogram <strong>of</strong> tea<br />
packed or around 2.1 to 2.3 grams per tea-bag. The price <strong>of</strong> tea-bag filters has been assumed as Rs<br />
250 per kg.
The market size <strong>of</strong> tea-bag filter has been estimated as given below:-<br />
Tea-bags filter usage in India<br />
Tea sold as tea-bags in India Approx. 6,900 MT (3 – 3.5 billion teabags)<br />
Filter paper used per kg <strong>of</strong> tea 1.05 kg to 1.25 kg (2.1 to 2.3 grams per<br />
tea bag)<br />
Total Filter paper usage for tea-bags 7,900 MT<br />
Rs 200 crore<br />
Source: <strong>Industry</strong> survey, PIB, IMaCS Analysis<br />
The current and future forecast <strong>of</strong> tea bags filter industry is given below:-<br />
Tea-bags filter 2007-08 2012-13<br />
Tea sold as tea-bags 6,900 MT 15,400 MT<br />
Tea bag filter paper volume<br />
(in MT)<br />
7,900 MT 17,650 MT<br />
Tea bag filter paper value<br />
(in Rs. crore)<br />
Rs 200 crore Rs 441 crore<br />
Source: <strong>Industry</strong> survey, IMaCS Analysis<br />
The potential market for tea bag industry in 2012-13 is estimated at Rs. 441 crore up from Rs. 200<br />
crore in 2007-08 (E). No inflationary increase has been assumed for the price <strong>of</strong> the tea-bags filters. In<br />
volume terms, the usage <strong>of</strong> filter paper in tea bags industry is expected to grow from 7,900 tonnes in<br />
2007-08 to 17,650 tonnes in 2012-13. The tea-bags industry in India is expected to grow at 15-20%<br />
per annum. We have assumed the growth rate <strong>of</strong> the industry as 17.5% per annum over the next five<br />
years.<br />
Imports <strong>of</strong> Tea-bags filter<br />
The estimated import figures for tea-bags filter are as given below:-<br />
HS Code Description<br />
Imports<br />
Quantity<br />
Imports<br />
(in Rs crore)<br />
2007-08(E) 2007-08(E)<br />
48054000,<br />
48232000<br />
TEA-BAG FILTER<br />
PAPER*<br />
Approx. 800 MT<br />
Rs 5 – 5.5 crore<br />
approx.<br />
Source: IBIS, DGCIS, IMaCS Analysis<br />
Germany, UK & USA account for over 95% <strong>of</strong> tea-bag filter paper imports <strong>of</strong> India. 2-3% <strong>of</strong> tea-bags<br />
filters are imported from China as well.<br />
Exports <strong>of</strong> Tea-bags filter<br />
The estimated export figures for Tea-bags filter paper from India are negligible.
Manufacturing process and Type <strong>of</strong> Raw materials<br />
Heat-sealed tea bag paper usually has a heat-sealable thermoplastic such as PVC or polypropylene, as<br />
a component fiber (100% non-woven <strong>technical</strong> textile) on inner side <strong>of</strong> the teabag surface. The filter<br />
paper used for making tea-bags is a 12-17 GSM non-woven material. The heat-sealing type tea-bag<br />
paper is <strong>of</strong> 16.5 to 17 GSM approx while the non-heat sealed tea-bag paper is around 12 – 13 GSM.<br />
Key machinery manufacturers/suppliers in India<br />
Chandy John, based at Bangalore, is a key supplier and exporter <strong>of</strong> machinery for manufacturing tea-<br />
bags in India. It supplies two kinds <strong>of</strong> machines:-<br />
1. Tea Bag with Tag and String Packing Machine<br />
2. Tea Bag with Tag, String and Envelope Packing Machine<br />
Quality Control and Standards – There are no Indian standards.
SPORTECH<br />
Sportech segment comprises <strong>of</strong> <strong>technical</strong> textile products used in sports and leisure. The <strong>technical</strong><br />
textile products covered under Sportech are as give below:-<br />
• Sports Composites<br />
• Artificial turf<br />
• Parachute Fabrics<br />
• Ballooning fabrics<br />
• Sail cloth<br />
• Sleeping bags<br />
• Sport nets<br />
• Sport shoes components<br />
• Tents<br />
• Swimwear<br />
The <strong>technical</strong> <strong>textiles</strong> usage in the Sportech segment is valued at Rs 2,632 crore in 2007-08.The sports<br />
footwear components account for around 85% <strong>of</strong> the total segment value followed by <strong>technical</strong><br />
<strong>textiles</strong> usage in sports composites with around 11% share.<br />
The sports footwear components are valued at Rs 2,250 crore and are expected to grow at around 11%<br />
y-o-y over the next 5 years. The <strong>technical</strong> <strong>textiles</strong> usage in sports composites is valued at Rs 293<br />
crore. Sport composites include inflatable balls (footballs, volleyball, basketballs, etc), cricket<br />
protective equipments and boxing equipments. Around 30% <strong>of</strong> the sports composites are exported.<br />
Artificial turfs are valued at Rs 26 crore and account for about 1% <strong>of</strong> the segment only. The artificial<br />
turfs are not manufactured in India and the demand is met through imports.<br />
The usage <strong>of</strong> <strong>technical</strong> <strong>textiles</strong> in parachute fabrics, sleeping bags and hot air balloon fabrics is<br />
estimated as Rs 18.4 crore in 2007-08 which is expected to increase to Rs 28 crore by 2012-13. The<br />
<strong>consumption</strong> <strong>of</strong> sail cloth in India is negligible.<br />
Sports nets, high performance swimwear and tents account for the remaining <strong>technical</strong> <strong>textiles</strong><br />
<strong>consumption</strong> in Sportech with market size <strong>of</strong> Rs 5 crore, Rs 0.84 crore and Rs 39 crore respectively in<br />
2007-08. India exports around 40% <strong>of</strong> its sports nets production and around 25% <strong>of</strong> its tents
production. The usage <strong>of</strong> <strong>technical</strong> <strong>textiles</strong> in sports nets and tents is expected to increase to Rs 30<br />
crore and Rs 49.8 crore respectively by 2012-13.<br />
Overall, the usage <strong>of</strong> <strong>technical</strong> <strong>textiles</strong> in the Sportech segment is expected to increase from Rs 2,632<br />
croire in 2007-08 to around Rs 4,358 crore by 2012-13, growing at a CAGR <strong>of</strong> just below 11%.<br />
Summary <strong>of</strong> the market-sizing for Sportech<br />
Sports<br />
composites<br />
(TT<br />
component)<br />
Artificial<br />
turf<br />
Parachute<br />
fabrics<br />
Hot air<br />
balloons<br />
fabric<br />
Sleeping<br />
bags<br />
Sports Nets<br />
Sports<br />
Footwear<br />
components<br />
Sail cloth<br />
Quantity<br />
Value<br />
Quantity<br />
Value<br />
Quantity<br />
Value<br />
Quantity<br />
Value<br />
Quantity<br />
Value<br />
Quantity<br />
Value<br />
Quantity<br />
Value<br />
Quantity<br />
Production Imports Exports<br />
2007-08 2012-13<br />
<strong>Domestic</strong><br />
Consumption<br />
<strong>Domestic</strong><br />
Consumption<br />
- - - - -<br />
Rs 455<br />
crore<br />
Rs 13<br />
crore<br />
Rs 175<br />
crore<br />
Rs 293 crore Rs 410 crore<br />
- 140 MT - 140 MT 280 MT<br />
-<br />
Rs 7.4<br />
crore<br />
Rs 0.11<br />
crore<br />
7 lakh nos.<br />
Rs 26<br />
crore<br />
24,320 sq<br />
m<br />
Rs 0.35<br />
crore<br />
Rs 0.07<br />
crore<br />
0.5 lakh<br />
nos.<br />
- Rs 26 crore Rs 52 crore<br />
Rs 1.5<br />
crore<br />
4 lakh meters 5 lakh meters<br />
Rs 6.25 crore Rs 7.75 crore<br />
- 7,000 sq m 10,000 sq m<br />
- Rs 0.18 crore Rs 0.25 crore<br />
6 lakh nos. 1.5 lakh nos. 2.5 lakh nos.<br />
Rs 27 crore Rs 3 crore Rs 18crore Rs 12 crore Rs 20 crore<br />
- 4 lakh nos. 80 MT 107 MT<br />
Rs 18 crore - Rs 13 crore Rs 5 crore Rs 6.7 crore<br />
Rs 2,230<br />
crore<br />
1.8<br />
million<br />
meters<br />
Rs 20<br />
crore<br />
-<br />
166 million sq<br />
m<br />
- Rs 2,250 crore<br />
280 million<br />
sq m<br />
Rs 3,810<br />
crore<br />
- - - < 1 MT < 1 MT<br />
Export<br />
Potential<br />
Rs 352<br />
crore<br />
-<br />
Rs 1.7<br />
crore<br />
-<br />
Rs 20<br />
crore<br />
Rs 17.4<br />
crore<br />
-
Swimwear<br />
Tents<br />
TOTAL<br />
Value<br />
Quantity<br />
Value<br />
Quantity<br />
Value<br />
Value<br />
Production Imports Exports<br />
2007-08 2012-13<br />
<strong>Domestic</strong><br />
Consumption<br />
<strong>Domestic</strong><br />
Consumption<br />
- - - < Rs 1 lakh < Rs 1 lakh<br />
Rs 60 crore<br />
1.42 lakh<br />
pieces<br />
Rs 1.86<br />
crore<br />
24.47 lakh<br />
pieces 1050 pieces* 1350 pieces*<br />
Rs 54.62<br />
crore<br />
Rs 0.84 crore*<br />
Rs 1.08<br />
crore*<br />
2,125 MT 65 MT 640 MT 1,550 MT 1983 MT<br />
Rs 47 crore Rs 3 crore Rs 11 crore Rs 39 crore Rs 49.8 crore<br />
Rs 2,845<br />
crore<br />
Rs 67<br />
crore<br />
Rs 273<br />
crore<br />
Rs 2,632<br />
crore<br />
Rs 4,358<br />
crore<br />
* This size only constitutes <strong>of</strong> high performance swimwear market in India and not any<br />
fashion swimwear available in the market<br />
As per ECTT report, the potential market sizing for 2007-08 was as given below:-<br />
Market size<br />
(ECTT report)<br />
Sports footwear<br />
(TT component)<br />
Sports composites<br />
Sleeping bags<br />
Artificial turf<br />
Ballooning fabrics<br />
Parachute fabrics<br />
2001-02 2007-08 (P)<br />
Quantity 105 million meters 140 million meters<br />
Value Rs 1,020 crore Rs 1,600 crore<br />
Quantity<br />
Value Rs 275 crore Rs 415 crore<br />
Quantity 25,000 nos. 50,000 nos.<br />
Value Rs 6.25 crore Rs 12.5 crore<br />
Quantity<br />
Value Rs 3.5 crore Rs 12.45 crore<br />
Quantity<br />
Value Rs 0.5 crore 0.89 crore<br />
Quantity<br />
Value Rs 4.5 crore Rs 10.67 crore<br />
TOTAL Value Rs 1,309.75 crore Rs 2,049.51 crore<br />
Export<br />
Potential<br />
-<br />
-<br />
Rs 12<br />
crore<br />
Rs 403<br />
crore
Capital Employed and Pr<strong>of</strong>itability <strong>of</strong> key players <strong>of</strong> Sportech<br />
Company Name<br />
Capital Employed<br />
(Rs crore)<br />
Net Pr<strong>of</strong>it Margin<br />
(%)<br />
2006-07 2007-08 2006-07 2007-08<br />
Bata India Ltd. 189.6 210.4 4.9% 5.2%<br />
Cosco (India) Ltd. 36.0 36.1 0.5% 0.2%<br />
Entremonde Polyecoaters Ltd. 6.5 7.3 2.5% 2.3%<br />
Forbes & Co. Ltd. 491.8 287.3 1.4% 0.8%<br />
Garware-Wall Ropes Ltd. 184.2 245.2 6.5% 5.9%<br />
Gokak Textiles Ltd. NA 194.9 NA -1.7%<br />
Jasch Industries Ltd. 20.5 23.4 3.8% 3.3%<br />
Lakhani India Ltd. 71.7 133.0 12.1% 0.8%<br />
Liberty Shoes Ltd. 133.2 144.3 7.2% 6.0%<br />
Mayur Uniquoters Ltd. 25.1 28.9 3.7% 5.2%<br />
Relaxo Footwears Ltd. 97.3 114.8 2.7% 3.4%<br />
Source: Prowess Database, IMaCS Analysis<br />
Sportech segment <strong>of</strong> <strong>technical</strong> <strong>textiles</strong> is estimated to provide employment to 88,000 people 12 <strong>of</strong><br />
whom number <strong>of</strong> <strong>technical</strong> 13 employees is estimated at 70,000 and number <strong>of</strong> non-<strong>technical</strong><br />
employees is estimated at 18,000.<br />
The key impediments to growth <strong>of</strong> Sportech products are:-<br />
1. Inadequate domestic demand<br />
2. The raw materials and machinery for products like Ballooning fabric and Artificial turfs is not<br />
available in India which render these products expensive as compared to other manufacturing<br />
countries<br />
3. Demand for products like parachute fabrics, tents, etc is driven primarily by the defence<br />
sector only<br />
4. Sportech products are typically labour intensive; availability <strong>of</strong> skilled labour is a major<br />
impediment to growth<br />
5. Licenses and clearances required for products like Ballooning fabric are a major impediment<br />
as well<br />
12 Employment has been estimated based on the analysis <strong>of</strong> primary and secondary data available for the<br />
<strong>technical</strong> textile manufacturers. IMaCS has made appropriate adjustments because <strong>of</strong> insufficient data.<br />
13 Technical includes managerial staff and skilled labour whereas non-<strong>technical</strong> includes unskilled labour.
Sports Composites Market<br />
Sports composites usage in India includes boxing equipments, inflatable balls and protective<br />
equipments for cricket.<br />
Product characteristics<br />
Boxing equipments consist <strong>of</strong> Boxing Gloves, Boxing Punching Gloves, Boxing Head Guards, Boxing<br />
Punching Pads, Abdominal Guard, Speed Ball, Punching Bag etc.<br />
Inflatable balls consist <strong>of</strong> football, volleyball, basketball, handball etc. Footballs account for 50% <strong>of</strong><br />
the market <strong>of</strong> inflatable balls. Footballs have varying sizes i.e. Size-3, Size-4 and Size-5.<br />
Circumference for size 5 is 68.5cm to 69.5cm. Official weight <strong>of</strong> the football is 420~445 grams with<br />
ball pressure <strong>of</strong> 0.8 bar.<br />
Protective equipments for cricket comprise <strong>of</strong> leg-guards, batting gloves, wicket keeping gloves, thigh<br />
pads, helmets, caps & hats, cricket kit bags etc<br />
Market dynamics<br />
Indian sporting goods industry is concentrated primarily in the cottage and small-scale sector. It is a<br />
highly labour intensive industry and also employs a large number <strong>of</strong> women as well. Most <strong>of</strong> the units<br />
work on a job work basis for the major manufacturers/exporters and also sell their produce to<br />
wholesalers who in turn sell these equipments to sports goods retailers.<br />
The <strong>consumption</strong> <strong>of</strong> these products is dependent on the number <strong>of</strong> tournaments and the popularity <strong>of</strong><br />
the particular sport (retail sales). The demand <strong>of</strong> these products is affected by International and<br />
National tournaments held in India. The per capita <strong>consumption</strong> <strong>of</strong> the sporting goods like inflatable<br />
balls is very low in India which is an indicator <strong>of</strong> the huge market potential.<br />
Key manufacturers<br />
At present, the units in Jalandhar account for around 60% <strong>of</strong> the production <strong>of</strong> sports goods in India,<br />
units in Meerut account for another 20% production and the remaining 20% <strong>of</strong> the production is<br />
contributed by other units spread all over India.<br />
Cosco India Limited is the major player in the sports goods market. Its production and capacity details<br />
are given in the following table:-<br />
Product Name Installed<br />
Capacity<br />
Production Sales Sales<br />
Quantity Quantity Value
Rubber Moulded<br />
Balls<br />
Synthetic Sports<br />
Balls & Components<br />
Latex Bladders for<br />
Sports Balls<br />
Sports Ball Butyl<br />
Bladder<br />
Market size and future forecast<br />
1 crore pieces<br />
approx.<br />
8 lakh pieces<br />
approx.<br />
45 lakh pieces<br />
approx.<br />
15 lakh pieces<br />
approx.<br />
23 lakh pices<br />
approx<br />
7 lakh pieces<br />
approx<br />
38 lakh pices<br />
approx.<br />
-<br />
26 lakh pieces<br />
approx<br />
7 lakh pieces<br />
approx<br />
40 lakh pieces<br />
approx<br />
12 lakh pieces<br />
approx<br />
Around Rs<br />
9 crore<br />
Around Rs<br />
8 crore<br />
Around Rs<br />
5 crore<br />
The total production <strong>of</strong> sports composites in India is around Rs 455 crore. The industry exports almost<br />
one-third <strong>of</strong> its production although the share <strong>of</strong> exports is decreasing gradually. The increasing<br />
popularity <strong>of</strong> various sports and favourable demography augurs well for the domestic market. The<br />
sports composite industry is also getting a boost because <strong>of</strong> tournaments like Indian cricket league,<br />
Indian football league, etc. International events like common wealth games being hosted in India is<br />
also a favourable factor.<br />
Production <strong>of</strong> sports composites<br />
S. No. Name <strong>of</strong> the Products 2007-08<br />
1 Inflatable Balls Rs 280 crore<br />
2 Cricket Protective Equipment Rs 135 crore<br />
3 Boxing Equipment Rs 40 crore<br />
Source: <strong>Industry</strong> survey, SGEPC, IMaCS Analysis<br />
The current and future forecast <strong>of</strong> sports composites <strong>consumption</strong> is given below:-<br />
Sports Composites 2007-08 2012-13<br />
(<strong>Domestic</strong> <strong>consumption</strong>) Value Value<br />
Inflatable Balls Rs 179 Crore Rs 250 Crore<br />
Cricket Protective Equipment Rs 85.5 Crore Rs 120 Crore<br />
Boxing Equipment Rs 28.5 Crore Rs 40 Crore<br />
Source: <strong>Industry</strong> survey, SGEPC, IMaCS Analysis<br />
The current market size <strong>of</strong> sports composites products in India is around Rs 293 and is estimated to<br />
grow at the rate <strong>of</strong> 7 % per annum to Rs 410 crore by 2012-13.<br />
Imports and exports<br />
The key sports goods items exported from India are inflatable balls, protective equipment for cricket<br />
and boxing equipments. The important export markets for inflatable balls are UK, USA, Australia,<br />
-
and Germany. The Boxing equipments are exported to countries like UK, South Africa, USA and<br />
Australia.<br />
Cricket protective gear (Thigh pads, Pads, Helmets etc) have a huge domestic demand and are<br />
exported to UK, Australia, South Africa, New Zealand, U.S.A. The exports figures are as given<br />
below:-<br />
S. No. Name <strong>of</strong> the Products Exports<br />
1 Inflatable Balls Rs 110 crore<br />
2 Cricket Protective Equipment Rs 50 crore<br />
3 Boxing Equipment Rs 15 crore<br />
Source: SGEPC, DGCIS, IMaCS Analysis<br />
Sports composites have an export potential <strong>of</strong> Rs 352 crore in 2012-13.<br />
The import details <strong>of</strong> these goods are given in the following table.<br />
Key Exporters<br />
S. No Name <strong>of</strong> the Products Imports<br />
1 Inflatable Balls Rs 9 crore<br />
2 Boxing Equipment Rs 3.5 crore<br />
3 Cricket Protective Equipment Rs 0.5 crore<br />
Source: SGEPC, DGCIS, IMaCS Analysis<br />
Company Location Products<br />
Sanspareils Greenlands Pvt<br />
Ltd Meerut Cricket Bats & Balls, S<strong>of</strong>t Leather Goods<br />
Soccer International Pvt Ltd Jalandhar Inflatable Sports Balls Soccer Shin Guards Bags<br />
Mayor International Limited Gurgaon<br />
Golf Balls, Plastic Tees, Rubber Tees, Soccer Balls,<br />
Volley Balls, Rugby Balls, Miniature Balls<br />
Bhalla Sports Pvt Ltd Meerut Inflatable balls and others<br />
F.C. Sondhi & Co. (India) Pvt<br />
Ltd Jalandhar Cricket protective equipments<br />
These exporters were recognised with export excellence awards by Sports goods export promotion<br />
council for their performance in 2006-07.<br />
Raw materials and machinery
The major steps involved in the manufacture <strong>of</strong> sports composites are cutting and stitching. The small<br />
cottage units make these composites by hand stitching where as the bigger units go for sewing<br />
machines.<br />
Boxing equipments are made <strong>of</strong> PU laminated / PVC coated fabrics, woven polyester fabric, nylon<br />
coated with PVC on both sides. PU/PVC coated fabrics are the most commonly used fabrics.<br />
Leg guards are made <strong>of</strong> PU laminated / PVC coated fabric in front and cotton fabric on the inner side<br />
as the impact <strong>of</strong> the cricket ball is on the outside surface. Batting gloves are made <strong>of</strong> PU laminated<br />
fabric while wicket keeping gloves are made <strong>of</strong> PVC coated fabric as they are subject to more wear<br />
and tear.<br />
Quality Control and Standards<br />
The standards for different Sports composites are specified by their governing bodies.
Artificial turf<br />
Artificial turf, or synthetic turf, is a man-made surface manufactured from synthetic materials with<br />
appearance similar to natural grass. It is used for making world-class surfaces for playing sports<br />
(especially hockey and soccer) which are normally played on grass. The hockey stadiums account for<br />
most <strong>of</strong> the <strong>consumption</strong> <strong>of</strong> the artificial turf in India. It is also used indoors or outdoors for<br />
landscaping.<br />
Artificial turf is considered a safe alternative to natural grass; turf has no direct harmful effects to pets<br />
or children. Several studies have shown that the artificial turfs have a higher injury rate than grass on<br />
playgrounds. The new manufacturing and installation procedures have resulted in lowering <strong>of</strong> injury<br />
rates than on natural grass.<br />
Product characteristics<br />
The artificial turf system consists <strong>of</strong> various layers - the pile fibers & backing cloth, shock absorbing<br />
layer and the supporting base.<br />
• Pile Fiber - The grass like piles are non abrasive and s<strong>of</strong>t to touch. The synthetic grass is<br />
made <strong>of</strong> either the polyamide nylon/nylon 6.6 or PP/PE, which is custom extruded into a<br />
mon<strong>of</strong>ilament ribbon form. The pile fiber has to allow for smooth ball roll and bounce,<br />
support non-directional foot traction, allow for water permeability and should have the correct<br />
balance <strong>of</strong> strength, elasticity and stiffness to withstand the wear and tear <strong>of</strong> regular usage.<br />
• Backing Fabric - the material to which surface fibers are attached to form the underside <strong>of</strong><br />
the artificial turf surface. The backing has to permit water to flow through the fabric readily.<br />
• Shock-Absorbing Foam - provides cushioning for running or falling athletes. The foam is<br />
made <strong>of</strong> a closed-cell polymer alloy like polyurethane, typically 1/2 inch in height and<br />
perforated for vertical drainage<br />
• Supporting Base - supports the load placed on the entire structure, typically a 2-feet or 3-feet<br />
layer <strong>of</strong> asphalt or concrete<br />
Installation and maintenance are very crucial for the performance <strong>of</strong> Artificial Turf. For ground<br />
installations, a good quality sub-base is very important. The turf suppliers provide these services<br />
themselves. Turf generally lasts at least a decade and requires no mowing, watering or fertilisation.<br />
The pile fibers are knitted directly into the backing using flat-bed Raschel knitting machines which<br />
are between 4.5 m to 5 m wide to form a mechanically strong and stable structure. The sewing threads<br />
which are used are high-strength, weather resistant and pigmented to exactly match the colour <strong>of</strong> the<br />
turf.
Market dynamics and key growth drivers <strong>of</strong> Astro-turfs market in India<br />
The hockey stadiums account for most <strong>of</strong> the <strong>consumption</strong> <strong>of</strong> artificial turf in India. It also finds use in<br />
use indoor or outdoor landscaping: Ro<strong>of</strong>tops, Balconies, Atriums, Home and Corporate Lawns, Hotels<br />
and Resorts, Club Houses, Jogging / Walking Tracks, Shopping Malls, Traffic Islands, Road Medians,<br />
Kids’ play area etc.<br />
The key market driver is the government expenditure to improve the hockey infrastructure. The<br />
Commonwealth games and Hockey Olympics, which are to be hosted in India, are expected to<br />
increase the short-term demand <strong>of</strong> astro-turfs in India. In the long term, various Government schemes<br />
providing subsidy to universities / colleges for lying down <strong>of</strong> artificial turfs augur well for this<br />
industry.<br />
Other than sports, the usage <strong>of</strong> artificial turf for landscaping is increasing on account <strong>of</strong> increasing<br />
awareness and acceptance <strong>of</strong> the product and also because <strong>of</strong> the rising labour costs in maintaining<br />
natural grass lawns.<br />
More than 1000 installations <strong>of</strong> astro-turf are already complete in India. Some <strong>of</strong> the installations <strong>of</strong><br />
astro-turf in India are given below (Source: www.fieldturfindia.com):-<br />
• Synthetic Track installed for Military World Games, Hyderabad, 2007<br />
• SAARC countries first artificial grass football field (80,000 sq ft) installed for Chowgule<br />
Group, Goa<br />
• Two Tennis Courts installed for Jain International School<br />
• 8 Basketball Courts installed for Eastern Naval Command at Vizag, Chennai, Arakkonam<br />
• Multipurpose artificial grass field at Mahatma Education Society<br />
• 48,000 sq. ft. installed on Infosys ro<strong>of</strong>top<br />
Market size <strong>of</strong> Astro-turfs in India<br />
There are 20 artificial turf hockey pitches in all <strong>of</strong> India. The Ministry <strong>of</strong> Youth Affairs & Sports has<br />
approved laying <strong>of</strong> 12 new Astroturfs at the cost <strong>of</strong> Rs. 42 crore with a view to create better facilities<br />
for hockey in the country. Locations for new Astroturfs include one at Singpura (Baramullah, J&K)<br />
and tribal pockets like Rajnandgaon (Chhattisgarh), Hazaribagh (Jharkhand) and Kokrajhar (Assam).<br />
At another eight places, the work for establishment <strong>of</strong> Astroturf is at different stages <strong>of</strong> the<br />
completion. Besides this, the work relating to replacement <strong>of</strong> old Astroturfs at NIS, Patiala and<br />
Kolkatta is underway. The proposal for setting up <strong>of</strong> another four Astroturfs are in the pipeline. By the<br />
end <strong>of</strong> 2009, India will have 30 Astroturfs spread across the country for the promotion <strong>of</strong> hockey.
Hence, on an average, 6-8 astro-turfs are being laid every year In India. In addition, 3-4 synthetic<br />
astro-turfs are being laid in India every year.<br />
The cost <strong>of</strong> laying an artificial turf for a hockey field is approximately Rs 3.5 crore which usually lasts<br />
for a minimum <strong>of</strong> ten years assuming proper maintenance. The cost <strong>of</strong> an 8-lane synthetic athletics<br />
track is around Rs 2.5 crore. Technical <strong>textiles</strong> account for 60% <strong>of</strong> the cost.<br />
Astro-turf usage in India<br />
No. <strong>of</strong> hockey fields for astro turfs per<br />
year<br />
7<br />
Area <strong>of</strong> astro-turf 6000 sq. m.<br />
Cost <strong>of</strong> astro-turf per field Approx. Rs 3.5 crore<br />
Share <strong>of</strong> <strong>technical</strong> <strong>textiles</strong> in the cost 60%<br />
GSM <strong>of</strong> <strong>technical</strong> textile fabric 1884 (175 grams per square feet)<br />
Astro-turf usage per annum Rs 14.7 crore<br />
88 MT<br />
Source: <strong>Industry</strong> survey, PIB, IMaCS Analysis<br />
Synthetic athletics tracks usage in India<br />
No. <strong>of</strong> synthetic athletics tracks per<br />
year<br />
4<br />
Area <strong>of</strong> synthetic track Approx. 4500 sq. m.<br />
Cost <strong>of</strong> astro-turf per field Approx. Rs 2.5 crore<br />
Share <strong>of</strong> <strong>technical</strong> <strong>textiles</strong> in the cost 60%<br />
GSM <strong>of</strong> <strong>technical</strong> textile fabric 1884 (175 grams per square feet)<br />
Synthetic track usage per annum Rs 6 crore<br />
37 MT<br />
Source: <strong>Industry</strong> survey, PIB, IMaCS Analysis<br />
The market size has been increased by 20% to account for usage in landscaping.<br />
The demand for artificial turfs / synthetic tracks is likely to double in the next 5 years as a result <strong>of</strong><br />
strong government focus on developing the sports infrastructure <strong>of</strong> India.<br />
The Indian artificial turf market size is expected to increase from 140 MT in 2007-08 to around 280<br />
MT by 2012-13. No inflationary increase has been assumed for the price <strong>of</strong> artificial turfs. Hence, in<br />
value terms, the market size <strong>of</strong> the artificial turfs market in India is expected to increase from Rs 26<br />
crore in 2007-08 to around 52 crore by 2012-13.<br />
The current and future forecast <strong>of</strong> artificial turf <strong>consumption</strong> is given below:-<br />
Artificial turf 2007-08 2012-13
Quantity 140 MT 280 MT<br />
Value Rs 26 crore Rs 52 crore<br />
Key manufacturers <strong>of</strong> artificial turf in India<br />
Source: <strong>Industry</strong> survey, IMaCS Analysis<br />
There are no manufacturers <strong>of</strong> artificial turf in India. The demand is met entirely through imports.<br />
Artificial turfs are imported under the HS code 570330.<br />
Key importers<br />
The major importers <strong>of</strong> Astro-turf (fabrics) are Suravaram Marketing (Pvt) Ltd (Licensee <strong>of</strong> FieldTurf<br />
- Tarkett in India), Inderjit Mehta Constructions Pvt. Ltd (representing Polytan Sportstattenbau<br />
GmbH).<br />
Key machinery manufacturers / suppliers in India<br />
None<br />
Quality control and standards:<br />
The International Hockey Federation (FIH) has developed standards for Hockey turfs. Manufacturers<br />
<strong>of</strong> synthetic turfs have to adhere to the FIH standards to get their products registered as FIH approved<br />
products. These products are tested and verified by a FIH accredited laboratory.<br />
The standards for artificial turf used in football grounds are governed by FIFA. It specifies various<br />
ball / surface and player / surface tests for these turfs and cerfies as FIFA RECOMMENDED 1 Star<br />
and 2 Star. 1 Star is mainly for recreational, community and municipal use while 2 Star for artificial<br />
turf designed specifically for the playing characteristics <strong>of</strong> pr<strong>of</strong>essional football. Both the FIFA<br />
recommended 1 Star and 2 Star have to go through a series <strong>of</strong> stringent laboratory and field tests for<br />
getting the FIFA certificate.<br />
Parachute Fabrics<br />
A parachute is a device used to slow the descent <strong>of</strong> a falling body or load.<br />
Product characteristics<br />
A parachute consists <strong>of</strong> four main components: parachute canopy, rip-cords, suspension lines and the<br />
harness.<br />
• Parachute canopy
• Harness - The pack is fastened to the person's back or front with a harness. The harness is<br />
specially constructed so that the parachutist is not injured as the forces <strong>of</strong> deceleration<br />
(slowing down), gravity and wind are transmitted to the wearer's body as the chute opens.<br />
• Rip-cord - A rip-cord is used to open the duck pack and allow the chute to deploy (pop out).<br />
The rip-cord can be used in three different ways (pulling the rip manually, a static line<br />
connected to the aircraft deploys the chute as the person jumps or automatically as the pilot is<br />
ejected from the aircraft).<br />
• Suspension lines - Suspension lines, or shrouds, connect the canopy (parachute cloth) to a<br />
ring on the harness. The line is continuous from the ring, through a seam in the shroud over<br />
the top <strong>of</strong> the chute and back down to the ring again.<br />
Parachute canopies are primarily made <strong>of</strong> high tensile nylon multi-filament fibres, generally ripstop<br />
woven, from 32 to 200 deniers. Ripstop fabrics are woven fabrics whilst using a special reinforcing<br />
technique that makes them very resistant to tearing and ripping. Older lightweight ripstop fabrics<br />
display the thicker interlocking thread patterns in the material quite prominently, but modern weaving<br />
techniques make the ripstop threads less obvious.<br />
Ripstop fabrics have high strength to weight ratio. The smaller tears and rips cannot easily spread<br />
further in the fabric. Air-permeability is one <strong>of</strong> the most important characteristics because it<br />
determines the behaviour <strong>of</strong> the parachute itself, the rate <strong>of</strong> descent depends dramatically on this<br />
characteristic. The fabric should be <strong>of</strong> minimal thickness to enable folding <strong>of</strong> the parachute into a bag.<br />
Harness, webbing, tapes etc are made-up <strong>of</strong> high tensile nylon yarn (denier range 210 to 840 denier)<br />
as nylon has the highest strength to weight ratio.<br />
Market dynamics and key growth drivers<br />
Parachutes can be broadly classified into three categories based on usage: Defence, aero-sports and<br />
space vehicles.<br />
• The parachutes applications in defence are - Emergency Escape Parachute Assemblies for<br />
aircrafts with fixed seats or assisted, escape seats, Personnel Restraint Harness for seated or<br />
moving crew members, Airborne Forces’ Parachute Assemblies including Reserve<br />
parachutes, Aerial Delivery (Supply Dropping) Parachute Assemblies, Aircraft Landing<br />
Brake and Anti-Spin Parachute Assemblies, Parachute devices for flares, markers, bombs and<br />
other munitions.
• Recovery System Parachute Assemblies are used in space vehicles to recover some<br />
equipment as the vehicles descending towards earth.<br />
• Parachutes are used in aero sports like parasailing/ parascending (the person is towed behind a<br />
vehicle and attains flight <strong>of</strong> hundreds <strong>of</strong> feet above ground), Sky diving etc.<br />
The specifications associated with a parachute are type <strong>of</strong> canopy (flat, circular), size, load capacity,<br />
weight <strong>of</strong> parachute assembly, canopy fabric and material <strong>of</strong> suspension lines.<br />
In India, more than 90% <strong>of</strong> the demand for parachutes is from the defence sector. Ordinance<br />
parachute factory is the only manufacturer in India and caters to most <strong>of</strong> the demand. The parachute<br />
fabric usage at Ordinance Parachute Factory, Kanpur is around three lakh metres.<br />
The key demand drivers are defence spending on parachutes and popularity <strong>of</strong> aero-sports. The<br />
market for parachutes is likely to increase only at around 5% per annum.<br />
Key manufacturers <strong>of</strong> the parachute fabric in India<br />
The major parachute fabric manufacturers are Kusumgar Associates (Mumbai) and Oriental synthetics<br />
& Rayon Mills Pvt. Ltd (Mumbai). Kusumgar manufactures 3-4 lakh square meters <strong>of</strong> parachute<br />
fabric while Oriental Synthetics & Rayon Mills manufactures more than two lakh metres <strong>of</strong> parachute<br />
fabric.<br />
Manufacturer Year Quantity<br />
Kusumgar Associates 2007-08 Up to 3 – 4 lakh metres<br />
Oriental synthetics & Rayon Mills Pvt. Ltd 2005-06 Up to 2 lakh metres<br />
Source: <strong>Industry</strong> Survey, Office <strong>of</strong> Textile Commissioner<br />
Market size <strong>of</strong> parachute fabrics and future forecast<br />
The market size <strong>of</strong> parachute fabrics has been estimated as given below:-<br />
Parachute fabric usage in India<br />
Usage at Ordinance Parachute Factory 14 3 lakh metres approx.<br />
Average price Rs 170 per metre<br />
<strong>Domestic</strong> <strong>consumption</strong> <strong>of</strong> parachute<br />
fabric<br />
Rs 5.1 crore<br />
Fully-built Parachutes imported Rs 1.5 crore<br />
14 Analysis based on data/information received from Defence. IMaCS has made appropriate adjustments because <strong>of</strong><br />
insufficient data.
Equivalent parachute fabric<br />
Around 1 lakh metre<br />
<strong>consumption</strong><br />
Total parachute fabric <strong>consumption</strong> Rs 6 - 6.5 crore approx<br />
Around 4 lakh metres approx.<br />
Source: <strong>Industry</strong> survey, IMaCS Analysis<br />
The current and future forecast <strong>of</strong> Parachute fabric <strong>consumption</strong> is given below:-<br />
Parachute fabrics 2007-08 2012-13<br />
Quantity 4 lakh metres 5 lakh metres<br />
Value<br />
Rs 6 – 6.5 Rs 7.5 – 8<br />
crore crore<br />
Source: <strong>Industry</strong> survey, IMaCS Analysis<br />
The Indian parachute fabric market size is expected to increase from 4 lakh metres in 2007-08 to<br />
around 5 lakh metres by 2012-13. No inflationary increase has been assumed for the price <strong>of</strong><br />
parachute fabric. Hence, in value terms, the market size <strong>of</strong> the parachute fabric market in India is<br />
expected to increase from Rs 6-6.5 crore in 2007-08 to around Rs 7.5-8 crore by 2012-13.<br />
The ECTT report had estimated the market size <strong>of</strong> parachute fabrics as Rs 4.5 crore in 2001-02 and<br />
projected the market as Rs 10.67 crore in 2007-08. The market has not grown as per TECS estimates<br />
because <strong>of</strong> lower than expected <strong>consumption</strong> in the defence sector and the slow rate <strong>of</strong> growth in<br />
aerosports.<br />
Imports & Exports <strong>of</strong> parachute fabric<br />
The Indian imports <strong>of</strong> parachute fabric are as given below:-<br />
HS Code Description<br />
Imports<br />
Value<br />
Imports<br />
Quantity<br />
2006-07 2006-07<br />
54071011 Unbleached parachute fabrics Rs 0.14 crore 10,340 sq m<br />
54071021 Bleached parachute fabrics Rs 0.20 crore 13,000 sq m<br />
54071091 Other parachute fabrics Rs 0.01 crore 980 sq m<br />
Total Imports<br />
The direct exports <strong>of</strong> parachutes are as given below:-<br />
Rs 0.35 crore 24,320 SQM<br />
Source: DGCIS, IMaCS Analysis<br />
HS Code Description Exports Value Exports
Quantity<br />
2006-07 2006-07<br />
54071011 Parachutes & parts there<strong>of</strong>* Rs 1.5 crore 350 numbers<br />
Source: DGCIS, IMaCS Analysis<br />
* Most <strong>of</strong> the imports under the HS code above are fully-built parachutes<br />
The export <strong>of</strong> parachute fabric from India is very low. Even in the year 2012-13 the export potential is<br />
only around Rs 1.7 crore. Though as per DGCIS classification, HS codes 52114170, 54071011,<br />
54071021, 54071031, 54071041 and 54071091 are related to Parachute fabrics, various man-made<br />
fabrics for garment purpose are being exported under these HS codes.<br />
Raw materials<br />
Parachutes comprise <strong>of</strong> almost 90-95 % <strong>technical</strong> <strong>textiles</strong>. Parachute canopies are primarily made <strong>of</strong><br />
high tensile nylon multi-filament fibres, generally ripstop woven, from 32 to 200 deniers with GSM <strong>of</strong><br />
around 35. Harness, webbing, tapes etc are made-up <strong>of</strong> high tensile nylon yarn (denier range 210 to<br />
840 denier) as nylon has the highest strength to weight ratio.<br />
Quality Control and Standards<br />
Quality control is a stringent requirement for parachutes. The relevant standards are framed by Aerial<br />
Delivery Research and Development Establishment, Agra, India.<br />
Ballooning fabrics<br />
Hot air balloon drives its lift from heated air contained within the envelope. Hot air ballooning is a<br />
very popular leisure activity and adventure sport across the globe. In addition, aerostat balloons are<br />
used in military as surveillance equipments.<br />
Product characteristics<br />
The primary components <strong>of</strong> a Hot air balloon are: Envelope, basket and burner. The envelopes <strong>of</strong> the<br />
hot air balloons are usually made <strong>of</strong> light-weight and strong synthetic fabrics such as ripstop nylon or<br />
dacron (a polyester). Normally, the maximum temperature attained by the top <strong>of</strong> the envelope is<br />
around 120 degrees Celsius (a temperature lower than the melting point <strong>of</strong> nylon).<br />
Market dynamics and key growth drivers
The market for hot air balloons is very small in India as Hot air ballooning as a sport is still in a<br />
nascent stage. The demand for hot air balloons is mainly from defence sector. A hot air ballooning<br />
node has been established in Bhopal where a large number <strong>of</strong> army cadets participate in hot air<br />
ballooning. In the non defence sector, the balloons are used on rent i.e. people are charged for each<br />
rides.<br />
The Ballooning Club <strong>of</strong> India (based in Delhi) organizes training programs and hot balloon rides. The<br />
club revealed that about 2000 people participate in these events which are organized through out the<br />
year. Balloon rides are organized in Agra, Pushkar, Beneshwar, Nagaur, Rishikesh, Haridwar and<br />
Dehradun. The participation cost is about Rs 40,000 per person. The balloon rides are generally done<br />
in winters when the wind speeds are not very high.<br />
The ballooning club also organizes an annual event called Balloon Mela in the month <strong>of</strong> November.<br />
35 teams from across the globe participate in this event. The organization hopes to conduct this event<br />
on a bigger scale once they get adequate sponsorships.<br />
The key market drivers for ballooning are the popularity <strong>of</strong> the sport and the purchasing power <strong>of</strong> the<br />
customers as the current cost <strong>of</strong> Rs 40,000 for each ride is very high. The increase in both domestic<br />
and international tourists augurs well for the sport.<br />
Key manufacturers <strong>of</strong> ballooning fabrics<br />
Bandhu Aerospace Private Ltd (Delhi) is the pioneer in the field <strong>of</strong> hot air ballooning. It is the only<br />
manufacturer (Fabricator) <strong>of</strong> Hot air balloons in India. The company has a tie up with Ultra Magic<br />
balloons (Spain). The hot air balloons are manufactured as and when the orders are received. The<br />
company is fabricating 4-5 balloons per annum over the past few years.<br />
This company imports most <strong>of</strong> the fabric required for balloons from Carrington (UK). The company is<br />
trying to find local sources for the balloon fabric to cut down the cost (the cost can come down from<br />
Rs 15 lakhs to Rs 5 lakhs if sufficient domestic supply <strong>of</strong> ballooning fabric is present).<br />
In India, Kusumgar and Entremonde are the key manufacturers <strong>of</strong> ballooning fabrics in India.<br />
First Media Inflatable & Balloons (Hyderabad) has stopped making hot air balloons due to inadequate<br />
demand. The company has not renewed its license from Director General <strong>of</strong> civil aviation (DGCA).
Market size <strong>of</strong> TT product and future forecast<br />
Hot air balloons<br />
Width 15 metre<br />
Height 22 metre<br />
Fabric requirement 1,000 square metre<br />
Price per square metre 3-4 USD<br />
Price per square metre inclusive <strong>of</strong> duties Rs 200-250 per sq m<br />
Life time <strong>of</strong> a balloon * 300 flying hours<br />
Price <strong>of</strong> a balloon Rs 15-20 Lakhs<br />
Source: <strong>Industry</strong> survey<br />
*Life time <strong>of</strong> a balloon is a function <strong>of</strong> maintenance<br />
As mentioned earlier, the market for ballooning fabrics is very small. The rising disposable incomes,<br />
favourable demography and increasing popularity <strong>of</strong> adventure games are likely to result in a strong<br />
growth <strong>of</strong> around 6%.<br />
The current and future forecast <strong>of</strong> hot air balloons industry size is given below:-<br />
Hot air balloons 2007-08 2012-13<br />
Hot air balloons Quantity 7 nos. 50 nos.<br />
Hot air balloons Value<br />
Hot air balloons (fabric) Quantity<br />
Rs 1.25 crore<br />
approx<br />
7,000 sq m<br />
approx<br />
Rs 9.00 crore<br />
approx<br />
50,000 sq m<br />
approx<br />
Hot air balloons (fabric) Value Rs 0.18 crore Rs 1.25 crore<br />
Source: <strong>Industry</strong> survey, IMaCS Analysis<br />
The domestic usage <strong>of</strong> hot air ballooning fabric is expected to increase from 7,000 sq m in 2007-08 to<br />
around 50,000 sq m by 2012-13. No inflationary increase has been assumed for the price <strong>of</strong> these<br />
products. In value terms, the market size <strong>of</strong> the hot air ballooning fabric in India is expected to<br />
increase from Rs 0.18 crore in 2007-08 to around Rs 1.25 crore by 2012-13.<br />
Imports & Exports <strong>of</strong> hot air balloon envelopes<br />
The estimated direct import figures for hot air balloon envelopes are as given below:-<br />
HS Code Description Imports Imports
88010020<br />
Hot air balloon<br />
envelope<br />
Quantity (in Rs crore)<br />
2007-08(E) 2007-08(E)<br />
2-3 nos.<br />
Rs 0.07 crore<br />
approx<br />
Source: IBIS, IMaCS Analysis<br />
The direct imports <strong>of</strong> envelopes are from UAE, USA & UK. Ballooning fabrics are mostly imported<br />
from UK and USA.<br />
There are no exports <strong>of</strong> these products from India.<br />
Raw materials<br />
There are two basic fabrics from which balloon envelopes are manufactured - nylon or polyester. In<br />
Europe, nylon fabrics are primarily used for balloons because it is the material that both Carrington<br />
and Luckenhaus make and these two companies provide the fabric for most <strong>of</strong> the European balloon<br />
manufacturers. American balloonists are more familiar with the choice between nylon and polyester<br />
because a few American manufacturers use polyester.<br />
The nylon balloon envelope is made <strong>of</strong> nylon multifilament in the denier range <strong>of</strong> 32 to 200 deniers<br />
which are generally ripstop woven. Ripstop fabrics are woven fabrics whilst using a special<br />
reinforcing technique that makes them very resistant against tearing and ripping. During weaving<br />
(thick) reinforcement threads are interwoven at regular intervals in a crosshatch pattern in the fabric.<br />
The intervals at which reinforcement threads are interwoven are typically 5 to 8 millimeters (0.2 to<br />
0.3 in) apart. Thin or lightweight ripstop fabrics get a 3 dimensional structure due to the thicker<br />
threads being interwoven in thinner cloth. Older lightweight ripstop-fabrics display the thicker<br />
interlocking thread patterns in the material quite prominently, but more modern weaving techniques<br />
make the ripstop threads less obvious.<br />
Advantages <strong>of</strong> ripstop fabrics are - the favourable weight to strength ratio and that smaller tears and<br />
rips can not easily spread further in the fabric. The fabric (or at least part <strong>of</strong> it, the top 1/3 for<br />
example) may be coated with a sealer, such as silicone or polyurethane, to make it impermeable to air.<br />
It is <strong>of</strong>ten the degradation <strong>of</strong> this coating and the corresponding loss <strong>of</strong> impermeability that ends the<br />
effective life <strong>of</strong> an envelope, not weakening <strong>of</strong> the fabric itself. Heat, moisture, and mechanical wear-<br />
and-tear during set up and pack up are the primary causes <strong>of</strong> degradation. These fabrics have a GSM<br />
<strong>of</strong> 150 to 250. Bandhu Aerospace is importing these fabrics from UK and USA.<br />
Regulations and standards in India / other countries<br />
Director General <strong>of</strong> civil aviation (DGCA) is the regulatory body for hot air balloons in India.
The standards prescribed in FAR Part 31(Federal Aviation regulations) for the design are the<br />
minimum requirements for airworthiness <strong>of</strong> the hot air balloons. No hot air balloon can be flown<br />
unless it possesses a valid Certificate <strong>of</strong> Airworthiness. The suitability and durability <strong>of</strong> all materials<br />
must be established on the basis <strong>of</strong> experience or tests. It has to be ensured that the material has the<br />
strength and other properties assumed in the design.<br />
Persons/firms desirous to take up design and manufacture <strong>of</strong> hot air balloons have to intimate the<br />
DGCA <strong>of</strong> their intention and apply for necessary approval as required under CAR Section 2 - Series<br />
'E' Part I.<br />
There are several security requirements mandated for flying air balloons. One time security clearance<br />
<strong>of</strong> the manufacturer, owner, and operator shall be obtained from the State Police authorities before<br />
initial commencement <strong>of</strong> the operations. The hot air balloon shall not be sold or disposed <strong>of</strong> in any<br />
way to any person or firm without production <strong>of</strong> a certificate from the DGCA. The hot air balloon<br />
shall not be flown over entire air space covering VIP locations, defence installations, other<br />
restricted and prohibited areas. The hot air balloon shall also not be flown over an assembly <strong>of</strong><br />
persons or over congested areas unless prior permission in writing is obtained from appropriate<br />
authorities. The restricted areas are notified by the DGCA from time to time in consultation<br />
with the Ministry <strong>of</strong> Home Affairs.
Sail cloth<br />
Sail is a large piece <strong>of</strong> fabric (usually canvas fabric) by means <strong>of</strong> which wind is used to propel a<br />
sailing vessel. Sails were used for in every type <strong>of</strong> boats before the advent <strong>of</strong> motorized boats. In the<br />
modern times, the sails are used in sailing boats, yachts for sports and recreational purpose.<br />
Product description<br />
Earlier, sails were made from flax (linen), hemp or cotton in various forms including canvas.<br />
However, modern sails are rarely made from natural fibers. Most sails are made from synthetic fibers<br />
ranging from low-cost nylon or polyester to expensive aramids or carbon fibers.<br />
The cotton canvas sails tend to wear out faster and are not capable <strong>of</strong> achieving high sail speeds. They<br />
also tend to be more bulky compared to sails made <strong>of</strong> polyester and polyamides as they have a higher<br />
strength to weight ratio.<br />
Market Dynamics and key growth drivers<br />
The usage <strong>of</strong> sail cloth is primarily in the following segments:<br />
• Luxury yachts<br />
The demand <strong>of</strong> luxury yachts in India is still to catch up. They have a huge potential for<br />
leisure tourism as is the case in the developed countries.<br />
• Sporting sail boats<br />
Sailing as a sport is yet to catch up in India. The Yachting Association <strong>of</strong> India (YAI) is<br />
promoting the sport in the country, developing and training judges, umpires and other<br />
administrators <strong>of</strong> the sport and representing the sailors in all matters concerning the sport. The<br />
YAI is also <strong>of</strong>ficially recognized by the Indian Olympic Association and the Ministry <strong>of</strong><br />
Youth Affairs and Sports, Government <strong>of</strong> India as the governing authority for sailing,<br />
windsurfing, motor boating, powerboat racing and personal watercraft, at sea and on inland<br />
waters in India. There are around 40 clubs affiliated to YAI, spread across various parts <strong>of</strong> the<br />
country like the Kerala Yachting association, Tamil Nadu Sailing Association, etc.<br />
The sporting sail boats use modern sail cloths which are made from synthetic fibres. The<br />
sporting sails boats are categorized into various classes. There are 14 class associations<br />
affiliated to YAI, ranging from the smallest, the Optimist Dingy, to the largest, the J 24 class.<br />
The fabric requirement is dependent on the type <strong>of</strong> class.
Key classes <strong>of</strong><br />
Yachts in India<br />
Type<br />
Requirement <strong>of</strong> Sail cloth<br />
per Yacht in square metre<br />
Laser Centre boat 7.06<br />
Laser Radial Centre boat 5.76<br />
470 Centre boat 9.45<br />
YAI estimates the total fleet <strong>of</strong> sporting yachts in the country to be around 800. The laser type<br />
<strong>of</strong> boats are the most common types <strong>of</strong> yachts in this fleet and are estimated to be 140 in<br />
number.<br />
The performance <strong>of</strong> Indian teams in the international sailing events has shown continuous<br />
improvement which is likely to result in the increased popularity <strong>of</strong> the sport.<br />
There are no domestic manufacturers <strong>of</strong> these sporting yachts. The yachts are imported for<br />
sporting purposes and are exempted from the high import duties, but, imports involve a long<br />
lead time which is a discouraging factor.<br />
• Non motorized Fishing boats<br />
These sail boats are used by small fishermen who can not afford the motorized fishing boats.<br />
These boats are propelled by sails made <strong>of</strong> natural fibres. The canvas sails are being<br />
substituted by hand plastic sheeting or sacking.<br />
Market size and future forecast<br />
The requirement for synthetic sail cloth is very small although it has tremendous potential in lieu <strong>of</strong><br />
the long coastline and the rising popularity <strong>of</strong> the sport. The sporting yachts are the key driver for this<br />
industry. The sail cloth is required for the new yachts as well as for the replacement demand <strong>of</strong> worn-<br />
out sails.<br />
There are no yacht manufacturers in India and hence they have to be imported even though the import<br />
tariffs are very high. This gap in the value chain <strong>of</strong> sail cloths is the most important obstacle in the<br />
development <strong>of</strong> the Indian market.<br />
The current fleet size in India is very low and hence, the replacement demand is abysmally low. YAI<br />
has tried to source the product locally but the small market size is a huge impediment. The demand <strong>of</strong><br />
synthetic sail fabrics is entirely met through imports.<br />
The market for sporting yachts is expected to increase at a greater pace as compared to growth over<br />
the last 5 years. YAI has plans <strong>of</strong> sourcing around 200 sporting yachts in the next couple <strong>of</strong> years. The<br />
Indian navy has also floated a tender for sail boats in 2008-09. The fleet size <strong>of</strong> various sporting<br />
yachts is expected to double by 2012-13 to 1500. It is assumed that the fleet increase will be spread
equally over the years which equals to 120 yachts per year and the sail cloth requirement to 7 square<br />
metre per yacht.<br />
The market for sail cloth is not expected to reach a critical size in the next five years even considering<br />
the favourable trends mentioned above.<br />
Market size<br />
Number <strong>of</strong> sail boats 110 nos.<br />
Synthetic sail cloth required<br />
including replacement demand<br />
Quantity Less than 1 MT<br />
Value Less than Rs 1 lakh<br />
Source: <strong>Industry</strong> survey, IMaCS Analysis<br />
The imports and exports <strong>of</strong> sail boats / fabric are negligible.<br />
Raw materials<br />
The performance <strong>of</strong> a sail depends on two crucial aspects: Sail Design and Sail cloth. The sail cloths<br />
are tightly woven fabrics and mostly made <strong>of</strong> Polyester and polyamides like Nylon. These fabrics<br />
have a GSM <strong>of</strong> 200-600. Some <strong>of</strong> the high value sail cloths are laminated using sheets <strong>of</strong> PET.<br />
An ideal sail cloth should have the following properties:<br />
• Tear resistance<br />
• Modulus <strong>of</strong> elasticity: stretch resistance per weight<br />
• High Tensile strength or tenacity<br />
• High breaking strength per unit weight<br />
• Good Creep properties (the long term stretch <strong>of</strong> a fibre or fabric)<br />
• UV Resistance<br />
Quality Control and standards in India<br />
There are relevant Indian standards for sail cloth.
Sleeping bags<br />
A sleeping bag is a protective "bag" for a person to sleep in, similar to a blanket that can be closed<br />
with a zipper (allowing it to be folded in half and secured in that position) and functions as a bed<br />
while camping, hiking, hill-walking or climbing. Its primary purpose is to provide warmth and<br />
thermal insulation. Sleeping bags are used at high altitudes in extremely cold weather. It also protects<br />
against wind chill, precipitation, etc.<br />
The basic design sleeping bags work well for most camping needs but are inadequate under more<br />
demanding circumstances. The second major type <strong>of</strong> sleeping bags is mummy bags (because <strong>of</strong> its<br />
shape). Most modern sleeping bags are <strong>of</strong> a ‘mummy’ shape as it is the most thermally efficient<br />
design. A sleeping bag with little or no ‘dead space’ around the user is warmer as there is less air to<br />
warm up with heat from the body.<br />
Market dynamics and key growth drivers<br />
The major <strong>consumption</strong> <strong>of</strong> sleeping bags is by armed forces and para-military forces. The demand<br />
from these sectors accounts for close to 90 % <strong>of</strong> the total demand <strong>of</strong> sleeping bags. The sleeping bags<br />
used in these segments are <strong>of</strong> superior quality as compared to the bags used for leisure activities.<br />
The demand for sleeping bags for camping/adventure sports is less than 10 % <strong>of</strong> the total market for<br />
sleeping bag. The awareness <strong>of</strong> the criterion required for a good sleeping bag is very low. The<br />
customers are very price conscious as well.<br />
The manufacturers need to upgrade their products to superior sleeping bags which could be used for<br />
extreme cold climate conditions (also known as Arctic bags) which will help them to tap the export<br />
market.<br />
Market size and future forecast <strong>of</strong> sleeping bags<br />
The Directorate General <strong>of</strong> Supplies & Disposals (DGSND) finalises the rate contracts for the various<br />
government bodies. The DGSND estimates the demand <strong>of</strong> sleeping bags for government agencies to<br />
be Rs 8.09 crore in 2008-09.<br />
The favorable demography with more and more people going for activities like camping / Trekking is<br />
likely to result in the industry growing at 10% per annum.<br />
The current and future forecast <strong>of</strong> sleeping bags industry size is given below:-<br />
Sleeping bags 2007-08 2012-13<br />
Sleeping bags Quantity<br />
Around 1.5<br />
lakh nos.<br />
Around 2.5<br />
lakh nos.
Sleeping bags Value<br />
Rs 12 crore<br />
approx<br />
Rs 20 crore<br />
approx<br />
Source: <strong>Industry</strong> survey, IMaCS Analysis<br />
The domestic usage <strong>of</strong> sleeping bags is expected to increase from 1.5 lakh nos. in 2007-08 to around<br />
2.5 lakh nos. by 2012-13. No inflationary increase has been assumed for the price <strong>of</strong> these products.<br />
In value terms, the market size <strong>of</strong> the sleeping bags in India is expected to increase from Rs 12 crore<br />
in 2007-08 to around Rs 20 crore by 2012-13.<br />
Key manufacturers <strong>of</strong> the product with information on capacity / production / sales<br />
Sleeping bags are reserved for small scale industries. Some <strong>of</strong> the manufacturers <strong>of</strong> sleeping bags are<br />
Standard Gram Udyog Sansthan, Kanpur Tent Factory, Mahalaxmi Textile Industries, Madhur<br />
enterprises (P) Ltd, Standard Niwar Mills, etc. The manufacturers <strong>of</strong> sleeping bags are concentrated<br />
around Kanpur.<br />
Imports & Exports <strong>of</strong> sleeping bags<br />
Sleeping bags are primarily imported from Italy. The imports <strong>of</strong> sleeping bags are as given below:-<br />
HS Code Description<br />
Sleeping bags filled<br />
with feathers or<br />
94043010 down<br />
94043090 Other sleeping bags<br />
Imports<br />
(Value)<br />
Around<br />
Rs 0.15<br />
crore<br />
Around<br />
Rs 3<br />
crore<br />
Imports<br />
(Quantity)<br />
Around<br />
1,000 nos.<br />
Around<br />
0.5 – 0.6<br />
lakhs nos.<br />
Source: DGCIS, IMaCS Analysis<br />
Most <strong>of</strong> the exports <strong>of</strong> sleeping bags from India are to France & Netherlands. The exports figures <strong>of</strong><br />
sleeping bags are as given below:-<br />
Exports Exports<br />
HS Code Description (Value) (Quantity)<br />
Sleeping bags filled Around Around<br />
with feathers or Rs 0.5 10,000<br />
94043010 down crore<br />
Around<br />
nos.<br />
Rs 18 Around 6<br />
94043090 Other sleeping bags crore lakhs nos.<br />
Source: DGCIS, IMaCS Analysis<br />
Sleeping bags have an export potential <strong>of</strong> Rs 20 crore in the year 2012-13<br />
Raw materials<br />
A typical sleeping bag uses around 7 linear metres <strong>of</strong> fabric and 1.5-4 kg <strong>of</strong> filling material based on<br />
the field conditions. Several insulating materials are used for making sleeping bags.
Outer fabric: These are almost exclusively synthetic materials which are windpro<strong>of</strong> and usually have<br />
a water-repellent coating.<br />
Inner fabric: Synthetic fabrics (especially Nylon) are used predominantly. Cotton / poly cotton<br />
usually costs less than a high-wicking synthetic but traps moisture which can have a chilling effect.<br />
These fabrics have a GSM range <strong>of</strong> 60-300.<br />
Filling: Weight and pack size, for a given amount <strong>of</strong> warmth, are two <strong>of</strong> the key considerations when<br />
choosing a filling. The fillings are - Down, Kapol or Synthetics.<br />
• Down: This filling is made up <strong>of</strong> highly specialised insulating feathers, normally from ducks<br />
or geese.<br />
• Kapol: The fibre is light, very buoyant, resilient, highly flammable and resistant to water. It<br />
cannot be spun but is used as an alternative to down as filling.<br />
• Synthetic: This term encompasses a whole range <strong>of</strong> sleeping bag fillings made from synthetic<br />
fibres. They range from simple hollow fibres to complex fibres which are designed to mimic<br />
the structure <strong>of</strong> down. Ultra-hol<strong>of</strong>il or polyfil is the most commonly used material. Synthetic<br />
fillings tend to cost less than down, but they last for a shorter time.<br />
Key machinery manufacturers/suppliers in India<br />
The following machines are required for the manufacture <strong>of</strong> Sleeping bags.<br />
• Teasing machine for opening / cleaning for kapok<br />
• Foot operated / power Driven Heavy Duty sewing machine for stitching.<br />
• Power Driven K-45 Heavy duty machines for quilting<br />
These machines are available locally.<br />
Quality Control and standards<br />
The following tests and equipments are required to determine the quality <strong>of</strong> the sleeping bags.<br />
• Tensile Testing machine for measurement <strong>of</strong> breaking strength.<br />
• Testing facilities for Ends/ picks per dm.<br />
• Beesley' Balance for count <strong>of</strong> yarn.<br />
• Testing facilities for cone test.
• Bundesman water Repellency Equipment.<br />
• pH Meter<br />
• Soxlet Apparatus.<br />
• Facility for Shrinkage Test.<br />
• Colour fastness to washing test.<br />
• Buoyancy Test.<br />
• Oven with Time & Temperature control.<br />
• Sample Conditioning Chamber.<br />
• Colour fastness test.<br />
The relevant Indian standards are IS 8991: 1978, JSS-8465-25:1997.
Sports nets<br />
Sports nets are used in various sports like Badminton, Football, Basket ball, Volleyball, Tennis,<br />
Handball, etc. Nets are also used by cricket players in practices areas.<br />
Product description<br />
The typical specifications <strong>of</strong> the various kinds <strong>of</strong> sports nets are given in the table below:-<br />
Product<br />
features<br />
Badminton<br />
nets<br />
Twine<br />
Size<br />
Colour<br />
Mesh<br />
opening size<br />
0.75mm Black 20mm 24X2.5 ft<br />
Tennis Nets 3.5mm - 45mm 42 ft x 4 Ft<br />
Volley Ball<br />
Nets<br />
Football<br />
Nets / Soccer<br />
Goal Nets<br />
Handball<br />
Nets<br />
3 to 4<br />
mm<br />
7 to<br />
10mm<br />
- 100 mm<br />
Dimensions Side & Bottom<br />
9.5 Mtr x 1<br />
Mtr<br />
Black PVC tape<br />
(width 20 mm +<br />
20 mm)<br />
Black vinyl<br />
coated fabric<br />
(width = 63mm +<br />
63mm)<br />
PVC coated<br />
fabric<br />
- 5 inch 24 x 8 x 6ft -<br />
- - 4 inch<br />
Cricket nets - - 2 to 3 inches<br />
2 x 3 x 1<br />
mtr<br />
100 x 10ft,<br />
100 x 12ft,<br />
100 x 15ft<br />
The sports nets have an average GSM <strong>of</strong> 400 and typically cost Rs 250 per square metre.<br />
Market dynamics and key growth drivers<br />
Material <strong>of</strong><br />
construction<br />
HDPE, P.P.,<br />
Cotton &<br />
Nylon<br />
HDPE , UV<br />
heated-<br />
Machine<br />
knotted<br />
HDPE, P.P.,<br />
Nylon<br />
HDPE, P.P.,<br />
Nylon<br />
- HDPE & P.P.<br />
- HDPE & P.P.<br />
The nets used in cricket, football and badminton account for majority <strong>of</strong> the domestic <strong>consumption</strong>.<br />
The market for sports nets is driven by the development <strong>of</strong> sports in the country. In India, the<br />
investments in sports are very low as compared to other countries. Sports are regarded more as a<br />
leisure activity. For instance, it is common to find people playing football with makeshift goals or<br />
goal posts sans the nets. Also, the popularity <strong>of</strong> various sports is skewed in the favour <strong>of</strong> cricket where<br />
nets are required only for practice sessions.<br />
The end customers include various schools, colleges, universities, sports clubs and individuals. The<br />
sports nets are not purchased centrally by Sports Authority <strong>of</strong> India (SAI) as these are low cost items.<br />
The regional centres <strong>of</strong> SAI purchase the sports nets.
The specifications for various nets are adhered to only in the case <strong>of</strong> institutional buying. Smaller<br />
sports clubs and individuals tend to base their purchase decision more on the cost factor. The<br />
replacement frequency <strong>of</strong> sports nets is also very high. The sports nets are used for a number <strong>of</strong> years<br />
with some repairs with out being replaced.<br />
The key demand drivers for the sporting nets are the national and international tournaments. The<br />
likely increase in sports infrastructure, increasing popularity <strong>of</strong> the sports like football and hockey and<br />
the international tournaments like the commonwealth games etc being organized in the country augur<br />
well for the industry. The demand is likely to grow at the rate <strong>of</strong> 6 % year on year over the next 5<br />
years.<br />
Key manufacturers<br />
Garware Wall Ropes and Kwality Nets are the largest manufacturers <strong>of</strong> sporting nets in India.<br />
Garware Wall Ropes is the largest player in the nettings market with a capacity <strong>of</strong> 6,970 MT <strong>of</strong><br />
nettings (Source: Capitaline) <strong>of</strong> which the capacity <strong>of</strong> fishing nets is around 5,000 MT. The company<br />
manufactured 6,133 MT <strong>of</strong> nettings in 2007-08.<br />
Kwality Nets Manufacturing Co. is one <strong>of</strong> the major producers <strong>of</strong> sports nets with an installed<br />
capacity <strong>of</strong> 0.72 million sq meters/annum for all types <strong>of</strong> nets including safety nets, bird protection<br />
nets, fishing nets, mosquito nets, agro shade nets, packaging nets and other nets. In 2007–08, the<br />
company had a capacity <strong>of</strong> 200,000 square meters <strong>of</strong> sports nets.<br />
The production details <strong>of</strong> the key players manufacturing sports nets are as given below:-<br />
Manufacturer Year Production Sales Value Installed<br />
Quantity<br />
capacity<br />
Garware Wall 2007-08 6,133 MT Rs 146.91 6,970 MT<br />
Ropes*<br />
crore<br />
Kwality Nets** 2007-08 2 lakh sq m<br />
*The revenues <strong>of</strong> only the nets is given here which includes sporting nets.<br />
** The company manufactures other kind <strong>of</strong> nets also. The capacity given here is only for sport nets.<br />
Source: Capitaline, Annual reports, <strong>Industry</strong><br />
survey<br />
Market size and future forecast<br />
The current and future forecast <strong>of</strong> sports nets market size is given below:-<br />
Sports nets 2007-08 2012-13
Sports nets Quantity 80 MT 107 MT<br />
Sports nets Value<br />
Rs 5 crore<br />
approx<br />
Rs 6.7 crore<br />
approx<br />
Source: <strong>Industry</strong> survey, IMaCS Analysis<br />
The domestic usage <strong>of</strong> sports nets is expected to increase from 80 MT in 2007-08 to around 107 MT<br />
by 2012-13. No inflationary increase has been assumed for the price <strong>of</strong> these products. In value terms,<br />
the market size <strong>of</strong> the sports nets in India is expected to increase from Rs 5 crore in 2007-08 to around<br />
Rs 6.7 crore by 2012-13 growing at around 6 per cent per annum.<br />
Imports & Exports <strong>of</strong> sports nets<br />
The quantum <strong>of</strong> imports for sports nets is not significant as per discussions with the industry players<br />
as well as analysis <strong>of</strong> imports data. The estimated export figures for sports nets are as given below:-<br />
HS Code Description<br />
56075090,<br />
56081110<br />
Sports nets<br />
95069960 Sports nets<br />
Exports Exports<br />
Quantity (in Rs crore)<br />
2007-08(E) 2007-08(E)<br />
Approx. Rs 1<br />
crore<br />
Around 4 lakh Approx. Rs 12<br />
nos.<br />
crore<br />
Source: DGCIS, IMaCS Analysis<br />
The sport nets are primarily exported to USA, Finland & Belgium with around 70-80% share. The<br />
other export destinations are Denmark, Caribbean, UK, Netherlands, Kenya, Newzealand,<br />
Switzerland, Sri Lanka, Sweden, etc. Sports nets exports are expected to grow at a rate <strong>of</strong> 6% year on<br />
year to reach a level <strong>of</strong> 17.4% in 2012-13.<br />
Raw materials<br />
Sports nets are made <strong>of</strong> HDPE, PP or nylon. HDPE is the most widely used material for making<br />
sports nets. The Mesh opening can be square or hexagonal depending upon the end use requirements.<br />
The bulky nets like football and cricket nets are packaged in the form <strong>of</strong> rolls.<br />
Quality Control and standards in India / other countries<br />
The standards for different sports are governed by their respective governing bodies. There are no<br />
relevant standards for practice nets used in cricket.
Sport shoes components<br />
Product characteristics<br />
Sports footwear is used while playing outdoor sports like football, cricket, hockey, tennis, etc. These<br />
shoes are also used for running / jogging and as casual wear. In India, most <strong>of</strong> the demand for sports<br />
shoes is from the casual wear segment.<br />
The specifications <strong>of</strong> the sports shoes vary with the end user requirements. For example, the football<br />
shoes are black in colour with coloured strips on the quarters. The tongue and the quarter portions<br />
have foam backed cloth lining. The sole <strong>of</strong> either rubber or leather is then attached by hand-sewn<br />
process. The rubber soles have grooves or leather studs for better hold on the ground. In case <strong>of</strong><br />
cricket shoes, the upper is made from either white chrome or from nubuck leather. The lining <strong>of</strong><br />
tongue is made <strong>of</strong> foam. The sole <strong>of</strong> the cricket boot is made <strong>of</strong> rubber or <strong>of</strong> leather.<br />
The <strong>technical</strong> textile components typically used in the sport shoes are as following:<br />
• Shoe uppers made <strong>of</strong> PU/PVC coated/Laminated fabrics<br />
• Linings on the counters and below the shoe uppers<br />
• Others including non woven insoles, laces, tapes, labels, elastics, sandwiched meshes, etc<br />
The shoe upper material should have uniform thickness and colour and should possess water-pro<strong>of</strong>ing<br />
property. The desired characteristics <strong>of</strong> the shoe uppers are<br />
• Breathability<br />
• Dimensional flexibility<br />
• Colour fastness<br />
• Light weight<br />
• Durability<br />
The shoe uppers and linings account for 90-95 % <strong>of</strong> the <strong>technical</strong> textile components used.<br />
Market dynamics and key growth drivers<br />
The Indian shoe manufacturing industry is concentrated in the small scale and cottage sectors. The<br />
manufacturers are concentrated in Agra, Delhi, Vellore, etc.<br />
The shoe manufacturers source the requirement <strong>of</strong> laminated fabric from the laminators and / or<br />
suppliers/dealers. The laminators source the base fabrics from the fabric manufacturers and laminate<br />
them with PU or PVC. Polyester is the most widely used fabric for sport shoes. These companies also<br />
supply the lining material required.
The key demand drivers for this industry are:-<br />
• Increasing trend <strong>of</strong> usage <strong>of</strong> the sports shoes as casual wear<br />
• Rising disposable incomes<br />
• Sport shoes being perceived as status symbols<br />
• Popularity <strong>of</strong> various sports<br />
• Increasing health awareness<br />
Market size and <strong>consumption</strong> norms<br />
The key assumptions for assessment <strong>of</strong> the <strong>technical</strong> <strong>textiles</strong> usage in the footwear industry are:-<br />
Value<br />
Footwear domestic market 2200 million pairs<br />
Footwear exports 143 million pairs<br />
Closed footwear domestic market 1100 million pairs<br />
Share <strong>of</strong> sports footwear in domestic market 30%<br />
Share <strong>of</strong> sports footwear in exports 40%<br />
Total sports shoes market 387 million pairs<br />
Laminated fabric required per pair for shoe uppers 0.23 sq m<br />
Average price <strong>of</strong> laminated fabric per square metre Rs 180<br />
Lining material required per pair 0.2 sq m<br />
Average price <strong>of</strong> lining fabric per square metre Rs 85<br />
Source: <strong>Industry</strong> survey, IMaCS Analysis<br />
The growth rate <strong>of</strong> the sports shoe industry is estimated at 11% based on the discussions with the<br />
industry players. Inflationary increase <strong>of</strong> 5 % per annum has been assumed for the price <strong>of</strong> the fabric.<br />
<strong>Domestic</strong> Market size 2007-08 2012-13<br />
Quantity Value Quantity Value<br />
Sport shoes 387 million pairs 652 million pairs<br />
Shoe upper fabric 89 million sq m Rs 1,600 crore 150 million sq m Rs 2,700 crore<br />
Lining fabric 77 million sq m Rs 650 crore 130 million sq m Rs 1,110 crore<br />
The domestic usage <strong>of</strong> <strong>technical</strong> <strong>textiles</strong> fabric in the sports shoes industry is expected to increase<br />
from 166 million sq m in 2007-08 to around 280 million sq m by 2012-13. No inflationary increase<br />
has been assumed for the price <strong>of</strong> these products. In value terms, the market size <strong>of</strong> the sports nets in<br />
India is expected to increase from Rs 2,250 crore in 2007-08 to around Rs 3,810 crore by 2012-13.<br />
Key manufacturers <strong>of</strong> sports footwear
The Indian shoe manufacturing industry is concentrated in the small scale and cottage sectors. The<br />
manufacturers are concentrated in Agra, Delhi, Vellore, etc. The major players in the Indian footwear<br />
market are Reebok, Adidas, Nike, Bata, Liberty, Lakhani, Relaxo, etc.<br />
The major manufacturers <strong>of</strong> the <strong>technical</strong> textile components <strong>of</strong> the shoes are given below:-<br />
Company Products Year Units Capacity Production<br />
Jasch<br />
Industries Ltd<br />
Mayur<br />
Uniquoters<br />
Ltd<br />
Wilhelm<br />
Textile<br />
Industries<br />
Pvt. Ltd<br />
Siddh<br />
Lamifab Pvt.<br />
Ltd.<br />
Northern<br />
India Leather<br />
Cloth Mfg.<br />
Co. Ltd<br />
Ridhi Sidhi<br />
laminators<br />
PU/PVC<br />
Leather Cloth<br />
Non Woven<br />
& Coated<br />
Fabrics<br />
Capacity<br />
utilisation<br />
Sales<br />
(Rs crore)<br />
2006-07 Million metres 36 1.593 44.25% 19.24<br />
2007-08 Million metres 36 1.87 51.94% 22.28<br />
2006-07 Million metres - 0.163 - 1.26<br />
2007-08 Million metres - 0.23 - 3.82<br />
Coated Manmade<br />
Fabric 2006-07 Million metres - 5.3 - 110.02<br />
Coated Manmade<br />
Fabric 2007-08 Million metres - 6.96 - 76.08<br />
Non Woven<br />
Fabric<br />
Non-Woven<br />
Fabric-<br />
Coated<br />
PVC/PU<br />
Sheet<br />
2006-07 Million metres - 0.166 - 4.58<br />
2007-08 Million metres - 0.368 - 11.34<br />
2006-07 Million metres - 0.306 - 5.57<br />
2007-08 Million metres - 0.323 - 5.79<br />
2006-07 Million metres - 0.102 - 1.12<br />
2007-08 Million metres - 0.176 - 1.97<br />
Interlinings 2007-08 Million metres 3.0 - - -<br />
laminated<br />
fabrics 2007-08 Million metres 4.95 - - -<br />
PVC Leather<br />
Cloth 2007-08 Million metres 4.32 - - -<br />
Laminated<br />
fabrics 2007-08 Million metres 4.29 - - -<br />
Imports & Exports <strong>of</strong> sports footwear fabrics<br />
The estimated import figures for sports footwear fabrics are as given below:-<br />
HS Code Description<br />
Imports Imports<br />
Quantity (in Rs crore)<br />
2007-08(E) 2007-08(E)
59039010,<br />
59039090,<br />
59031090<br />
56039400,<br />
56031400,<br />
56031300,<br />
56039300<br />
PU Synthetic leather /<br />
Synthetic lining for footwear<br />
Non-woven insole & Lining<br />
material for footwear<br />
0.8 million<br />
meters<br />
1 million<br />
meters<br />
Around Rs 12<br />
crore<br />
Around Rs 8<br />
crore<br />
Source: IBIS, IMaCS Analysis<br />
Under the HS code 59X, China & Italy account for around 25% share (each) <strong>of</strong> the imports <strong>of</strong> Indian<br />
footwear components followed by Germany with around 15% share and Taiwan with 10% share.<br />
France, Hong Kong, Finland, UK & Portugal account for the remaining 20-25% share <strong>of</strong> Indian<br />
imports.<br />
Under the HS code 56X, China accounts for around 30-40% share <strong>of</strong> the imports <strong>of</strong> Indian footwear<br />
components followed by Spain, Italy & Taiwan with around 10% share each and Germany, Japan &<br />
Hong Kong with 5-10% share each. UK, Korea, Brazil, Vietnam, France, Austria and Hungary<br />
account for the remaining share <strong>of</strong> Indian imports.<br />
The exports <strong>of</strong> sports footwear components from India are negligible.<br />
Raw materials<br />
PVC and PU fabrics are the most widely used material for sport shoes and are also known as artificial<br />
leather. PU fabrics have the advantage <strong>of</strong> higher breathability over PVC fabrics.<br />
Quality Control and standards in India / other countries<br />
There are no relevant BIS codes for laminated cloth used in sport shoes. Other BIS standards relevant<br />
to sport shoes are given in the following table:-<br />
BIS code Description<br />
IS 13800: 1993 Shoe sizes - Method <strong>of</strong> marking<br />
The fabrics are subjected to the following tests for various physical properties.<br />
Test Shoe component<br />
Uppers and<br />
Martindale abrasion test linings<br />
Colour migration test Uppers<br />
Tensile strength Uppers<br />
Tear test Linings<br />
These tests can be conducted at Footwear Design and development Institute (FDDI), Noida.
Tents<br />
Tents are portable shelter made <strong>of</strong> cloth, supported by one or more poles and stretched tight by cords<br />
attached to pegs driven into the ground. Tents can be classified based on application, design and<br />
construction. Based on application the tents can be classified into four main categories –<br />
• Defence/Army tents,<br />
• Disaster relief tents,<br />
• Camping tents and<br />
• Others (Party/wedding tents, Resort tents, Exhibition tents etc)<br />
Based on design the tents can be classified as -<br />
• Frame Tents: Frame tents are supported by a tall frame, giving it nearly perpendicular sides<br />
and standing headroom throughout. The frame tents are in the silhouette <strong>of</strong> the letter A.<br />
• Dome tents: Dome tent has the ideal shape for adverse weather conditions. Its sloping pr<strong>of</strong>ile<br />
is aerodynamic, and sheds wind and rain better than any other design.<br />
• Hoop tents: The hoop tent design consists <strong>of</strong> strong and flexible poles. These tents are more<br />
suitable for camping and expedition.<br />
• Tunnel tents: These are constructed <strong>of</strong> two or more hoop along with its length<br />
Tents can be classified into three categories based on construction -<br />
• Single-fly: Tents with one layer <strong>of</strong> fabric<br />
• Double-fly: Tents with one layer <strong>of</strong> fabric and a fly-sheet<br />
• Winterized: Tents which usually have one layer <strong>of</strong> fabric, a lining (usually <strong>of</strong> cotton), a fly<br />
sheet, and a hole for a stove-pipe<br />
Product characteristics<br />
Tents are generally made <strong>of</strong> four different fabrics.<br />
• Outer tent and flysheet: fabric cover pitched over a tent to give extra protection against bad<br />
weather<br />
• Inner tent and lining<br />
• Valances/mud flaps<br />
• Ground sheet: a waterpro<strong>of</strong> sheet spread on the ground inside a tent<br />
An ideal tent fabric should have few or all <strong>of</strong> the below mentioned properties depending on the<br />
application:
• Waterpro<strong>of</strong><br />
• Breathable<br />
• Lightweight<br />
• Strength<br />
• UV protection<br />
• Rot pro<strong>of</strong>, Persistence & Decolorize Resistance<br />
• Flame retardant<br />
• Durable<br />
The product characteristics depend on the application <strong>of</strong> the tent. The details <strong>of</strong> dimension, weight and<br />
material used for various varieties <strong>of</strong> tents is given in Annexure 4.<br />
The wedding industry also has a huge demand for tents which is met through “shamiyana” tents. The<br />
shamiyana fabrics are typically made <strong>of</strong> cotton fabric. Their main functionality is to provide shade,<br />
thus, these tents need not be water resistant. These fabrics are made from grey cloth which is dyed and<br />
printed. The shamiyana fabric is available in different designs made by appliqué technique 15 .<br />
Market dynamics and key growth drivers<br />
The demand from the Defence, Para military forces and other government agencies like Geological<br />
Survey <strong>of</strong> India, Railways etc account for majority <strong>of</strong> the demand both in volume and value terms.<br />
Various types <strong>of</strong> tents are required by the government agencies for housing <strong>of</strong> defense personnel,<br />
stores, temporary hospitals etc. Many <strong>of</strong> the government agencies route their procurement through<br />
Director General <strong>of</strong> Supplies and Disposables (DGSND), which finalises the rate contracts with a<br />
number <strong>of</strong> tent manufacturers.<br />
The demand for relief tents is dependent on the occurrence <strong>of</strong> natural calamities. The National<br />
Disaster Management Authority (NDMA) works in co-ordination with various state and government<br />
agencies for relief operations. Most <strong>of</strong> the requirement <strong>of</strong> tents is met by assistance from the state<br />
police forces, Defence and Para military forces. The shortage <strong>of</strong> tents is met through purchase from<br />
local markets and by alternate shelters like structure from plastic sheeting poles and rope, mud walls<br />
and plastic sheeting for ro<strong>of</strong>. Relief tents are also purchased by organizations like ICRC, IFRC,<br />
UNHCR, IOM, UNICEF, MSF, World Vision etc.<br />
15 Appliqué refers to a needlework technique in which pieces <strong>of</strong> fabric, embroidery or other materials are sewn onto another<br />
piece <strong>of</strong> fabric to create designs.
The domestic market for camping tents is in a nascent stage. The increasing popularity <strong>of</strong> outdoor<br />
adventurous sports like trekking, camping etc augurs well for the industry. However, the customers<br />
are very cost conscious when selecting a camping tent. The export market holds a better potential for<br />
the time being.<br />
The other applications include tents like wedding tents, resort tents, circus tents, exhibition tents etc.<br />
The business model <strong>of</strong> wedding tents is quite different from other tents. The tents are rented out for<br />
the purpose <strong>of</strong> various parties by service providers who <strong>of</strong>fer a host <strong>of</strong> other services like furniture,<br />
catering etc. The life <strong>of</strong> tent fabric is dependent on the usage and varies from 8 to 10 years. This<br />
industry is facing threat from increasing number <strong>of</strong> hotels and banquet halls.<br />
Market size <strong>of</strong> tents and future forecast<br />
The market size <strong>of</strong> the Defence/Para military tents (also known as ‘choldhari’ tents) depends on<br />
government spending and the requirement from various armed forces. The domestic market for these<br />
tents is estimated based on the tenders floated by various government bodies and estimations by the<br />
Director General <strong>of</strong> Supplies and Disposables. The estimated withdrawal (by DGSND) <strong>of</strong> tents and<br />
accessories <strong>of</strong> tents (Tent Private MK-3, 80 Kg MK-3, store tents) for the year 2008-09 is Rs 7.3<br />
crore. The demand for tents is inclusive <strong>of</strong> the spare parts like fly sheets.<br />
The demand for tents from the government sector was 582 MT in 2007 – 08 valued at Rs. 15 crore<br />
The State government <strong>of</strong> Rajasthan was one <strong>of</strong> the largest consumers <strong>of</strong> tents in 2007-08 with<br />
estimated <strong>consumption</strong> <strong>of</strong> over Rs. 41 lakh. The police department <strong>of</strong> Andhra Pradesh consumed 1200<br />
tents in the same year. The demand from the government sector is estimated to grow at the rate <strong>of</strong> 5%<br />
based on our discussions with the industry players and tenders in the recent past. The market for tents<br />
is estimated to increase to 743 MT by 2012 -13 thus, resulting in 595MT <strong>of</strong> demand for tent fabric.<br />
The market potential for the tent fabric would be Rs 15.35 crore in 2012-13.<br />
The demand for tents from the private sector depends on the number <strong>of</strong> social functions, popularity <strong>of</strong><br />
adventurous sports etc. The increasing spending on social functions is an encouraging factor for the<br />
industry which is also facing competition from hotels, banquet halls etc. The demand is estimated to<br />
have a growth rate <strong>of</strong> 7 %.<br />
Based on industry survey, the demand is estimated to be 1,359 MT in 2007-08 valued at Rs 34 crore.<br />
This translates into 1,085 MT <strong>of</strong> demand for fabric valued at Rs 27 crore. The market for tents in the<br />
private sector is estimated to increase to 1,734 MT by 2012-13 thus, resulting in 1,388 MT <strong>of</strong> demand
for the tent fabric. The market potential for the tent fabric would be Rs 34.45 crore in 2012–13. No<br />
inflationary increase has been assumed for the price <strong>of</strong> these products.<br />
Tents 2007-08 2012-13<br />
<strong>Domestic</strong> Market size Value<br />
(Rs crore)<br />
Quantity<br />
(MT)<br />
Demand from government<br />
sector Rs 15 crore 582 MT<br />
Technical Textile Component Rs 12 crore 465 MT<br />
Value<br />
(Rs crore)<br />
Quantity<br />
(MT)<br />
Rs 19.15<br />
crore 743 MT<br />
Rs 15.35<br />
crore 595 MT<br />
Demand from private sector<br />
(Inclusive <strong>of</strong> demand for<br />
shamiyana tents) Rs 34 crore 1359 MT Rs 43.4 crore 1,734 MT<br />
Technical Textile Component Rs 27 crore 1085 MT<br />
Rs 34.45<br />
crore 1,383 MT<br />
Source: <strong>Industry</strong> survey, IMaCS Analysis<br />
Key manufacturers <strong>of</strong> the product<br />
Tent fabricators are mostly small scale industries. Most <strong>of</strong> the tent suppliers have tarpaulins in their<br />
product line and fabricate the tents as and when they receive the orders. M Kumar Udyog is a leading<br />
supplier <strong>of</strong> tents located in Kanpur with a capacity <strong>of</strong> 36,000 tents per annum. The company has four<br />
manufacturing facilities and 700 high-speed and heavy-duty sewing machines. The other<br />
manufacturers are<br />
• Madhur Enterprises Pvt. Ltd. (Kanpur)<br />
• Tirupati Taxco Product Pvt. Ltd (Kanpur)<br />
• Industrial Enterprisers (Kanpur)<br />
• Manmohan Commercials Ltd (Kanpur),<br />
• Standard Gram Udyog Sansthan (Kanpur),<br />
• Standard Niwar Mills,<br />
• A.V.R. Enterprises,<br />
• Maheshwari Textile Mills (Bikaner)<br />
• Abinitio Overseas Inc (Delhi)<br />
• Daisy Trading Corporation (Mumbai)<br />
• Bansal Industries (Delhi)<br />
These manufacturers are registered with the Director General <strong>of</strong> supplies and disposables (DGSND).
Cotton and Polyester cotton blended canvas is the most widely used fabric for tents. Gokak mills is<br />
the leading manufacturer <strong>of</strong> cotton canvas. Other manufacturers <strong>of</strong> cotton canvas are Bharat Textiles,<br />
BKS <strong>textiles</strong> Coimbatore, Giri Textiles (Bangalore) and Agilandavari Textile Mills (Coimbatore).<br />
Manufacturer Year Quantity* Value Unit Price Installed<br />
(Rs crore)<br />
capacity<br />
Gokak Mills 2007-08 27.2 lakh m 20.71 Rs 76.08/m NA<br />
Bharat Textiles & pro<strong>of</strong>ing<br />
industries Limited<br />
2002-03 8.11 lakh m 5.15 Rs 63.46/m NA<br />
*The Canvas cloth is used for other applications like footwear, bags, tarpaulins, etc.<br />
Imports & Exports <strong>of</strong> TT product<br />
The estimated import <strong>of</strong> tents and tent fabrics is as given below<br />
Imports<br />
Import Quantity<br />
HS Code Description<br />
(Rs crore)<br />
(MT)<br />
2006-07 2007-08(E) 2006-07 2007-08(E)<br />
63062100 Tents <strong>of</strong> cotton 0.0 0.0 0.01 0.0<br />
63062200 Tents <strong>of</strong> synthetic fibres 0.31 2.08 14.60 14.93<br />
63062910 Tents <strong>of</strong> jute 0.08 0.0 0.35 0.0<br />
63062990 Other tents 0.42 0.89 8.51 50.01<br />
54071012<br />
Total<br />
Unbleached tent fabrics * 0.01 0.0 0.13 0.0<br />
Imports 0.8 3.0 23.6 64.9<br />
Source:DGCIS,<br />
Analysis<br />
IMaCS<br />
*The quantity is approximated into tonnes by assuming a<br />
GSM <strong>of</strong> 200<br />
Tents are imported from China, Hong Kong, Malaysia, and Denmark etc. The imports from China<br />
account for almost 50% <strong>of</strong> the total.<br />
The estimated export <strong>of</strong> tents and tent fabrics is as given below:<br />
Exports<br />
Exports Quantity<br />
HS Code Description<br />
(in Rs crore)<br />
(MT)<br />
2006-07 2007-08(E) 2006-07 2007-08(E)<br />
63062100 TENTS OF COTTON<br />
TENTS OF SYNTHETIC<br />
2.41 1.49 96.35 69.53<br />
63062200 FIBRES 2.72 0.16 385.48 7.40<br />
63062990 OTHER TENTS 7.25 7.72 387.35 347.76<br />
UNBLECHD TENT<br />
54071012 FABRICS * 0.55 1.70 17.69 73.69<br />
54071022 BLECHD TENT FBRCS* 0.00 0.01 0.00 0.19
54071032 DYED TENT FABRICS * 0.67 0.01 348.32 140.35<br />
54071042 PRINTED TENT FBRCS* 0.01 0.00 0.20 0.00<br />
54071092 OTHR TENT FBRCS * 0.00 0.002 0.00 0.06<br />
Total<br />
Exports 13.6 11.1 1235.4 638.9<br />
Source:DGCIS, IMaCS<br />
Analysis<br />
*The quantity is approximated into tonnes by assuming a GSM <strong>of</strong><br />
200<br />
The Indian made tents are exported to Malaysia, Australia, Luxembourg, UK, France, Germany, and<br />
Italy. These countries account for about 75 % <strong>of</strong> the exports. These exports in the year 2012-13 are<br />
estimated to be around Rs 12.1 crore.<br />
Govt. <strong>of</strong> India recognized 2Star export house exports fire retardant tents for defence applications. It<br />
has a production <strong>of</strong> 50,000 linear metres per month <strong>of</strong> fire retardant fabrics.<br />
Type <strong>of</strong> Raw materials<br />
The tents are generally are made <strong>of</strong> the following fabrics:<br />
• Cotton canvas<br />
• Polyester/Poly cotton<br />
• Jute<br />
• Nylon/Ripstop nylon<br />
Pure cotton canvas and polyester cotton blended canvas (Polyester/cotton 30/70 or 50/50) are the most<br />
widely used material for making tents. Canvas cloths <strong>of</strong> 8-15 Oz per square yard are generally used<br />
for tents.<br />
The camping tents are generally made <strong>of</strong> synthetic materials as they have a higher strength to weight<br />
ratio. Nylon is a very popular material because <strong>of</strong> its excellent strength, abrasion resistance, ease <strong>of</strong><br />
drying, flexibility and resistance to attack by insects and micro-organisms. The fabric is woven<br />
ripstop when rip pro<strong>of</strong> tents are desired. Nylon, which is also used in the hot-air ballooning and<br />
parachute industries, is primarily utilized in fabrication <strong>of</strong> dome tents and ridge tents.<br />
Water pro<strong>of</strong>ing is commonly imparted by a coating <strong>of</strong> paraffin emulsion and alum acetate. Synthetic<br />
fabrics like nylon are coated with one or more polyurethane coatings in order to provide<br />
waterpro<strong>of</strong>ing. The flame retardant tents are generally made <strong>of</strong> polyester and have a vinyl coating.
Besides the outer part <strong>of</strong> tent, fabric is also used as tent lining and ground sheets. The standard lining<br />
for a canvas tent is a “desouti” or cotton lining. This is generally made from 20x20 or 16x16 denier<br />
cotton yarn with 32 threads per inch in the warp and 32 threads per square inch in the weft. Lining <strong>of</strong><br />
non-woven synthetic insulation layer <strong>of</strong> 4mm terrylene weighing 500 GSM is reported to be used by<br />
some manufacturers in western countries.<br />
Groundsheets are either separate from an inner tent or sewn in as an integral part <strong>of</strong> the tent giving<br />
wind and water pro<strong>of</strong>ing. The ground sheets are made <strong>of</strong> LDPE coated woven polypropylene (175-<br />
200 gsm), PVC coated canvas fabric (500 gsm) or Waxed cotton canvas fabric (440 gsm).<br />
Key machinery manufacturers/suppliers in India<br />
The leading manufacturers <strong>of</strong> canvas are reported to use rapier looms <strong>of</strong> Sulzer (Sultex Limited,<br />
Switzerland). Itema Weaving (India) Private Limited, Mumbai is the supplier <strong>of</strong> the same. Other<br />
domestic manufacturers/suppliers <strong>of</strong> rapier looms:<br />
Company City<br />
Aalidhra Textile Engineers Ltd. Surat<br />
Alidhra Weavetech Pvt.Ltd. Surat<br />
Amritlakshmi Machine Works Mumbai<br />
Bianco Textile Solutions (I) Pvt.Ltd. Mumbai<br />
Friends Engineering Works Panipat<br />
Himson Textile Engineering Industries Pvt. Ltd., Surat<br />
Lakshmi Automatic Loom Works Limited Coimbatore<br />
Himson Engineering Pvt. Ltd. Surat<br />
Batavia Exporters Bangalore<br />
Lifebond Machines Pvt. Ltd. Surat<br />
Source: Textile Machinery Manufacturers’ Association <strong>of</strong> India<br />
The domestic manufacturers/suppliers <strong>of</strong> coating lines are:<br />
Coating Machines/coating lines<br />
Company City<br />
A.T.E. Private. Limited Mumbai<br />
Harish Enterprise Pvt. Limited Umbergaon<br />
Kusters Calico Machinery Limited Mumbai<br />
Shreeji Engineering & Marketing Services Ahmedabad<br />
Stovec Industries Limited Ahmedabad<br />
Source: Textile Machinery Manufacturers’ Association <strong>of</strong> India<br />
Quality Control and standards in India / other countries<br />
The quality standards applicable to the tent fabrics are:<br />
Code Description
IS 7609: 1988 General requirements for tents<br />
IS 12989: 2000 Camping Tents<br />
IS 12990: 1990<br />
IS 12991: 2005<br />
IS 14445: 1997<br />
JSS: 8340-38: 2002 (Amds No 2)<br />
JSRL 8340-01: 2000 (REV No. 1) Tents<br />
JSRL 8340-02:2004 (REV No. 1): Poles Tent<br />
Camping tents - Requirements<br />
and test methods - Type L<br />
(Lightweight tents)<br />
Textiles - Camping Tents and<br />
Caravan Awnings - Vocabulary<br />
and List <strong>of</strong> Equivalent Terms<br />
Textiles - Fabrics for awnings<br />
and camping tents -<br />
Specification.<br />
Tent Extendable Frame<br />
Supported
Swimwear<br />
A swimsuit, bathing suit or swimming costume is an item <strong>of</strong> clothing designed to be worn while<br />
participating in water sports and activities such as swimming, water polo, diving, surfing, water<br />
skiing.<br />
Men's swimsuit styles are swimming trunks such as boardshorts, jammers, speedo-style briefs, thongs,<br />
g-strings or bikini. Women's swimsuits are generally either one-pieces, bikinis or thongs. The most<br />
recent innovation is the burqini, a more modest garment designed for Muslim women; it covers the<br />
whole body and head (but not face) in a manner similar to a diver's wetsuit.<br />
Special swimsuits for competitive swimming, designed to reduce skin drag. For some kinds <strong>of</strong><br />
swimming and diving, special bodysuits called ‘diveskins’ are worn. Most competitive swimmers also<br />
wear special swimsuits including partial and full bodysuits, racerback styles, jammers and racing<br />
briefs to assist their glide through the water and gain speed advantages<br />
Market dynamics and key growth drivers<br />
The market for high performance swimwear totally depends upon the popularity <strong>of</strong> competitive<br />
swimming in the country. Competitive swimming can only be promoted if there is adequate<br />
swimming infrastructure making the facility available to majority at affordable rates. In India the<br />
penetration <strong>of</strong> swimming pools is very low and even in that there are hardly any temperature<br />
maintained or heated swimming pools.<br />
Swimming in India is still to a large extent considered as a leisure activity rather than a sporting<br />
activity. Majority <strong>of</strong> the population do not know how to swim, the ratio is especially worse in the<br />
female population. Most <strong>of</strong> the people who swim do so in natural water reserves like rivers or lakes<br />
without the use <strong>of</strong> any proper swimming gear or swimsuit. Swimming in a pool is still considered a<br />
luxury accessible only to a small percentage <strong>of</strong> the total population.<br />
Modern real estate in India is developing a facility <strong>of</strong> swimming pool in most <strong>of</strong> their new<br />
construction plans. This should create more awareness about the activity and increase interest and<br />
participation in the same. However such kind <strong>of</strong> swimming does not involve the requirement for high<br />
performance swimwear. Competitive swimming will take at least another five years to become a little<br />
popular in the country. The high performance swimwear category being very expensive will only be<br />
purchased by serious enthusiasts the number for which still is very miniscule. This is expected to<br />
grow only at an average <strong>of</strong> about 5% year on year for the next five years.<br />
Product Characteristics
Suits less than 1.5 inches wide at the hips, sometimes called bikinis, are less common for sporting<br />
purposes and, unlike the racing style, are not designed specifically for drag reduction. Bikinis are<br />
most <strong>of</strong>ten worn for recreation, fashion, and sun tanning where minimal suit coverage is preferred.<br />
Unlike regular swimsuits, which are designed mainly for the physical appearances, competitive<br />
swimwear is manufactured for the purpose <strong>of</strong> aiding athletes in swim competitions. They reduce<br />
friction and drag in the water, increasing the efficiency <strong>of</strong> the swimmer's forward motion. The tight<br />
fits allow for easy movement and are said to reduce muscle vibration, thus reducing drag. In an effort<br />
to improve the effectiveness <strong>of</strong> the swimsuits, engineers have taken to designing them to replicate the<br />
skin <strong>of</strong> sea based animals, sharks in particular.<br />
The kneeskin is similar in design to the full bodyskin absent the leggings beyond the knee. It also<br />
resembles a "shortie" style wetsuit only made <strong>of</strong> drag-reducing fabric instead <strong>of</strong> neoprene and<br />
commonly features a zippered back. The bodyskin resembles the design <strong>of</strong> a diveskin, commonly<br />
used by snorkelers and scuba divers for warm weather climates.<br />
Raw Material<br />
Swimsuit manufacturers like to introduce new swimsuits made from different types <strong>of</strong> fabric into the<br />
market in order to produce unique swimsuit. The key fabrics used for swimsuit manufacturing are:<br />
• Cotton: Swimsuits and bikinis made entirely from cotton are becoming popular. While cotton<br />
swimsuits are fashionable, they do not always provide the best fit or the greatest overall longevity<br />
in a swimsuit. Cotton swimsuits are not known for staying in place on the body, and they have a<br />
tendency to ride up and bunch (an undesirable characteristic in any swimsuit). As a fabric, cotton<br />
does not stand up long to the destructive nature <strong>of</strong> chlorine and sun. It is likely that cotton<br />
swimsuit will fade fairly quickly, especially if swimming in chlorinated pools.<br />
• Spandex/Lycra: Most swimsuits contain some percentage <strong>of</strong> spandex or Lycra in their fabric.<br />
These fabrics provide the stretchy fit that allows a swimsuit to stay in place on the body.<br />
Generally, the higher the percentage <strong>of</strong> spandex or Lycra in the swimsuit material, the more the<br />
swimsuit is designed for more serious or competitive swimming. While high-spandex materials<br />
cover the body well and smooth out any unsightly body bulges, they can become tight and<br />
uncomfortable. Also, spandex has a tendency to run if snagged on the side <strong>of</strong> a concrete pool or<br />
on a wooden lounge chair. Suits made from spandex and provide little thermal protection, but<br />
they do protect the skin from stings and abrasion. Because high-spandex swimsuits are designed<br />
for use in serious and competitive swimming pursuits, however, they are <strong>of</strong>ten treated for chlorine
esistance. While this chlorine resistance does not provide complete protection from chlorine, it<br />
does significantly lengthen the lifetime <strong>of</strong> the swimsuit.<br />
• Metallic Overlay: Swimsuits with metallic overlay sewn into the fabric are designed to be<br />
fashionable and not to hold up and endure extensive swimming. The overlay is guaranteed to fray<br />
and dull after only a short amount <strong>of</strong> time.<br />
• Velvet: Swimsuits made from velvet and other types <strong>of</strong> crushed fabrics have become more<br />
popular in recent years. A velvet swimsuit is definitely nice to look at and to touch, but it is not<br />
best for either swimsuit fit or longevity. When wet, velvet has a tendency to soak up water, and<br />
can become quite heavy and sodden. This heaviness causes a velvet swimsuit to sag away from<br />
the body, losing the tight fit that is so necessary in a swimsuit. Also, velvet is not a fabric meant<br />
to come in close contact with chlorine. Like swimsuits with metallic overlay, velvet swimsuits are<br />
much more valuable for their uniqueness and style factors than they are for their longevity.<br />
Swim briefs are most <strong>of</strong>ten made <strong>of</strong> a nylon and spandex (Lycra) composite, while some longer<br />
lasting suits are made from polyester and still others from other materials. Most swim briefs have a<br />
beige or white front lining made <strong>of</strong> a similar fabric.<br />
Kneeskins and bodyskins are normally made <strong>of</strong> technologically advanced lycra-based fabrics<br />
designed to hug the body tightly and provide increased speed and decreased drag resistance in the<br />
water.<br />
The LZR Racer Suit is a line <strong>of</strong> high-end swim suits manufactured by Speedo using a high-technology<br />
swimwear fabric composed <strong>of</strong> woven elastane-nylon and polyurethane.<br />
The current and future forecast <strong>of</strong> high performance swimwear <strong>consumption</strong> is given below:-<br />
The size <strong>of</strong> high performance swimwear in India is very small. The current <strong>consumption</strong> <strong>of</strong> the same<br />
in 2007-08 is under Rs 1 crore at only Rs 84 lakhs. It is expected to grow at a CAGR <strong>of</strong> 5% for the<br />
next five years and reach a size <strong>of</strong> Rs. 1.08 crore which is also not a significant number.<br />
Market size <strong>of</strong> High performance<br />
swimwear<br />
2007-08 2012-13<br />
Quantity 1050 pieces 1350 pieces<br />
Value Rs 0.84 crore Rs 1.08 crore
Key manufacturers <strong>of</strong> Swimwear<br />
Source: <strong>Industry</strong> survey, IMaCS Analysis<br />
The manufacturing <strong>of</strong> swimwear in India is highly unorganized with various indigenous players<br />
spread across the country. The production <strong>of</strong> swimwear in India does not consist <strong>of</strong> the high<br />
performance swimwear segment and comprises mainly <strong>of</strong> the fashion swimwear only.<br />
Imports & Exports <strong>of</strong> Swimwear<br />
There are high imports <strong>of</strong> swimwear from India but these are more fashion swimwear than high<br />
performance swimwear. The very small market <strong>of</strong> high performance swimwear in India is met<br />
through imports.<br />
The estimated import figures for swimwear are as given below:-<br />
HS Code Description<br />
61123100,<br />
61123920/90,<br />
61124100,<br />
61124910/20/90,<br />
62111100,<br />
62111200<br />
Swimwear<br />
Imports<br />
Quantity<br />
Imports<br />
(in Rs crore)<br />
2007-08(E) 2007-08(E)<br />
142.07<br />
thousand<br />
numbers<br />
1.8616<br />
Source: DGCIS, IMaCS Analysis<br />
In chapter 61 over 80% <strong>of</strong> the swimwear imports are from China. Rest takes place from various<br />
countries like Italy, France, Sweden, UK, Spain and Tunisia. Under Chapter 62 around 30% <strong>of</strong> the<br />
imports are from China. Around 18% <strong>of</strong> imports are from UK, 13% from Cambodia, 12% from Italy<br />
and 8% from Hong Kong. The imports from European countries are mainly higher in value than<br />
others.<br />
Exports <strong>of</strong> Swimwear<br />
The estimated export figures for swimwear are as given below:-<br />
HS Code Description<br />
Exports<br />
Quantity<br />
Exports<br />
(in Rs crore)
61123100,<br />
61123990,<br />
61124100,<br />
61124910/90,<br />
62111100,<br />
62111200<br />
Swimwear*<br />
2007-08(E) 2007-08(E)<br />
2447.36<br />
thousand<br />
numbers<br />
54.6228<br />
Source: DGCIS, IMaCS Analysis<br />
* This primarily consists <strong>of</strong> fashion swimwear with hardly any share <strong>of</strong><br />
high performance swimwear<br />
In chapter 61 the maximum exports are to USA, Spain, UK and Italy. Canada, Ireland and UAE also<br />
have small share. In chapter 62 around 37% <strong>of</strong> exports are to USA, 15% to France and UK each and<br />
around 5% to Italy.<br />
Key importers<br />
The famous international brand Speedo, who has the highest share in swimwear internationally, is the<br />
highest importer high performance swimwear in India. To some extent high performance swimwear is<br />
also imported by other international brands like Nike, Adidas, Reebok and Puma.
BUILDTECH<br />
The Buildtech segment comprises <strong>of</strong> <strong>textiles</strong> or composite materials used in the construction <strong>of</strong><br />
permanent and temporary buildings as well as structures. The products covered under Buildtech are<br />
given below:-<br />
• Architectural membranes<br />
• Hoardings & signages<br />
• Cotton canvas Tarpaulins<br />
• HDPE Tarpaulins<br />
• Awnings & canopies<br />
• Scaffolding nets<br />
• Floor & wall coverings<br />
The market size <strong>of</strong> the Buildtech segment has been estimated at Rs 1,726 crore. HDPE and Cotton<br />
canvas tarpaulins account for 65% <strong>of</strong> the Buildtech market size. The HDPE tarpaulins are valued at<br />
Rs 650 crore and account for around 40% <strong>of</strong> the segment share. HDPE Tarpaulins are likely to<br />
achieve growth rate in excess <strong>of</strong> 15% to reach Rs 1,330 crore by 2012-13.<br />
The cotton canvas tarpaulin is the second largest product in this segment valued at Rs 457 crore with a<br />
share <strong>of</strong> around 25%. However, the demand <strong>of</strong> cotton canvas tarpaulins is expected to decline because<br />
<strong>of</strong> substitution by HDPE tarpaulins.<br />
The Floor & wall coverings are rapidly growing <strong>technical</strong> <strong>textiles</strong> products accounting for around<br />
25% <strong>of</strong> the segment value. They are estimated to grow at around 10% year on year from Rs 425 crore<br />
to Rs 685 crore.<br />
The flex market (hoardings & signages) is estimated to grow from around 95 million square meters<br />
valued at Rs. 175 crore in 2007-08 to around 140 million square meters by 2012 –13 (growing at the<br />
rate <strong>of</strong> around 8% year on year) valued at Rs 258 crore.<br />
Architectural membranes are expected to grow at a CAGR <strong>of</strong> 20% to reach a size <strong>of</strong> Rs 40 crore by<br />
2012-13 from Rs 16 crore in 2007-08. Scaffolding nets and awnings and canopies account for the<br />
remaining Buildtech market with sizes <strong>of</strong> Rs 0.58 crore and Rs 2.25 crore respectively.<br />
The Buildtech segment is estimated to grow at a CAGR <strong>of</strong> around 9% to Rs 2,655 crore by 2012-13.
Summary <strong>of</strong> the market-sizing for Buildtech<br />
Architectural<br />
membranes<br />
Hoardings &<br />
signages<br />
Cotton<br />
canvas<br />
Tarpaulins<br />
HDPE<br />
Tarpaulins<br />
Awnings &<br />
canopies<br />
Scaffolding<br />
nets<br />
Floor & wall<br />
coverings<br />
TOTAL<br />
Quantity<br />
Value<br />
Quantity<br />
Value<br />
Quantity<br />
Value<br />
Quantity<br />
Value<br />
Quantity<br />
Value<br />
Quantity<br />
Value<br />
Quantity<br />
Value<br />
Value<br />
Production Imports Exports<br />
1 million<br />
sq. m.<br />
10 million<br />
meters<br />
2007-08 2012-13<br />
-<br />
<strong>Domestic</strong><br />
Consumption<br />
11 million<br />
sq. m.<br />
<strong>Domestic</strong><br />
Consumption<br />
27.5 million<br />
sq. m.<br />
Rs 1 crore Rs 15 crore - Rs 16 crore Rs 40 crore<br />
4.5 million<br />
meters<br />
Rs 14<br />
crore<br />
52 million<br />
sq m<br />
Rs 396<br />
crore<br />
70,000<br />
MT<br />
Rs 650<br />
crore<br />
0.134<br />
million sq<br />
m<br />
Rs 1.75<br />
crore<br />
0.4 million<br />
sq m<br />
Rs 0.58<br />
crore<br />
75 million<br />
sq m<br />
Rs 750<br />
crore<br />
Rs 1,813<br />
crore<br />
90.5 million<br />
meters<br />
Rs 161<br />
crore<br />
9 million sq<br />
m<br />
-<br />
95 million<br />
meters<br />
140 million<br />
meters<br />
- Rs 175 crore Rs 258 crore<br />
0.01<br />
million sq<br />
m<br />
61 million sq<br />
m<br />
45 million sq<br />
m<br />
Rs 66 crore Rs 5 crore Rs 457 crore Rs 336 crore<br />
500-600<br />
MT<br />
Rs 1.75<br />
crore<br />
0.016<br />
million sq m<br />
400-500<br />
MT<br />
Rs 1.25<br />
crore<br />
-<br />
70,000 MT 1,13,000 MT<br />
Rs 650 crore<br />
0.15 million<br />
sq. m.<br />
Rs 1,330<br />
crore<br />
0.3 million<br />
sq. m.<br />
Rs 0.5 crore - Rs 2.25 crore Rs 4.5 crore<br />
- -<br />
0.4 million<br />
sq m<br />
0.8 million sq<br />
m<br />
- - Rs 0.58 crore Rs 1.17 crore<br />
7 million sq<br />
m<br />
Rs 100<br />
crore<br />
Rs 344<br />
crore<br />
15 million<br />
sq m<br />
Rs 425<br />
crore<br />
Rs 431<br />
crore<br />
67 million sq<br />
m<br />
108 million<br />
sq m<br />
Rs 425 crore Rs 685 crore<br />
Rs 1,726<br />
crore<br />
As per ECTT report, the potential market sizing for 2007-08 was as given below:-<br />
Market size<br />
(ECTT report)<br />
2001-02 2007-08 (P)<br />
Rs 2,655<br />
crore<br />
Export<br />
Potential<br />
-<br />
-<br />
Rs 5.5<br />
crore<br />
Rs 1.4<br />
crore<br />
-<br />
-<br />
Rs 570<br />
crore<br />
Rs 577<br />
crore
Hoardings &<br />
signages<br />
Tarpaulins<br />
Awnings & canopies<br />
Scaffolding nets<br />
Quantity 5 million meters 20 million meters<br />
Value Rs 50 crore Rs 200 crore<br />
Quantity<br />
Value Rs 1,000 crore Rs 1,000 crore<br />
Quantity 45,454 sq. meters 1,36,363 sq. meters<br />
Value Rs 1 crore Rs 3 crore<br />
Quantity 40,000 sq. m. 90,000 sq. m.<br />
Value Rs 0.1 crore Rs 0.25 crore<br />
TOTAL Value Rs 1,051.1 crore Rs 1,503.25 crore<br />
Performance <strong>of</strong> key players <strong>of</strong> Buildtech<br />
Company Name<br />
Uniproducts (India) Ltd. 57.1 76.4 2.8% 2.9%<br />
Source: Prowess Database, IMaCS Analysis<br />
Buildtech segment <strong>of</strong> <strong>technical</strong> <strong>textiles</strong> is estimated to provide employment to 63,000 people 16 <strong>of</strong><br />
whom number <strong>of</strong> <strong>technical</strong> 17 employees is estimated at 33,000 and number <strong>of</strong> non-<strong>technical</strong><br />
employees is estimated at 30,000.<br />
Capital Employed<br />
(Rs crore)<br />
Net Pr<strong>of</strong>it Margin<br />
(%)<br />
2006-07 2007-08 2006-07 2007-08<br />
Alps Industries Ltd. 518.8 752.5 7.0% 1.8%<br />
Binny Ltd. 78.9 76.9 -64.0% -18.6%<br />
Birla Corporation Ltd. 788.7 1100.8 18.0% 19.5%<br />
Entremonde Polyecoaters Ltd. 6.5 7.3 2.5% 2.3%<br />
Forbes & Co. Ltd. 491.8 287.3 1.4% 0.8%<br />
Gokak Textiles Ltd. NA 194.9 NA -1.7%<br />
Gujarat Craft Inds. Ltd. 5.4 8.4 0.5% 1.1%<br />
Mafatlal Industries Ltd. 70.0 150.9 -39.1% 7.1%<br />
Rishi Packers Ltd. 18.4 15.6 1.6% -4.6%<br />
S R F Ltd. 1285.9 1330.9 14.6% 7.7%<br />
Sravya Textiles Ltd. 10.8 NA -1.3% NA<br />
16 Employment has been estimated based on the analysis <strong>of</strong> primary and secondary data available for the<br />
<strong>technical</strong> textile manufacturers. IMaCS has made appropriate adjustments because <strong>of</strong> insufficient data.
The key impediments to growth <strong>of</strong> Buildtech products are:-<br />
1. Low awareness level <strong>of</strong> buildtech products<br />
2. The usage <strong>of</strong> buildtech products at construction sites is not mandatory. For example, the<br />
Indian Building Laws do not stipulate the use <strong>of</strong> scaffolding nets at construction sites.<br />
3. The architectural membrane market has huge potential, however, the demand for the products<br />
is low because the Indian manufacturers are unable to supply desired product quality<br />
4. The hoarding and signage industry is facing tough price competition from Chinese imports<br />
5. The <strong>technical</strong> know-how to manufacture the awnings and canopies is not available in India.<br />
Hence, these products have to be imported.<br />
17 Technical includes managerial staff and skilled labour whereas non-<strong>technical</strong> includes unskilled labour.
Architectural Membranes<br />
Architectural membranes are relatively new construction materials being used in India. The<br />
applications <strong>of</strong> architectural membranes include construction <strong>of</strong> permanent and semi-permanent<br />
structures such as car park covers, cafes, walkways, hotels, outdoor entertainment areas, pool<br />
surrounds, greenhouses, airports, stadiums, sports halls, exhibitions and display halls, storage bases<br />
for industrial and military supplies and any venues that require protection against harsh UV rays, heat,<br />
glare, rain and wind. The textile structures used for construction material can be classified into the<br />
following types:<br />
• Clear-span structures: These structures provide a clear space beneath the fabric, free from<br />
supporting elements. Clear span structures are less permanent than air or tensile structures<br />
however, they accommodate doors, flooring, insulation, electricity and HVAC easily as<br />
compared to tents.<br />
• Tension structures: In this structure, the fabric is supported by metal pylons, tensioning<br />
cables, wooden or metal frameworks. A relatively minimal rigid support system is required<br />
for these structures since the fabric carries most <strong>of</strong> the load.<br />
• Air Structures: The main components <strong>of</strong> an air supported system are the envelope (fabric),<br />
inflation system (fans), anchorage system (cables and foundation), doors and access<br />
equipment. Air pressure inside the envelope provides tensioning and maintains required<br />
configuration and stability.<br />
Product characteristics<br />
Architectural membranes are strong, energy efficient and aesthetically superior products that <strong>of</strong>fer<br />
flexibility to designers and architects thus, allowing high levels <strong>of</strong> creativity. The textile material used<br />
for construction purpose is expected to be:<br />
• Waterpro<strong>of</strong><br />
• Fire retardant<br />
• Resistant to deformation and extension under tension<br />
• Impermeable to air and wind<br />
• Resistant to abrasion and mechanical damage<br />
• Resistant to sunlight and acid rain<br />
• Resistant to microbial attack<br />
Depending on application, the fabric may need to transmit or reflect different levels <strong>of</strong> light. The most<br />
widely used materials are:
• PVC coated polyester<br />
PVC coated high tenacity polyester fabric with weight ranging from 600 gsm to 1100 gsm is used<br />
for construction applications. The polyester base cloth is used because <strong>of</strong> its durability, strength<br />
and relatively low cost. The base cloth is coated with PVC to impart the color, strength and<br />
waterpro<strong>of</strong> properties. PVC coating also allows adjoining panels <strong>of</strong> fabric to be seamed by high<br />
frequency welding.<br />
Most architectural PVC coated polyester fabrics have some sort <strong>of</strong> top-coating on their exterior<br />
surface which improves the appearance <strong>of</strong> material, extends its life and allows self cleaning <strong>of</strong><br />
material by rain water. Different types <strong>of</strong> top-coatings include acrylic solutions, PVDF solutions<br />
and PVF film laminations.<br />
Acrylic topcoat: This is the most economical and most widely available finish. It gives a<br />
transparent glossy finish to the PVC. The acrylic coatings have a good resistance to UV<br />
degradation. It is a thin coating, thus, this material is easy to fabricate and repair. Acrylic top-<br />
coats give the material a ten-year lifespan depending on the ambient climatic conditions and air<br />
quality at the site where it is installed.<br />
Polyvinylidene fluoride topcoat: This finish <strong>of</strong>fers resistance to UV degradation, atmospheric<br />
chemical attack, algae and fungal attack thus, is far superior to the acrylic topcoat. These<br />
properties result in a membrane lifespan <strong>of</strong> 15 to 20 years depending on site conditions. Like<br />
acrylic top-coats, they are highly flexible and resistant to cracking, making them easy to handle<br />
during installation. Though, owing to chemical-resistant properties <strong>of</strong> PVDF the finished top-<br />
coated material cannot be welded. The top-coating must be abraded <strong>of</strong>f to effect welding which<br />
increases the cost <strong>of</strong> fabrication and involves risk.<br />
PVDF/PVC top-coating: This is effectively a dilution <strong>of</strong> the PVDF topcoat; the finished fabric is<br />
weldable thus, <strong>of</strong>fering saving in fabrication costs. Fabrics with this coating have a life<br />
expectancy <strong>of</strong> 10 to 15 years, depending on prevailing conditions.<br />
Tedlar top-coating: Tedlar is the trade name for polyvinyl fluoride (PVF). This is a film-layer<br />
that is laminated to the fabric during manufacture. This results in a thicker finished fabric that is<br />
more resistant than its competitors to weather and chemical attack. It has superior self-cleaning<br />
capabilities than the PVDF range <strong>of</strong> topcoatings and resists attack from graffiti, acid rain and bird<br />
droppings. For this reason it is frequently specified for use in highly industrialized areas, high<br />
saline coastal zones and desert environments. Having a thicker coating, it erodes at a much slower<br />
rate giving it a life expectancy <strong>of</strong> about 25 years depending on conditions.
The Tedlar film renders the PVC sheet non-weldable. This problem is overcome by butt welds.<br />
Tedlar topcoated material is comparable in price to PVDF but substantially less costly than PTFE<br />
coated glass fiber.<br />
• Polytetrafluoroethylene (PTFE) coated glass fabric<br />
PTFE coated glass fabric is a frequently specified material due to its life expectancy <strong>of</strong> 30 years,<br />
depending on conditions. The woven fiberglass is incombustible, strong and does not undergo<br />
significant stress relaxation. The PTFE or Teflon coating is incombustible and has good self-<br />
cleaning ability.<br />
Fabrication <strong>of</strong> a PTFE membrane requires slow and specialized welding techniques under<br />
controlled environmental conditions. It also requires extra care in handling and packaging due to<br />
susceptibility to cracking and self-abrasion. These properties contribute to its high cost and to the<br />
need for additional tensioning hardware for the finished fabric structure. The tensioning <strong>of</strong> PTFE<br />
glass fabric is a slow process, as it requires incremental adjustment over long periods <strong>of</strong> time on<br />
site. This factor also contributes to its higher cost.<br />
Market dynamics and key growth drivers<br />
In India, stadiums, airports, restaurants, hotels, residential complexes and shopping malls account for<br />
majority <strong>of</strong> application <strong>of</strong> architectural membranes. According to industry experts, tensile structures<br />
are now well accepted by the architects and builders on account <strong>of</strong> their light weight, aesthetic<br />
superiority and the design flexibility <strong>of</strong>fered by the product. The market for architectural membranes<br />
is at a nascent stage. The demand surged over the last two years growing at a rate <strong>of</strong> 30% on account<br />
<strong>of</strong> increased awareness about the product and booming infrastructure projects. The demand for<br />
architectural membranes is expected to further increase on account <strong>of</strong> its increasing popularity and the<br />
boom in infrastructure projects.<br />
Market size <strong>of</strong> architectural membranes<br />
Based on discussions with industry experts, the current market size <strong>of</strong> tensile membrane fabric is<br />
estimated at Rs. 1.1 lakh square meters valued at Rs. 16 crore. The market for tensile structures is<br />
expected to grow on account <strong>of</strong> its increasing popularity among the architects as well as booming<br />
infrastructure in the country. The demand <strong>of</strong> fabric is expected to increase to 2.75 lakh square meters<br />
by 2012-13 (growing at a CAGR <strong>of</strong> 20%). The market potential in 2012-13 is expected to be Rs. 40<br />
crore. No inflationary increase has been assumed for the price <strong>of</strong> the material.<br />
The current and future forecast <strong>of</strong> the <strong>consumption</strong> <strong>of</strong> architectural membranes is given below:-
Market size <strong>of</strong> tensile<br />
membrane fabric<br />
Quantity<br />
2007-08 2012-13<br />
1.1 lakh square<br />
meters<br />
2.75 lakh<br />
square meters<br />
Value Rs. 16 crore Rs. 40 crore<br />
Key manufacturers <strong>of</strong> architectural membranes<br />
Source: <strong>Industry</strong> survey, IMaCS Analysis<br />
Entremonde Polycoaters Ltd. is the manufacturer <strong>of</strong> tensile membranes in India. The company<br />
manufactures double side PVC coated polyester fabrics with weight ranging from 600 gsm to 1100<br />
gsm. The company also has in-house fabrication facility with Hot air, Hot wedge and HF welding<br />
techniques.<br />
Manufacturer Year Product Production Installed<br />
Coated fabric<br />
quantity** capacity<br />
Entermonde Polycoaters 2007-08 for awnings/ 14,364 meters NA<br />
tensile fabric<br />
**This includes the awning fabric, tensile fabric, etc.<br />
Imports and Exports <strong>of</strong> architectural membranes<br />
The estimated figure <strong>of</strong> import <strong>of</strong> architectural membrane is:<br />
HS Code Description<br />
39269099<br />
39219029<br />
PTFE TENSILE MEMBRANE<br />
/ OTHER SHEETS, FILM,<br />
FOIL STRIP, ETC OF<br />
POLYMER OF VINYL<br />
CHLORIDE/OTHER<br />
Imports<br />
(in square meters)<br />
Imports<br />
(in Rs crore)<br />
2007-08(E) 2007-08(E)<br />
Around 1 lakh square<br />
meters<br />
~ Rs 15 crore<br />
Source: IBIS, IMaCS Analysis<br />
Majority <strong>of</strong> architectural membranes are imported from Germany, Australia and China.<br />
The architectural membranes are not exported from India.<br />
Key importers<br />
Sujan Impex Pvt. Ltd., Meridian Architectural Systems Pvt. Ltd. and Construction Catalysers are the<br />
key importers <strong>of</strong> tensile membrane in India. Sujan Impex Pvt. Ltd. represents Ferrari Group (France)
for Ferrari ® Precontraint Coated Fabric. Meridian Architectural Systems Pvt. Ltd. imports tensile<br />
membranes from Mehler Haku Coated Fabrics, Germany. Mehler texnologies also has an <strong>of</strong>fice in<br />
India that imports the architectural membrane for projects in India. Similary, Verseidag Technologies,<br />
Germany also has an <strong>of</strong>fice in India to supply the material.<br />
Type <strong>of</strong> raw materials<br />
Synthetic fibres are used for manufacturing <strong>of</strong> architectural membranes because <strong>of</strong> their properties<br />
such as good strength, hydrophobicity, rot and fungi resistance which are essential properties <strong>of</strong><br />
fabrics to be used as building and construction materials. The most widely used materials are :-<br />
PVC Coated Polyester Materials<br />
High tenacity polyester base fabric coated with PVC is used for majority <strong>of</strong> application. The base<br />
fabric is woven or knitted to highly controlled specifications in order to impart desired properties. The<br />
most commonly used weaves are plain weave, panama weave, precontraint and Malimou.<br />
PVC coated fabric is topcoated with acrylic solutions, PVDF solutions or PVF film laminations. The<br />
topcoats are applied in different ways depending on the nature <strong>of</strong> the topcoat and the required<br />
thickness. Lacquers are sprayed, whereas thicker coatings are "knife applied" or laminated to the<br />
PVC.<br />
Polytetrafluoroethylene (PTFE) Coated Glass Fabric<br />
The base fabric is made up <strong>of</strong> glass fibers that are drawn into continuous filaments and then bundled<br />
together in yarns. The yarns are then woven to form a substrate. The base fabric is then coated with<br />
Polytetrafluoroethylene or Teflon.<br />
Key machinery manufacturers/suppliers in India<br />
The domestic manufacturers/suppliers <strong>of</strong> coating lines are:<br />
Coating Machines / coating lines<br />
Company City<br />
A.T.E. Private. Limited Mumbai<br />
Harish Enterprise Pvt. Limited Umbergaon<br />
Kusters Calico Machinery Limited Mumbai<br />
Shreeji Engineering & Marketing Services Ahmedabad<br />
Stovec Industries Limited Ahmedabad<br />
Source: Textile Machinery Manufacturers’ Association <strong>of</strong> India
Quality Control and Standards<br />
The parameters tested by Indian manufacturers for tensile membrane along with the test methods are<br />
mentioned in the table below:<br />
Parameter Test Method<br />
Fire retardancy BS 3119<br />
Physical Testing IS-7016<br />
Tearing Strength (Tongue Tear) BS-3424 7A<br />
Resistance to Heat & Loss <strong>of</strong> Mass IS: 1259<br />
Water Repellency IS-390<br />
Source: <strong>Industry</strong> survey<br />
The desired properties depend on the end application and desired life <strong>of</strong> the tensile structure.
Hoardings / Signages<br />
Hoardings / Signages are made <strong>of</strong> a translucent flexible textile substrate called flexible-face sign<br />
fabric. Flexible-face sign fabric, also known as flex was developed as an alternative to rigid-faced<br />
substrates like acrylic, plastic and polycarbonates. Besides hoardings, this material has applications in<br />
light boxes, exhibits, trade show displays and majority <strong>of</strong> other static out <strong>of</strong> home (OOH) advertising.<br />
Flex is preferred over its rigid counterparts since the material <strong>of</strong>fers flexibility in taking on graphics. It<br />
is amenable to screen printing, inkjet printing or painting, thus opening up more channels <strong>of</strong><br />
creativity. As a result, print consistency can be maintained across locations. It is possible to produce<br />
large seamless signages using flex. Since this material is designed to withstand winds <strong>of</strong> speed 110 to<br />
140 miles per hour, it is ideal for huge billboards on the expressways and national highways.<br />
Moreover, it can be easily transported because <strong>of</strong> its light weight and ease <strong>of</strong> handling.<br />
Product characteristics<br />
Flex is made <strong>of</strong> a PVC coated polyester warp knitted fabric. The fabric is made from high tenacity<br />
polyester filament yarn <strong>of</strong> denier ranging from 250 to 500. This fabric is coated with PVC and surface<br />
treated with lacquer. The material has the following properties:<br />
• Light transmission<br />
• Printability<br />
• Ultra Violet resistance<br />
• Heat Sealability<br />
• Mildew resistance<br />
• Anti wicking<br />
Flex is available in different varieties depending on its application. The flex used for front-lit<br />
hoardings is available in GSM ranging between 280 and 370 and that for back-lit hoardings is<br />
available in GSM ranging from 450 to 650.<br />
Market dynamics and key growth drivers<br />
Flex is the most preferred material for hoardings / signages and other static OOH media which<br />
together account for 90% <strong>of</strong> the OOH advertising industry. OOH media has assumed great<br />
significance because <strong>of</strong> considerable shift in consumers’ lifestyles and suburban growth. Consumers<br />
spend an average <strong>of</strong> four hours a day travelling, shopping and eating at out-<strong>of</strong>-home areas like<br />
airports, shopping malls, restaurants and multiplexes which has resulted in increased importance <strong>of</strong><br />
OOH media at these spaces. The OOH advertising industry grew at 20-25% in 2006-07and is<br />
expected to grow at a CAGR <strong>of</strong> 14% over the next five years.
Hoardings are facing resistance because <strong>of</strong> potential traffic hazards as well as environmental hazards,<br />
specifically in cities like Chennai, Delhi and Mumbai. On the other hand, new/refurbished airports,<br />
highways, street furniture and mushrooming retail space present opportunities for significant growth.<br />
Though the use <strong>of</strong> digital media i.e. LCD, LED is expected to reduce the share <strong>of</strong> static advertising,<br />
the rate <strong>of</strong> adoption <strong>of</strong> digital media is slow. Thus, flex is expected to continue as preferred media for<br />
the OOH advertising industry.<br />
The market for flex is no more quality conscious because <strong>of</strong> reduced campaign life and significant<br />
cost pressures. Over the last few years the market has observed a significant reduction in price <strong>of</strong> flex<br />
because <strong>of</strong> cheaper Chinese imports. The selling price <strong>of</strong> front-lit flex reduced from Rs. 6.8 to 7 per<br />
square foot in 2002-03 to Rs. 2 to 2.5 per square ft in 2007-08. Similarly, the price <strong>of</strong> back-lit flex<br />
reduced from Rs. 11 to 15 per square foot in 2002-03 to Rs. 5 to 6 per square ft in 2007-08.<br />
Market size <strong>of</strong> hoardings/signages fabric and future forecast<br />
Hoardings account for majority <strong>of</strong> the <strong>consumption</strong> <strong>of</strong> flex in India. On an average, each metro has<br />
3000 hoardings (legal as well as unauthorised) measuring 450 square feet to 40 square feet with<br />
campaign duration <strong>of</strong> 10 days to a month. The campaign duration in other cities is around a month to<br />
two months.<br />
Usage <strong>of</strong> flex for hoardings<br />
No <strong>of</strong> cities Used by<br />
corporate<br />
No. <strong>of</strong> hoardings per city<br />
Municipal<br />
Elections<br />
Trade Shows<br />
/ Festivals etc<br />
Mega cities - pop>4mn 7 3000 7500 4000<br />
Metro cities - pop>1mn 28 1500 5000 3000<br />
Class I cities/towns ( pop>1<br />
lakh)<br />
388 250 2000 1000<br />
Other cities 4738 25 750 0<br />
Usage <strong>of</strong> flex in Hoardings 95%<br />
Total No <strong>of</strong> flex hoardings<br />
264,528 859,180 475,000<br />
SIZE OF HOARDING % Break-up<br />
30" x 15" 10% 26453 85918 47500<br />
25" x 10" 20% 52906 171836 95000<br />
15" x 5" 25% 66132 214795 118750<br />
10" x 8" 10% 26453 85918 47500<br />
8" x 5" 35% 92585 300713 166250<br />
Usage/Replacement<br />
frequency (per year)<br />
12 1 1<br />
Total demand <strong>of</strong> flex<br />
40 11 6<br />
hoardings (million sq. m.)
Usage <strong>of</strong> flex for banners/hoardings at the malls<br />
Number Average<br />
area (sq ft)<br />
Frequency <strong>of</strong><br />
change (per<br />
annum)<br />
Flex usage<br />
per annum<br />
(sq m)<br />
No <strong>of</strong> banners 100 180 6 10,000<br />
No <strong>of</strong> backlit 50 30 1 Approx 150<br />
No <strong>of</strong> malls 500<br />
Total demand <strong>of</strong> flex at<br />
malls (million sq. m.)<br />
5<br />
Usage <strong>of</strong> flex for banners/hoardings at the retail stores<br />
Number Average<br />
area (sq ft)<br />
Frequency <strong>of</strong><br />
change (per<br />
annum)<br />
No <strong>of</strong> banners 2 24 4 18<br />
No <strong>of</strong> retail stores in India 25,000,000<br />
Penetration <strong>of</strong> flex 5%<br />
Total demand <strong>of</strong> flex at<br />
retail stores (million sq. m.)<br />
22<br />
Flex usage<br />
per annum<br />
(sq m)<br />
In addition, flex is also used for assembly and Loksabha elections, other special events, etc. The usage<br />
<strong>of</strong> flex in these applications is around 10-15% <strong>of</strong> the total usage.<br />
Current market size and future potential<br />
The market size <strong>of</strong> flex for hoardings is estimated at 57 million square meters while for malls and<br />
retail stores at 27 million square meters. Usage <strong>of</strong> flex for assembly/loksabha elections and other<br />
special events is estimated at around 11 million square meters. Thus, the total market for flex fabric is<br />
estimated to be around 95 million square meters valued at Rs. 175 crore. Majority <strong>of</strong> the unauthorised<br />
hoardings are expected to be removed over the next five years thus affecting the flex demand. On the<br />
other hand new/refurbished airports, highways and street furniture are likely to augment the demand<br />
<strong>of</strong> flex. The demand <strong>of</strong> flex for hoardings is expected to grow at a CAGR <strong>of</strong> 9% over the next five<br />
years. The demand <strong>of</strong> flex in the organised retail sector (malls) is expected to increase at a CAGR <strong>of</strong><br />
30% and in the unorganised retail sector at a CAGR <strong>of</strong> 9% over the next five years, in line with the<br />
growth <strong>of</strong> retail industry in India. Hence, the demand <strong>of</strong> flex is expected to increase to 140 million<br />
square meters by 2012-13 (growing at a CAGR <strong>of</strong> around 9% over the next five years). The market<br />
potential in 2012-13 is estimated at Rs. 258 crore. No change (upwards or downwards) in the price <strong>of</strong><br />
flex has been assumed for deriving the projected market size. The current and future forecast <strong>of</strong> flex<br />
<strong>consumption</strong> is given below:-<br />
Market size <strong>of</strong> hoarding 2007-08 2012-13
fabric<br />
Quantity<br />
95 million sq m<br />
or 31,500 MT<br />
140 million sq m<br />
or 46,421 MT<br />
Value Rs. 175 crore Rs. 258 crore<br />
Key manufacturers <strong>of</strong> flex for hoardings/signages<br />
Source: <strong>Industry</strong> survey, IMaCS Analysis<br />
SRF Limited, Entermonde Polycoaters and Centannial Fabrics were the key manufacturers <strong>of</strong> flex in<br />
India. However, because <strong>of</strong> increasing competition from cheap Chinese imports the companies have<br />
stopped manufacturing flex since last four to five years. At present, the domestic demand <strong>of</strong> this<br />
fabric is largely met through imports, primarily from China. There are a few producers (like Delhi<br />
Tirpal House, etc.) who cater to around 5% <strong>of</strong> the domestic demand.<br />
Imports and Exports <strong>of</strong> flex for hoardings/signages<br />
The import figure <strong>of</strong> flex for hoardings/signages is as given below:-<br />
HS Code Description<br />
39204900, 39203090,<br />
39205919, 39209999,<br />
39199090, 39205911,<br />
39199090*<br />
FLEX BANNER (FRONT-<br />
LIT OR BACK-LIT),<br />
INKJET MEDIA FOR<br />
BANNERS, PVC SELF-<br />
ADHESIVE VINLY FOR<br />
SIGNAGES<br />
Imports Imports<br />
(in Rs. crore)<br />
2007-08(E) 2007-08(E)<br />
Around 90<br />
million sq m or<br />
30,000 MT<br />
~ Rs. 160 crore<br />
Around 0.5<br />
59031090, 59032090 BANNER FLEX<br />
million sq m or ~ Rs. 1 crore<br />
125 MT<br />
Source: IBIS, IMaCS Analysis<br />
* In addition, flex is also imported in small amounts under the HS codes 39201019, 39219029,<br />
39209919, 39219010, 39269099, 39205112, 39219099, 39042110, 39232990, 39209939,<br />
39211900, 39211200 (included in the imports quantity and value above)<br />
Almost 80-90% <strong>of</strong> the flex is imported from China followed by around 10-15% from Korea. A small<br />
amount <strong>of</strong> flex is also imported from UAE and Taiwan.<br />
The exports <strong>of</strong> flex from India are negligible.<br />
Manufacturing process and type <strong>of</strong> raw material<br />
The process <strong>of</strong> manufacturing flex involves coating the base fabric with PVC emulsion by either dip<br />
or knife roll method followed by drying and curing. Drying and curing <strong>of</strong> the chemicals applied to the<br />
substrate is accomplished by means <strong>of</strong> heat wherein the fabric is passed through an oven with<br />
continuous circulation <strong>of</strong> hot air.
Key machinery suppliers in India<br />
The domestic manufacturers/suppliers <strong>of</strong> coating lines are:<br />
Quality standards<br />
Coating machines/coating lines<br />
Company City<br />
A.T.E. Pvt. Limited Mumbai<br />
Harish Enterprise Pvt. Limited Umbergaon<br />
Kusters Calico Machinery Limited Mumbai<br />
Shreeji Engineering & Marketing Services Ahmedabad<br />
Stovec Industries Limited Ahmedabad<br />
Source: Textile Machinery Manufacturers’ Association <strong>of</strong> India<br />
There are no quality standards available for this product.
Tarpaulins – HDPE, Cotton canvas and Jute Tarpaulins<br />
A tarpaulin or tarp is a large sheet <strong>of</strong> strong, flexible, water resistant or waterpro<strong>of</strong> material.<br />
Traditionally tarpaulins were made out <strong>of</strong> cotton however currently nylon and polyester fibre fabrics<br />
are being increasingly used in manufacturing tarpaulins.<br />
Tarpaulin is widely used for rain water protection in sheds, transportation - trucks & other<br />
automobiles, storage godowns, boats, snowmobiles, construction sites, lumber, grain storage,<br />
temporary storages, tents, ground-sheets, etc.<br />
Tarpaulins are categorized as given below:-<br />
1. Cotton canvas tarpaulins<br />
2. HDPE/PP/Nylon tarpaulins<br />
Tarpaulins are sheets made out <strong>of</strong> polyethylene, cotton canvas, jute, etc. Polyethylene tarpaulin is also<br />
known as HDPE Tarpaulin, Laminated Tarpaulin, Plastic Tarpaulin, etc. Traditionally, cotton canvas<br />
had been the more common form <strong>of</strong> tarpaulins, but, lately, HDPE woven and laminated fabric and<br />
polyethylene sheets have replaced canvas in many <strong>of</strong> the applications.
Canvas Tarpaulin<br />
A canvas tarpaulin or tarp is a large sheet <strong>of</strong> strong, flexible, water resistant or waterpro<strong>of</strong> material.<br />
Traditionally tarpaulins were made out <strong>of</strong> cotton however currently nylon and polyester fibre fabrics<br />
are being increasingly used in manufacturing tarpaulins.<br />
Canvas tarpaulins are largely used as truck covers. Trucks travel long distances and hence come<br />
across huge climatic variations. Given India’s rough environmental conditions, damage to goods is<br />
inevitable if the goods are not adequately shielded. A steel body truck not only increases the weight <strong>of</strong><br />
the truck but also reduces the fuel efficiency. Thus, truck tarpaulin covers are widely used as truck<br />
covers. As the logistics industry is getting more and more organised, the product liability clauses are<br />
being enforced on the logistics players leading to increase in usage <strong>of</strong> truck covers. Moreover, the<br />
advent <strong>of</strong> organised players in retail industry has also given boost to the use <strong>of</strong> well covered trucks.<br />
Product Characteristics<br />
Canvas Tarpaulin covers are made <strong>of</strong> cotton canvas or nylon or polyester fibre fabrics coated with<br />
PVC. The cotton fabric is available in GSM ranging from 380 to 500. Vinyl coated polyester fabrics<br />
are 610 GSM to 678 GSM with the base fabric <strong>of</strong> 102 GSM to 107 GSM. These fabrics being heavy<br />
have lower elongation, minimum shrinkage over wide range <strong>of</strong> temperature and humidity conditions<br />
and resistance to UV degradation.<br />
Market dynamics and key growth drivers<br />
The key application <strong>of</strong> canvas tarpaulins is as truck covers. In India, road is the dominant mode <strong>of</strong><br />
transportation carrying almost 65% <strong>of</strong> the country’s freight. Truck transport accounts for majority <strong>of</strong><br />
the goods transfer through road and thus, holds immense significance. Around 2.5 lakh new trucks are<br />
sold every year, increasing at 10% y-o-y.<br />
Production <strong>of</strong> Medium & Heavy Commercial Vehicles (Goods carriers) in India<br />
(Vehicles in '000 numbers) Production<br />
<strong>Segment</strong> 2002-03 2003-04 2004-05 2005-06 2006-07 2007-08<br />
Commercial Vehicles (CVs)<br />
M&HCVs Goods Carriers 95.7 136.8 172.9 179.3 246.9 232.3<br />
Source: SIAM<br />
India experiences extreme climatic conditions from heavy rains to extreme heat. Since trucks travel<br />
long distances, tarpaulin covers are a necessity to protect the goods. Thus, use <strong>of</strong> tarpaulin is expected<br />
to increase in line with increase in truck transport.<br />
The industry survey has revealed that HDPE tarpaulin is becoming more popular vis-a-vis its canvas<br />
counterpart because it is cheap and inherently waterpro<strong>of</strong>. The only advantage that canvas tarpaulin
enjoys over the HDPE tarpaulin is that the former has higher tear strength thus, does not easily tear<br />
while tying with ropes. Usually a combination <strong>of</strong> both type <strong>of</strong> tarpaulins in used in every truck.<br />
However, HDPE tarpaulins are increasingly replacing canvas tarpaulins. Hence the demand for<br />
canvas tarpaulin is expected to fall by around 6% y-o-y.<br />
Market size <strong>of</strong> tarpaulin fabric and future forecast<br />
In 2007-08, 2.3 lakh trucks were sold in India out <strong>of</strong> which 70% are expected to require tarpaulin. As<br />
per the industry survey, each truck requires three to four tarpaulins out <strong>of</strong> which one or two are canvas<br />
tarpaulins in sizes 36ft X 21ft or 40ft X 21 ft. The canvas tarpaulin is replaced every 15-18 months<br />
depending upon the wear and tear <strong>of</strong> the fabric.<br />
Usage <strong>of</strong> tarpaulin for Truck covers<br />
Particulars Assumption<br />
Average size <strong>of</strong> canvas tarpaulin 36ft X 21 ft<br />
Number <strong>of</strong> canvas tarpaulins used in a truck 1.5<br />
Average life <strong>of</strong> a truck 12 years<br />
% <strong>of</strong> trucks requiring tarpaulin every year 70%<br />
Replacement period <strong>of</strong> canvas tarpaulin (conservative) 2 years<br />
Average price <strong>of</strong> canvas tarpaulin Rs 75 per sq m<br />
In addition, tarpaulin is also used in other applications such as agriculture, construction and marine.<br />
The market size <strong>of</strong> canvas tarpaulins has been increased by 10% to account for the application <strong>of</strong><br />
canvas tarpaulins in these miscellaneous applications.<br />
Current and future forecast <strong>of</strong> Canvas Tarpaulin <strong>consumption</strong><br />
The market size <strong>of</strong> canvas tarpaulin is estimated to be 61 million square meters valued at Rs. 457<br />
crore. The demand for tarpaulin is expected to increase in line with increase in road freight transport.<br />
However, the demand for canvas tarpaulin is likely to be hit because <strong>of</strong> its increasing replacement by<br />
HDPE tarpaulins. Thus, the demand for canvas tarpaulin is estimated to decrease to 45 million square<br />
meters by 2012-13 (falling at the rate <strong>of</strong> 6% year on year). The market potential in 2012-13 is<br />
estimated at Rs. 336 crore. No inflationary increase in price has been considered.<br />
The current and future forecast <strong>of</strong> tarpaulin <strong>consumption</strong> is given below:-<br />
Market size for tarpaulin fabric 2007-08 2012-13<br />
Quantity 61 million sq m 45 million sq m
Value Rs 457 crore Rs 336 crore<br />
Key manufacturers <strong>of</strong> tarpaulin substrate<br />
Source: <strong>Industry</strong> survey, IMaCS Analysis<br />
Majority <strong>of</strong> the market for tarpaulin is being serviced by the unorganised sector with only few players<br />
in the organised sector. Gokak mills, Bharat Textiles, SRF Limited are few key manufacturers <strong>of</strong><br />
cotton canvas for tarpaulin in the organised sector. The substrates made by these players are<br />
fabricated into truck tarpaulins by converters.<br />
Manufacturer Year Quantity Value Unit Price Installed<br />
(lakh m) (Rs crore)<br />
capacity<br />
Gokak Mills* 2007-08 27.2 20.71 Rs 76.08/m NA<br />
Bharat Textiles 2002-03 8.11 5.15 Rs 63.46/m NA<br />
SRF Limited** 2007-08 4 million sq m 35 Rs 87.5/m NA<br />
*These are the figures for complete cotton canvas which includes tarpaulin<br />
** This is SRF’s total capacity for all coated fabrics including tarpaulin<br />
Source: Capitaline, Annual reports, <strong>Industry</strong> survey<br />
The other players are<br />
• Sri Arjun Tarpaulin Industries, Salem<br />
• Calcutta Canvas Co., Chennai<br />
• Delhi Tirpal House, New Delhi<br />
• Lamifab Industries, Mumbai<br />
• Guru Nanak Industries, New Delhi<br />
• Daisy Trading Corporation, Mumbai<br />
Imports & Exports <strong>of</strong> tarpaulin<br />
The estimated import figures for Tarpaulin are as given below:-<br />
HS Code** Description<br />
59031010,<br />
59031090,<br />
59032090,<br />
59039090,<br />
59070099<br />
Imports<br />
Quantity<br />
Imports<br />
(in Rs crore)<br />
2007-08(E) 2007-08(E)<br />
PVC coated fabric,<br />
PVC coated<br />
Polyester fabric, 40 million meters Rs 66 crore<br />
PVC coated Nylon<br />
fabric *<br />
Source: IBIS, DGCIS, IMaCS Analysis<br />
* It includes fabric used for tarpaulin, tents, awning etc.<br />
** The above codes constitute over 99% <strong>of</strong> imports<br />
HS codes 59031010 and 59039090 constitute over 97% <strong>of</strong> the total imports. Around 87% <strong>of</strong> the<br />
imports are from China while the next highest contributor is Taiwan with over 7% share. Other<br />
countries include Korea, France, Germany, Hongkong etc.<br />
The estimated export figures for tarpaulins are as given below:-
HS Code Description<br />
63061990<br />
63061990, 63061100,<br />
63061910, 63062990<br />
NYLON<br />
TARPAULIN*<br />
COTTON CANVAS<br />
TARPAULIN<br />
Exports<br />
Quantity<br />
Exports<br />
(in Rs crore)<br />
2007-08(E) 2007-08(E)<br />
Approx. 2,000 sq.<br />
m.<br />
Approx. 7,100 sq.<br />
m.<br />
Rs 0.5 crore<br />
Rs 4.6 crore<br />
Source: IBIS, DGCIS, IMaCS Analysis<br />
Over 99% <strong>of</strong> the exports <strong>of</strong> cotton canvas tarpaulin take place under the HS codes 63061990,<br />
63061100, 63061910. USA has over 50% <strong>of</strong> the share in exports, while countries like Canada, UK<br />
and Germany have around 15% share each. These exports will increase marginally by 2012-13 and<br />
reach a size <strong>of</strong> Rs 5.5 crore.<br />
Key machinery suppliers for manufacturing tarpaulin in India<br />
The domestic manufacturers/suppliers <strong>of</strong> coating lines are:<br />
HDPE Tarpaulins<br />
Coating Machines/coating lines<br />
Company City<br />
A.T.E. Private. Limited Mumbai<br />
Harish Enterprise Pvt. Limited Umbergaon<br />
Kusters Calico Machinery Limited Mumbai<br />
Shreeji Engineering & Marketing Services Ahmedabad<br />
Stovec Industries Limited Ahmedabad<br />
Source: Textile Machinery Manufacturers’ Association <strong>of</strong> India<br />
Polyethylene tarpaulin is also known as HDPE Tarpaulin, Laminated Tarpaulin, Plastic Tarpaulin, etc.<br />
Polythene Tarpaulins are made <strong>of</strong> High Density Polythene woven fabric laminated on both sides with<br />
low density polythene. The advantages <strong>of</strong> PE tarpaulins are that they are very economic compared to<br />
cotton canvas tarpaulins. PE tarpaulins with HDPE woven fabric and LDPE lamination on both the<br />
sides are 100% waterpro<strong>of</strong>. PE tarpaulins have the capability to adopt wide range <strong>of</strong> colours unlike the<br />
canvas tarpaulin which makes it more usable and a preferred product all over the world.<br />
Product characteristics
The polyethylene tarpaulin usually ranges from 70-500 gsm. The most popular characteristics in<br />
tarpaulins are listed below:<br />
GSM : From 100 to 350 gsm.<br />
Mesh : From 8 X 8 to 14 X 14<br />
Denier : From 700 upto 1200<br />
Width : 6ft and above<br />
Length : 6 ft and above<br />
Lamination : LDPE Lamination on both sides<br />
Color : Blue, Yellow, Black, Silver/Blue, Silver/White, Silver/Black<br />
3 layers tarpaulin goes from 72 GSM upto 200 GSM and in 5 layers it can go up to 300 GSM, giving<br />
it higher strength and durability. It is generally available in standard sizes 15ft X 12ft, 18ft X 12ft,<br />
18ft X 15ft, 24ft X 18ft, 24ft X 16ft and 30ft x 30ft. UV stabilization can also be done and is<br />
opted by many users.<br />
Market dynamics and key growth drivers <strong>of</strong> tarpaulin market in India<br />
The tarpaulin is used for the following applications in India:<br />
• Floor lining for storage or stacking railway wagon covers<br />
• Ground work sheet, transportation<br />
• Water pro<strong>of</strong> liner for trucks, tempos, warehouses, sheds, etc.<br />
• Storage Tarpaulin, fumigation covers, poultry shading<br />
• Construction sites - covering for cement bags, equipment, metal rods<br />
• Curtains for unfinished buildings<br />
• In various packaging industries<br />
• Recreational uses at picnics and camps<br />
Of the above applications, the growth in the usage <strong>of</strong> tarpaulin has been driven by the usage in trucks,<br />
tempos, warehouse, sheds, storage covers, construction sites and the packaging industries.<br />
<strong>Industry</strong> size - HDPE tarpaulins industry<br />
The Indian Raffia industry is estimated as 1.07 million MT in size in 2007-08. HDPE/PP tarpaulins<br />
account for 6.5% <strong>of</strong> the Indian Raffia industry, thus, amounting to around 70,000 MT.
The average domestic market price <strong>of</strong> these tarpaulins in 2007-08 was around Rs 90-95 per kg. The<br />
prices <strong>of</strong> HDPE tarpaulins are strongly linked with the crude oil prices and hence, the prices have<br />
increased drastically in the last one year. The average export price increased to around Rs 150 per kg<br />
from Rs 116 per year last year. However, with the downward trend in the crude oil prices, they are<br />
expected to go down and stabilize. At present, the domestic market price is around Rs 110 per kg.<br />
Assuming the average price for 2007-08 as Rs 92.5 per kg, the HDPE tarpaulins market size is<br />
estimated as Rs 650 crore approx.<br />
The HDPE tarpaulins industry in India is expected to grow at around 10% per annum as cotton canvas<br />
tarpaulins will be replaced by HDPE tarpaulins. Hence, the industry size <strong>of</strong> the HDPE tarpaulins is<br />
expected to increase from 70,000 MT in 2007-08 to around 113,000 MT by 2012-13. An inflationary<br />
increase <strong>of</strong> 5% y-o-y has been assumed for the price <strong>of</strong> these tarpaulins due to their linkage with crude<br />
oil prices. Hence, in value terms, the market size <strong>of</strong> the HDPE tarpaulins industry in India is expected<br />
to increase from Rs 650 crore in 2007-08 to around 1,330 crore by 2012-13.<br />
The current and future forecast <strong>of</strong> HDPE Tarpaulin industry size is given below:-<br />
HDPE Tarpaulins industry 2007-08 2012-13<br />
HDPE Tarpaulins Quantity 70,000 MT 113,000 MT<br />
Rs 1,330<br />
HDPE Tarpaulins Value Rs 650 crore<br />
crore<br />
Source: <strong>Industry</strong> survey, IMaCS Analysis<br />
Key players – HDPE Tarpaulins<br />
Manufacturer Year Quantity (MT) Value Unit Price Installed<br />
(Rs crore)<br />
capacity<br />
Gujarat Raffia 2006-07 1,750 MT 16 Rs 92.6/kg 4440* MT<br />
Gujarat Craft 2006-07 73 MT 0.63 Rs 86.3/kg 1800* MT<br />
SRMTL 2007-08 0.14 85 million sq.<br />
ft. per month<br />
Binny 2006-07 0.09<br />
* It includes capacities for PE fabrics, sacks, tarpaulins etc.<br />
Source: Capitaline, Company Annual Reports<br />
Other players in the HDPE tarpaulin industry are Commercial SynBags Ltd., Tarpaulins India Tarp<br />
(P) Ltd., S K Enterprise, Texel Industries Ltd., Shreeji Plastic, Ranka International Limited, Gujarat<br />
Bulk Packs Limted etc. There are many other small players present who make tarpaulin in the<br />
unorganised sector.
Imports <strong>of</strong> HDPE/PP Tarpaulin<br />
The estimated import figures for tarpaulins are as given below:-<br />
HS Code Description<br />
Imports<br />
Quantity<br />
Imports<br />
(in Rs crore)<br />
2007-08(E) 2007-08(E)<br />
63062900,<br />
63069990<br />
PP TARPAULIN*<br />
Approx. 500 –<br />
600 MT<br />
~ 1.5 - 2<br />
Source: IBIS, DGCIS, IMaCS Analysis<br />
* PVC coated tarpaulins are also imported under the HS code 63061990,<br />
though rarely<br />
The contribution <strong>of</strong> imports in the overall HDPE/PP tarpaulins <strong>consumption</strong> in India is very low.<br />
Almost 100% <strong>of</strong> the Indian imports <strong>of</strong> PP Tarpaulin are from China.<br />
Exports <strong>of</strong> HDPE/PP Tarpaulin<br />
The estimated export figures for tarpaulins are as given below:-<br />
HS Code Description<br />
Exports<br />
Quantity<br />
Exports<br />
(in Rs crore)<br />
2007-08(E) 2007-08(E)<br />
63061990<br />
HDPE<br />
TARPAULIN*<br />
Approx. 15,000<br />
sq.m.<br />
~ 1 – 1.5<br />
Source: IBIS, DGCIS, IMaCS Analysis<br />
* Tarpaulins worth Rs 5 crore <strong>of</strong> cotton canvas and jute are also exported from<br />
India to Germany, UK, USA, Canada, Australia and Sri Lanka<br />
The share <strong>of</strong> exports in the overall HDPE/PP tarpaulins production in India is very low. Almost 80%<br />
<strong>of</strong> the Indian exports <strong>of</strong> HDPE Tarpaulin are to USA. Exports to Germany and African countries like<br />
Kenya account for the remaining 20% exports. There will only be a minor or negligible growth in<br />
exports by 2012-13.<br />
Key importers & exporters<br />
The key exporters <strong>of</strong> tarpaulin from India are Gujarat Raffia Industries Ltd., Shree Rama Multi Tech<br />
Ltd., Commercial SynBags Ltd., Tarpaulins India Tarp (P) Ltd., S K Enterprise, Texel Industries Ltd.,<br />
Ranka International Limited, etc<br />
Key machinery manufacturers/suppliers in India<br />
The main machine required for tarpaulin manufacturing is the 8-10 Wide width Shuttle Loom. The<br />
main suppliers <strong>of</strong> these looms in India are:<br />
• Lohia Starlinger Limited<br />
• J. P. Industries
• Kabra Extrusiontechnik Ltd. (KET) – Kolsite<br />
• Windsor Machines Limited<br />
Quality Control and Standards<br />
IS 7903:2005 is the standard applicable to HDPE tarpaulins, besides this a draft standard has also<br />
been finalised under DOC.TXD 23(907) but has not yet been sent for print.
Awnings and Canopies<br />
An awning is a secondary covering attached to the exterior wall <strong>of</strong> a building. With the addition <strong>of</strong><br />
columns an awning becomes a canopy, which is able to extend further from a building, as in the case<br />
<strong>of</strong> an entrance to a hotel.<br />
The location <strong>of</strong> an awning on a building may be above a window, a door, or above the area along a<br />
sidewalk. Restaurants <strong>of</strong>ten use awnings broad enough to cover substantial outdoor area for outdoor<br />
dining, parties or reception. In commercial buildings, an awning is <strong>of</strong>ten painted with information<br />
such as the name, business, and address, thus acting as a sign or billboard in addition to providing<br />
shade from the sun, break from steep winds and protection from rain or snow. The key benefits <strong>of</strong> an<br />
awning or a canopy are weather protection, decoration and identification.<br />
An awning fabric gives an extremely high level <strong>of</strong> protection from UV radiation. This degree <strong>of</strong><br />
protection depends on the color <strong>of</strong> the fabric. Lighter colors let more UV light through than the dark<br />
colors, but they remain as effective as a factor 50 sunscreen (filtering out more than 90% <strong>of</strong> UV<br />
radiation).<br />
Advantages:<br />
• Weather protection<br />
• High tear strength<br />
• Long lasting<br />
• Good breaking strength<br />
• Does not get warped<br />
• Weldable<br />
• Good drape<br />
• Aesthetic appeal combined with strength<br />
Product characteristics<br />
The fabric for awnings & canopies usually varies from 400-700 gsm, though it can also be higher<br />
depending upon the fabric used.<br />
Key growth drivers, <strong>consumption</strong> norms and the market size<br />
Growth in the real-estate segment especially hotels, fast food places, sale counters, etc is driving the<br />
usage <strong>of</strong> awnings and canopies in India. Usage <strong>of</strong> awnings / canopies as truck covers has been<br />
included under tarpaulins and has been excluded from awnings & canopies market size. The market
size <strong>of</strong> awnings & canopies has been estimated based on discussions with industry players. Some <strong>of</strong><br />
the key assumptions based on the industry survey are:-<br />
Particulars Assumption<br />
Requirement <strong>of</strong> a small shop 100-150 sq ft<br />
% <strong>of</strong> PVC coating done in India for awning 25%<br />
Average % <strong>of</strong> the fabric cost in the total awning cost 15%<br />
Average price <strong>of</strong> 1 sq m <strong>of</strong> Acrylic coated fabric Rs 250-350<br />
Average price <strong>of</strong> 1 sq m <strong>of</strong> PVC coated fabric Rs 100-150<br />
Acrylic coated fabric import percentage 100%<br />
The current and future forecast <strong>of</strong> awnings & canopies industry size is given below:-<br />
Awning industry 2007-08 2012-13<br />
Awning Quantity 1.5 lakh sq m 3.0 lakh sq m<br />
Awning Value Rs 2.25 crore Rs 4.5 crore<br />
Source: <strong>Industry</strong> survey, IMaCS Analysis<br />
The domestic usage <strong>of</strong> awnings & canopies is expected to increase from 1.5 lakh sq m in 2007-08 to<br />
around 3 lakh sq m by 2012-13. No inflationary increase has been assumed for the price <strong>of</strong> these<br />
products. In value terms, the market size <strong>of</strong> the awnings & canopies in India is expected to increase<br />
from Rs 2.25 crore in 2007-08 to around 4.5 crore by 2012-13.<br />
Key manufacturers<br />
SRF and Entremonde Polycoaters are the key players in the awning fabric market in India. There are<br />
also few other players like Coated Sales Corporation. Rest <strong>of</strong> the players in India are importers,<br />
fabricators or distributors <strong>of</strong> awnings.<br />
Manufacturer Year Production Production Installed<br />
Quantity Value capacity<br />
SRF Limited* 2007-08 4 million sq m Rs 35 crore NA<br />
*This is the production <strong>of</strong> the entire coated fabrics division<br />
Source: Capitaline, Annual reports, <strong>Industry</strong> survey<br />
The key importers <strong>of</strong> awning fabric are:<br />
• Alps Industries Ltd. (Vista)<br />
• Systems India Pvt. Ltd – Authorised for Dickson & KITEX (Korea PVC awning)
• Mac Décor Ltd.<br />
• Sujan Impex, Mumbai – Authorised for Ferrari (Italy)<br />
The major distributors <strong>of</strong> awning fabric who do not import directly are:<br />
• Unitech Awning<br />
• Ideal Shades<br />
• Décor World<br />
Imports & Exports <strong>of</strong> Awning Fabric<br />
The estimated import figures for Awning are as given below:-<br />
HS Code Description<br />
55122990,<br />
59069190,<br />
39269099,<br />
59112000,<br />
54072090<br />
Awning*<br />
Imports<br />
Quantity<br />
Imports<br />
(in Rs crore)<br />
2007-08(E) 2007-08(E)<br />
Around 16,000<br />
sq. m.<br />
Rs 0.5 crore<br />
Source: IBIS, DGCIS, IMaCS Analysis<br />
* Imports above include only the fabric imported under the name <strong>of</strong> awning and not the<br />
seperate PVC/Acrlyic coated fabrics used for awnings<br />
Most <strong>of</strong> the imports take place from European countries including Spain (which contributes around<br />
80% share), UK (which has a share <strong>of</strong> around 10-15%) and France and Italy. China accounts for less<br />
than 5% <strong>of</strong> the imports.<br />
There are no exports under the head <strong>of</strong> awnings but some exports take place under the category <strong>of</strong><br />
coated fabrics.<br />
Raw material<br />
Awnings & canopies are typically composed <strong>of</strong> canvas woven <strong>of</strong> acrylic, cotton or polyester yarn, or<br />
vinyl laminated to polyester fabric that is stretched tightly over a light structure <strong>of</strong> aluminum, iron or<br />
steel and sometimes even wood. The key raw materials are:
• Woven or Warp knitted fabrics – 50-150gsm made <strong>of</strong> polyester filament yarn<br />
• PVC emulsion grade<br />
• Water based PU emulsion<br />
• Fillers like CaCO3, China clay etc.<br />
• Plasticizer<br />
• Additives:<br />
o Different colour pigments<br />
o Stabilizers<br />
Key Raw material Suppliers<br />
Key suppliers for PVC are:<br />
• Chemplast – Chennai<br />
• Finolex – Pune<br />
• Solvay – Belgium<br />
Key PU suppliers are:<br />
• Stahl chemicals – UK<br />
• Schill and Silacher – Germany<br />
Key Stabilizers’ suppliers are:<br />
• JV Organics<br />
• CIBA<br />
Key Pigments’ suppliers are:<br />
• Meghmani – Ahmedabad<br />
• Clariant - Mumbai<br />
Key machinery suppliers<br />
• Yamuna Industries, Umbergaon<br />
• Swatik Industries, AHmedabad<br />
• Shakti Industries, Mumbai<br />
• Web Processing, UK<br />
• Coatema, Germany
• Zimmer, Germany
Floor and wall coverings<br />
Floor & Wall covering items can be classified as following:-<br />
• PVC flooring & Printed PVC flooring<br />
• Non-woven carpets<br />
• Woollen carpets<br />
• Carpets / floor coverings <strong>of</strong> polypropylene, polyester, etc<br />
Floor coverings have been mostly dominated by wool, polypropylene and acrylic carpets. But, as<br />
consumers began to look for affordable carpets that were easy to care and maintain at home, the<br />
trends started shifting towards polyester. Distinct advantages such as higher bulk, strength, resilience,<br />
colour, clarity, fastness, easy care, affordability and longevity have fuelled the demand for polyester<br />
carpets. Nowadays, non-woven needle punched wall-to-wall carpets are also being used widely. Wall<br />
to wall carpets provide a dust free environment and serve as good insulators against noise. With the<br />
boom in IT industry and commercial establishments, wall to wall carpets are in demand in India too.<br />
Product characteristics and applications<br />
Floor and wall coverings applications are:-<br />
• 1 mm thickness: Can be used in Residential Areas & Study Centres.<br />
• 1.5 mm thickness: Computer Rooms, Departmental Stores,<br />
• 2 mm thickness: Industrial Areas & Electronics Rooms<br />
Vinyl flooring is produced in a variety <strong>of</strong> designs i.e. mosaic, ceramic, wood, marble, floral, granite,<br />
geometric pattern etc. to suit different applications in Home, Hotels, Hospitals, Offices, Nursing<br />
Homes, Airport, Bank, Computer Rooms, Railways, Restaurants, Shopping Complexes, etc.<br />
Commercial flooring in 2mm thickness is designed to suit medium and heavy traffic areas like<br />
Hospitals, Offices, Airports, Shopping Complexes, Railways, Libraries, etc.<br />
The non-woven wall-to-wall carpets and floor coverings are also increasingly being used in India.<br />
These carpets are made <strong>of</strong> PP and are tufted.<br />
Key manufacturers<br />
The key manufacturers <strong>of</strong> floor and wall coverings are:-
Manufacturer Year Sales Quantity Sales Value Installed capacity<br />
Uniproducts 2007-08 3,833 MT Rs 79.77 crore 4,000 MT<br />
Birla Corporation 2007-08 0.461 million sq m Rs 6.8 crore 4.86 million sq m<br />
Royal Cushion Vinyl Products<br />
Ltd.<br />
2007-08 10.991 million sq m<br />
Rs 75.78 crore<br />
NA<br />
Premier Polyfilm Ltd. 2007-08 14.34 million sq m Rs 65.26 crore 16,200 MT<br />
Supreme Non-woven* 2005-06<br />
2.45 million<br />
meters**<br />
15,000 MT<br />
2007-08 15,000 MT** 25,000 MT<br />
Source: Capitaline, <strong>Industry</strong> survey<br />
* Includes other non-woven products as well<br />
** Production figures<br />
Automobile products account for around 50% <strong>of</strong> Supreme Non-woven production. The estimated<br />
capacity utilisation <strong>of</strong> Supreme Non-woven is around 60%. Supreme non-woven has increased its<br />
capacity from 15,000 MT in 2005-06 to 25,000 MT in 2007-08 and is expected to increase to 40,000<br />
MT by the end <strong>of</strong> 2008-09.<br />
Market size and key growth drivers<br />
The Indian carpets, floor coverings and wall coverings industry is mainly export oriented. With the<br />
boom in IT industry and commercial establishments (like hotels, restaurants, airports, <strong>of</strong>fices, etc),<br />
wall to wall carpets and non-woven carpets are gaining demand in India too. The industry is expected<br />
to grow in line with the building and construction industry at around 10-12% year on year.<br />
The domestic usage <strong>of</strong> the floor and wall coverings has been estimated based on discussion with the<br />
industry players and published information about the production and sales <strong>of</strong> the key players in India<br />
as well as the imports and exports statistics.<br />
The current and future forecast <strong>of</strong> floor & wall coverings industry size is given below:-<br />
Floor & wall coverings<br />
<strong>Domestic</strong> usage<br />
Floor & wall coverings Quantity<br />
2007-08 2012-13<br />
67 million sq<br />
m<br />
108 million sq<br />
m<br />
Floor & wall coverings Value Rs 425 crore Rs 685 crore<br />
Source: <strong>Industry</strong> survey, IMaCS Analysis<br />
The domestic usage <strong>of</strong> floor & wall coverings is expected to increase from 67 million sq m in 2007-08<br />
to around 108 million sq m by 2012-13. No inflationary increase has been assumed for the price <strong>of</strong><br />
these products. In value terms, the market size <strong>of</strong> the floor & wall coverings in India is expected to<br />
increase from Rs 425 crore in 2007-08 to around 685 crore by 2012-13.<br />
Imports & Exports <strong>of</strong> Floor & wall coverings
The estimated import figures for Floor & wall coverings are as given below:-<br />
HS Code Description<br />
57031010, 57033010,<br />
57033090, 57033020<br />
57050090<br />
57033090, 57033010,<br />
57032090, 57032020,<br />
57033020<br />
39181090, 39189090,<br />
39189010, 39181010<br />
39181090, 39181010,<br />
39269099, 39189090<br />
39259010, 39259090,<br />
39269099<br />
NON-WOVEN FLOOR<br />
COVERINGS / CARPETS<br />
NON-WOVEN FABRIC<br />
(FOR FLOOR COVERINGS)<br />
PP CARPETS / SYNTHETIC<br />
MACHINE TUFTED<br />
CARPETS / FLOOR<br />
COVERINGS<br />
Imports Quantity Imports<br />
(Value)<br />
2007-08(E) 2007-08(E)<br />
1.2 million sq m Rs 10 - 12 crore<br />
2.25 million sq m Rs 8 crore<br />
1.65 million sq m Rs 25 - 30 crore<br />
PVC FLOOR COVERINGS 1 million sq m Rs 35 crore<br />
PVC WALL COVERINGS 0.15 million sq m Rs 10 crore<br />
PVC PROFILES (WALL &<br />
CELING ACCESSORIES)<br />
0.75 million sq m Rs 7 crore<br />
Source: IBIS, IMaCS Analysis<br />
Non-woven carpets for floor coverings are imported from UAE & USA with share <strong>of</strong> around 40%<br />
each followed by UK, Netherlands & Egypt. Non-Woven fabric used for floor coverings is imported<br />
from China, Iran & Belgium.<br />
PP carpets and carpets <strong>of</strong> synthetic material / machine tufted carpets are imported primarily from<br />
UAE with around 40% share followed by China, Pakistan & Netherlands with around 10-20% share.<br />
The remaining imports are from Indonesia, Saudi, USA, Singapore and Malaysia.<br />
Korea & France account for 30-40% <strong>of</strong> the imports (each) <strong>of</strong> floor coverings followed by China &<br />
Thailand with around 10% share each. Taiwan, Pakistan, Singapore, Germany, UK, Hungary, Sweden<br />
and Australia account for the remaining imports <strong>of</strong> PVC floor coverings.<br />
USA accounts for around 50% share in the Indian imports <strong>of</strong> the PVC wall coverings followed by UK<br />
with around 25-30% share. Korea, Thailand, Netherlands and China account for the remaining<br />
imports <strong>of</strong> PVC wall coverings.<br />
PVC pr<strong>of</strong>iles for wall and ceiling accessories are primarily imported from China with around 50%<br />
share followed by Malaysia with around 20-25% share and Korea & Vietnam accounting for the<br />
remaining imports.<br />
The estimated export figures for Floor & wall coverings are as given below:-
HS Code Description<br />
39181090, 39189090,<br />
39219029, 39189010,<br />
39181010, 39209919,<br />
39264059<br />
PVC VINYL FLOOR<br />
COVERINGS / WALL<br />
COVERINGS<br />
Exports<br />
Quantity<br />
Exports<br />
(Value)<br />
2007-08(E) 2007-08(E)<br />
15 million sq m Rs 425 crore<br />
Source: IBIS, IMaCS Analysis<br />
The key export destinations <strong>of</strong> PVC vinyl floor and wall coverings from India are UAE, Saudi Arabia,<br />
S Africa and China with a share <strong>of</strong> around 60%. Israel, Slovenia, Greece, Germany, Australia, USA,<br />
Kenya, Sudan, Oman, Tanzania, Qatar, Ghana, Vietnam etc account for the remaining exports. Their<br />
exports in the year 2012-13 are expected to be Rs 569 crore.<br />
Raw-materials<br />
Typically the non-woven floor and wall coverings are made <strong>of</strong> polypropylene. In addition, to meet the<br />
industry demand for a suitable fibre, Reliance has launched its unique Recron Carpet Fibre in trilobal<br />
cross section. The PVC Vinyl flooring is also extensively used in India.<br />
For the non-woven floor and wall coverings, needle-punching process is used. Needle loom is the key<br />
machinery for manufacturing these non-wovens. The needle looms are generally imported. One <strong>of</strong> the<br />
most famous needle punch machine manufacturers in the world is Dilo (Germany).
Scaffolding Nets<br />
Scaffolding netting is a lightweight fabric used to cover a building under construction in order to<br />
improve the safety <strong>of</strong> construction site. It acts as a bi-fold barrier on a building under construction.<br />
The net prevents debris from falling out <strong>of</strong> building and also hides away unsightly work areas giving a<br />
tidier look.<br />
Product characteristics<br />
Scaffolding nets are knitted from High Density Polyethylene (HDPE) UV stabilized mon<strong>of</strong>ilament<br />
yarn. The UV stabilizers added to HDPE develop resistance to UV rays thus, increasing the product<br />
life. Scaffolding nets are available in different weights and shading factors ranging from 50% to 90%.<br />
The ex-factory selling price <strong>of</strong> these nets ranges from Rs. 13 to 16 per square meter depending on the<br />
quality.<br />
Market dynamics and key growth drivers<br />
The demand for scaffolding nets is driven by construction activity in the country. Indian Building<br />
Laws do not stipulate the use <strong>of</strong> scaffolding nets near the construction site. As a result hessian cloth or<br />
tarpaulin is widely used in place <strong>of</strong> these nets. However, industry survey reveals that because <strong>of</strong><br />
awareness about the benefits <strong>of</strong> this product as well as increase in price <strong>of</strong> hessian cloth, the use <strong>of</strong><br />
scaffolding nets has grown at a rate <strong>of</strong> 15-20% over the last two years.<br />
Market size <strong>of</strong> scaffolding nets and future forecast<br />
Based on discussions with the industry experts the market size <strong>of</strong> scaffolding nets is estimated at 4<br />
lakh square meters valued at Rs. 0.6 crore. The demand for scaffolding nets is expected to grow on<br />
account <strong>of</strong> increase in construction activity as well as better market penetration <strong>of</strong> the product. Hence,<br />
the market size <strong>of</strong> scaffolding nets is expected to increase to 8 lakh square meters by 2012-13<br />
(growing at a CAGR <strong>of</strong> around 15% over the next five years). The market potential in 2012-13 is<br />
estimated at Rs. 1.2 crore. No inflationary increase has been assumed for the price <strong>of</strong> the product.<br />
The current and future forecast <strong>of</strong> <strong>consumption</strong> <strong>of</strong> scaffolding nets is given below:-<br />
Market size <strong>of</strong> scaffolding nets 2007-08 2012-13<br />
Quantity 4 lakh sq m 8 lakh sq m<br />
Value Rs. 0.6 crore Rs. 1.2 crore<br />
Source: <strong>Industry</strong> survey, IMaCS Analysis
Key manufacturers <strong>of</strong> scaffolding nets<br />
In India, the production capacity <strong>of</strong> scaffolding nets is included in the Shade nets’ manufacturing<br />
facilities. The key manufacturers <strong>of</strong> scaffolding nets are Rishi Packers Ltd and Kwality Nets.<br />
Rishi Packers Limited is a multiproduct company. It is one <strong>of</strong> the leading manufacturers <strong>of</strong><br />
scaffolding nets with an installed capacity <strong>of</strong> 12 million square meters/annum (2007-08) for a variety<br />
<strong>of</strong> nets including shade nets, wind breaker nets, bird nets, hail nets, scaffolding nets and crop<br />
protection nets. In 2007-08, the company produced 9 million square meters <strong>of</strong> nets.<br />
Kwality Nets Manufacturing Co. is one <strong>of</strong> the major producers <strong>of</strong> scaffolding nets with an installed<br />
capacity <strong>of</strong> 0.72 million square meters/annum (2007-08) for all types <strong>of</strong> nets including safety nets,<br />
bird protection nets, fishing nets, mosquito nets, agro shade nets, sports nets, packaging nets and other<br />
nets. In 2007-08, the company manufactured 80,000 square meters <strong>of</strong> scaffolding nets.<br />
Imports and Exports <strong>of</strong> scaffolding nets<br />
In the absence <strong>of</strong> significant market, there are negligible imports <strong>of</strong> scaffolding nets. The exports <strong>of</strong><br />
scaffolding nets are also negligible. Net manufacturers export shading nets to countries in Middle<br />
East, however, the end applications <strong>of</strong> these nets are diverse.<br />
Raw materials<br />
Scaffolding nets are knitted from High Density Polyethylene (HDPE) UV stabilized mon<strong>of</strong>ilament<br />
yarn. The UV stabilizers added to HDPE develop resistance to UV rays thus, increasing the product<br />
life.<br />
Key machinery suppliers in India<br />
The raschel knitting machines used for manufacturing nets are mostly imported. GCL India Pvt Ltd<br />
(Bangalore) is one <strong>of</strong> the local manufacturers <strong>of</strong> raschel knitting machines. The key raschel knitting<br />
machinery manufacturers in the world are Karl Mayer (Germany), LIBA Maschinenfabrik GmbH<br />
(Germany) and Brückner Technology Holding GmbH (Germany).<br />
The Indian associates/suppliers <strong>of</strong> these machinery are:<br />
• ATE engineering (Mumbai) for Karl mayer<br />
• Brückner Machinery and Service India Pvt Ltd (Pune) for Bruckner.<br />
Quality standards<br />
There are no quality standards available for this product.
CLOTHTECH<br />
The Clothtech segment <strong>of</strong> <strong>technical</strong> <strong>textiles</strong> comprises <strong>of</strong> all textile components used primarily in<br />
garment applications, which have some specific functional applications. These components are largely<br />
hidden, e.g. interlinings in shirts, sewing threads, shoe laces, labels, hook and loop fasteners (Velcro),<br />
etc. Various fabrics like umbrella cloth are also classified under the Clothtech segment.<br />
The <strong>technical</strong> textile products covered under Clothtech are as give below:-<br />
• Shoe laces<br />
• Interlinings<br />
• Zip Fasteners<br />
• Elastic Narrow Fabrics (Tapes)<br />
• Velcro<br />
• Labels<br />
• Umbrella Cloth<br />
• Sewing Threads<br />
Technical <strong>textiles</strong> <strong>consumption</strong> under Clothtech is estimated at around Rs 6,570 crore. Sewing threads<br />
alone account for around 60% <strong>of</strong> the <strong>technical</strong> <strong>textiles</strong> <strong>consumption</strong> under Clothtech followed by<br />
labels with around 19% share. Interlinings accounts for around 8% share, whereas elastic narrow<br />
fabric tapes have a share <strong>of</strong> almost 6%. Usage <strong>of</strong> <strong>technical</strong> <strong>textiles</strong> in shoe laces and zip fasteners is<br />
<strong>of</strong> total 5%. Velcro and umbrella cloth account for the remaining around 2% <strong>of</strong> the total usage in<br />
Clothtech.<br />
The domestic <strong>consumption</strong> <strong>of</strong> <strong>technical</strong> <strong>textiles</strong> under Clothtech is expected to increase from around<br />
Rs 6,570 crore in 2007-08 to around Rs 9,665 crore by 2012-13.The demand for the clothtech<br />
products is dependent on the growth <strong>of</strong> the garment industry. In the medium term (next 5 years), the<br />
clothtech segment is expected to achieve growth at the rate <strong>of</strong> almost 8% year on year. Exports <strong>of</strong><br />
Clothtech products (<strong>technical</strong> <strong>textiles</strong> component) from India are estimated as Rs 338 crore.<br />
The maximum growth is expected in the Hook and loop fastener (Velcro) market. The share <strong>of</strong> Velcro<br />
in the total Clothtech market is expected to double over the next 5 years. With the high growth in the<br />
s<strong>of</strong>t luggage industry, the <strong>consumption</strong> <strong>of</strong> zip fasteners is also expected to increase 12% year-on-year<br />
for the next five years. Elastic narrow tapes are also expected to have a healthy growth rate <strong>of</strong> over<br />
11% year on year.
With the growth in the footwear industry, the growth in the <strong>consumption</strong> <strong>of</strong> shoe laces is also<br />
expected to be higher than the overall growth <strong>of</strong> Clothtech category. Demand for sewing threads is<br />
expected to be stable growing in line with the clothtech segment.<br />
Moreover due to a slowdown in the garment exports from India, the growth in interlinings and labels<br />
is expected to be lower than other products <strong>of</strong> the clothtech category.<br />
Most <strong>of</strong> the demand for these products is satisfied by domestic production with imports <strong>of</strong> only<br />
around Rs 400 crore. The umbrella cloth (taffeta) is 100% imported and not manufactured in India at<br />
all. Interlinings and narrow fabrics like elastics and Velcro also have imports over 15% <strong>of</strong> their<br />
domestic <strong>consumption</strong>.<br />
Summary <strong>of</strong> the market-sizing for Clothtech<br />
Shoe laces<br />
Interlinings<br />
Zip<br />
Fasteners<br />
(TT<br />
component)<br />
Elastic<br />
Narrow<br />
Fabrics<br />
(Tapes)<br />
Velcro<br />
Labels<br />
Quantity<br />
Value<br />
Quantity<br />
Value<br />
Quantity<br />
Value<br />
Production Imports Exports<br />
Rs 195<br />
crore<br />
98 million<br />
meters<br />
Rs 440<br />
crore<br />
614 million<br />
meters<br />
Rs 144.5<br />
crore<br />
Quantity 830 million<br />
meters<br />
Value<br />
Quantity<br />
Value<br />
Quantity<br />
Rs 455<br />
crore<br />
155 million<br />
meters<br />
2007-08 2012-13<br />
<strong>Domestic</strong><br />
Consumption<br />
<strong>Domestic</strong><br />
Consumption<br />
- 2540 MT 3400 MT<br />
Rs 20 crore - Rs 215 crore Rs 365 crore<br />
125<br />
million<br />
meters<br />
8 million<br />
meters<br />
215 million<br />
meters<br />
290 million<br />
meters<br />
Rs 85 crore Rs 8.5 crore Rs 515 crore Rs 700 crore<br />
6 million<br />
meters<br />
20 million<br />
meters<br />
600 million<br />
meters<br />
1050 million<br />
meters<br />
Rs 7 crore Rs 1.5 crore Rs 150 crore Rs 265 crore<br />
111<br />
million<br />
meters<br />
Rs 65 crore<br />
20 million<br />
meters<br />
110 million<br />
meters<br />
Rs 155<br />
crore<br />
8 million<br />
meters<br />
830 million<br />
meters<br />
1110 million<br />
meters<br />
Rs 365 crore Rs 625 crore<br />
165 million<br />
meters<br />
300 million<br />
meters<br />
Rs 62 crore Rs 9 crore Rs 5.5 crore Rs 65 crore Rs 150 crore<br />
17545<br />
million<br />
pieces<br />
1190<br />
million<br />
pieces<br />
175 million<br />
pieces<br />
18560<br />
million<br />
pieces<br />
24840<br />
million<br />
pieces<br />
Export<br />
Potential<br />
-<br />
Rs 11.4<br />
crore<br />
Rs 1.7<br />
crore<br />
Rs 273<br />
crore<br />
Rs 9.7<br />
crore
Umbrella<br />
Cloth<br />
Sewing<br />
Threads<br />
TOTAL<br />
Value<br />
Quantity<br />
Value<br />
Quantity<br />
Value<br />
Value<br />
Production Imports Exports<br />
Rs 1220<br />
crore<br />
-<br />
2007-08 2012-13<br />
Rs 85 crore Rs 27crore<br />
9 million<br />
sq meter<br />
-<br />
<strong>Domestic</strong><br />
Consumption<br />
Rs 1280<br />
crore<br />
9 million sq<br />
meter<br />
<strong>Domestic</strong><br />
Consumption<br />
Rs 1710<br />
crore<br />
14 million sq<br />
meter<br />
- Rs 80 crore - Rs 80 crore Rs 120crore<br />
136,985<br />
MT<br />
Rs 3990<br />
crore<br />
Rs 6,507<br />
crore<br />
1860 MT 8845 MT 130,000 MT 191,000 MT<br />
Rs 50 crore<br />
Rs 401<br />
crore<br />
Rs 140<br />
crore<br />
Rs 338<br />
crore<br />
Rs.3900<br />
crore<br />
Rs 6,570<br />
crore<br />
As per ECTT report, the potential market sizing for 2007-08 was as given below:-<br />
Market size<br />
(ECTT report)<br />
Shoe laces<br />
Interlinings<br />
Zip Fasteners<br />
Elastic Narrow<br />
Fabrics (Tapes)<br />
Velcro<br />
Labels<br />
2001-02 2007-08 (P)<br />
Quantity 2469 T 3308 T<br />
Value Rs. 144 crore Rs. 193 crore<br />
Quantity 94.2 million meters 156.17 million meters<br />
Value Rs. 246 crore Rs. 407.3 crore<br />
Quantity 75 million meters 143.5 million meters<br />
Value Rs. 300 crore Rs. 574 crore<br />
Quantity<br />
Value Rs. 1000 crore Rs. 1772 crore<br />
Quantity 250 million meters 314 million meters<br />
Value Rs. 120 crore Rs. 212 crore<br />
Quantity<br />
Value Rs. 700 crore Rs. 1200 crore<br />
Umbrella Cloth Quantity 490 T 940 T<br />
Rs.5730<br />
crore<br />
Rs 9,665<br />
crore<br />
Export<br />
Potential<br />
Rs 38 crore<br />
-<br />
Rs 226<br />
crore<br />
Rs 550<br />
crore
Market size<br />
(ECTT report)<br />
Sewing Threads<br />
2001-02 2007-08 (P)<br />
Value Rs. 9.13 crore Rs. 17.5 crore<br />
Quantity 95,000 T 1,35,100 T<br />
Value Rs. 2876 crore Rs. 4040 crore<br />
TOTAL Value Rs. 5395.13 crore Rs. 8415.8 crore<br />
Capital Employed and Pr<strong>of</strong>itability <strong>of</strong> key players <strong>of</strong> Clothtech<br />
Company Name<br />
Capital Employed<br />
(Rs crore)<br />
Net Pr<strong>of</strong>it Margin<br />
(%)<br />
2006-07 2007-08 2006-07 2007-08<br />
Arex Industries Ltd. 22.8 23.6 7.7% 5.1%<br />
Ashima Ltd. 287.0 255.1 -9.1% -13.3%<br />
Bombay Dyeing & Mfg. Co. Ltd. 959.5 1238.1 -7.4% -4.8%<br />
Delta Corp Ltd. 108.8 384.2 45.9% 22.4%<br />
Gopala Polyplast Ltd. 42.5 38.3 1.0% -3.1%<br />
Malwa Cotton Spg. Mills Ltd. 191.8 180.8 1.3% -0.4%<br />
Precot Meridian Ltd. 325.3 325.4 5.5% 1.4%<br />
Premco Global Ltd. 14.2 14.7 3.4% 1.9%<br />
Ruby Mills Ltd. 146.0 232.7 8.0% 4.4%<br />
Sangam (India) Ltd. 671.6 735.0 4.9% 0.8%<br />
Shri Lakshmi Cotsyn Ltd. 282.5 503.8 4.4% 6.0%<br />
Sky Industries Ltd. 23.6 30.4 1.1% 1.0%<br />
Spica Elastic Ltd. 25.1 26.4 2.3% 1.5%<br />
Uniproducts (India) Ltd. 57.1 76.4 2.8% 2.9%<br />
Uniroyal Industries Ltd. 16.4 15.4 -9.0% 1.6%<br />
V M T Spinning Co. Ltd. 82.9 97.0 16.5% 9.3%<br />
Vardhman Threads Ltd. 48.1 29.7 26.4% 81.5%<br />
Source: Prowess Database, IMaCS Analysis<br />
Clothtech segment <strong>of</strong> <strong>technical</strong> <strong>textiles</strong> is estimated to provide employment to 70,000 people 18 <strong>of</strong><br />
whom number <strong>of</strong> <strong>technical</strong> 19 employees is estimated at 50,000 and number <strong>of</strong> non-<strong>technical</strong><br />
employees is estimated at 20,000.<br />
18 Employment has been estimated based on the analysis <strong>of</strong> primary and secondary data available for the<br />
<strong>technical</strong> textile manufacturers. IMaCS has made appropriate adjustments because <strong>of</strong> insufficient data.<br />
19 Technical includes managerial staff and skilled labour whereas non-<strong>technical</strong> includes unskilled labour.
Impediments to growth<br />
The cheaper imports <strong>of</strong> clothtech products (like umbrella cloth, interlinings and hook & loop<br />
fasteners) from China and other South Asian countries is the major impediment <strong>of</strong> growth <strong>of</strong> clothtech<br />
products. The machinery sourced by Indian manufacturers is expensive as compared to cheaper<br />
machinery used by Chinese manufacturers, hence, increasing the fixed costs. Further, the Chinese<br />
companies have better economies <strong>of</strong> scale e.g. a hook and loop fastener company typically has 400-<br />
500 looms in China whereas Indian companies have 70-80 looms only.
Shoe laces<br />
Shoe lace is a band that pulls the shoe together to hold it to the foot. A shoelace consists <strong>of</strong> two<br />
components: a tape that pulls the shoe tightly together, and an aglet, the hardened taped end that fits<br />
through the eyelets on a shoe or boot. Shoe laces are also known as shoestrings or boot laces<br />
Shoe Laces also find application in garments (kids wear), shopping bags, <strong>of</strong>fice stationary, home<br />
decoration etc. However the <strong>consumption</strong> in these applications is negligible as compared to that in the<br />
footwear industry.<br />
Product characteristics<br />
Shoe laces are primarily made <strong>of</strong> Polyester, Cotton and Nylon. Polyester shoe laces dominate the<br />
market because <strong>of</strong> higher durability and better anti-slip properties. Cotton shoe laces are waxed to<br />
improve their performance and appearance.<br />
Shoe laces are manufactured in variety <strong>of</strong> colours, shapes and sizes. Shoe laces are available in<br />
colours such as white, black, brown, blue, green, red, orange, yellow, etc. as well as colour<br />
combinations and patterns based on customer requirements. The product can be flat, round or oval in<br />
shape. Round laces are generally used for leather/formal shoes where as flat laces find majority <strong>of</strong> its<br />
application in sport/casual shoes.<br />
Type <strong>of</strong> lace Average Width / Diameter<br />
Flat 8-10 mm<br />
Round 3-5 mm<br />
Source: <strong>Industry</strong> survey<br />
Shoe laces are manufactured in standard sizes <strong>of</strong> 24”, 30”, 36”, 48” etc. as well as custom made as per<br />
the required length which depends on the application. The 24” and 30” sizes constitute 80% <strong>of</strong> the<br />
market.<br />
Market dynamics and key growth drivers<br />
Shoe laces are a commodity product. The simple technology level and minimal functionality <strong>of</strong> the<br />
product make it difficult for manufacturers to differentiate their products. Since the product<br />
contributes a small share to the total cost <strong>of</strong> footwear, most footwear manufacturers allow their<br />
manufacturing units to source shoe laces locally rather than doing centralised purchase. Thus, cost<br />
competitiveness and ability to provide variety <strong>of</strong> shades are the critical factors for success.<br />
Majority <strong>of</strong> the <strong>consumption</strong> <strong>of</strong> shoe laces is in the footwear industry. Footwear industry is a<br />
significant segment <strong>of</strong> Indian industry with India ranking second among the footwear producing
countries next only to China. The Indian footwear market in 2007-08 is estimated at 2.2 billion pairs<br />
including both open and closed footwear (Source: NMCC report). In addition, India exported 143<br />
million pairs <strong>of</strong> footwear in 2007-08.<br />
The Indian footwear retail market is anticipated to surge at a CAGR <strong>of</strong> 20% during the next 3 years on<br />
account <strong>of</strong> rising brand and fashion awareness and improving living standard. The taste <strong>of</strong> Indian<br />
consumers is gradually inclining towards casual resulting in the expansion <strong>of</strong> the casual footwear<br />
market which is expected to have a share <strong>of</strong> approximately 60% in the overall footwear retail market.<br />
The growth trend in the footwear industry signals good prospects for the shoe lace industry however,<br />
considering the changes in consumer preference the shoe lace industry is expected to grow at a rate <strong>of</strong><br />
6%year on year.<br />
Market size <strong>of</strong> Shoe laces and future forecast<br />
Shoes account for majority <strong>of</strong> <strong>consumption</strong> <strong>of</strong> shoe laces. In 2007-08, the domestic market size <strong>of</strong> foot<br />
wear in India is estimated to be 2200 million pairs out <strong>of</strong> which closed foot wear account for 50%<br />
share. Amongst the closed footwear segment 55% <strong>of</strong> the footwear are expected to have laces. In<br />
addition majority <strong>of</strong> the exported footwear are expected to bear laces.<br />
Usage <strong>of</strong> Shoe laces<br />
Usage <strong>of</strong> Shoe laces<br />
Total domestic footwear market 2200 million pairs<br />
Share <strong>of</strong> closed footwear 50%<br />
Share <strong>of</strong> sports footwear bearing laces 30% <strong>of</strong> Closed footwear market<br />
Share <strong>of</strong> men’s footwear bearing laces 25% <strong>of</strong> closed footwear market<br />
Total footwear exports 143 million pairs<br />
Share <strong>of</strong> exported footwear with laces 70%<br />
Replacement market 10%<br />
Price per pair <strong>of</strong> shoe lace Rs. 2.50<br />
Weight <strong>of</strong> material required to manufacture a pair <strong>of</strong> lace 3 gms<br />
Source: <strong>Industry</strong> survey, IMaCS analysis, DGCIS<br />
Laces are also used in other applications i.e. garments (kids wear), shopping bags, <strong>of</strong>fice stationary,<br />
home decoration etc. The usage <strong>of</strong> laces in these applications is expected to be 10% <strong>of</strong> the total usage.<br />
Current Market size and future potential<br />
The market size for shoe laces is estimated to be 2540 MT valued at Rs. 215 crore. With increasing<br />
disposable income and improving living standard the per capita <strong>consumption</strong> <strong>of</strong> footwear is expected
to increase over the next three years. Considering the growth prospects <strong>of</strong> the Indian footwear<br />
industry and the changes in consumer preference the demand for shoe lace is expected to increase at<br />
6% year on year. Hence, the demand for shoe lace is expected to increase to 3400 MT by 2012 –<br />
2013. The market potential in 2012-13 is estimated at Rs 365crore. An inflationary increase <strong>of</strong> 5% has<br />
also been considered to derive the projected market size.<br />
Market size for shoe laces 2007-08 2012-13<br />
Quantity<br />
850 million pairs 1135 million pairs<br />
2540 MT 3400 MT<br />
Value Rs 215 crore Rs 365 crore<br />
Key manufacturers <strong>of</strong> shoe laces<br />
Source: <strong>Industry</strong> survey, IMaCS analysis<br />
The shoe lace manufacturers are predominantly SSI units and are located in the footwear<br />
manufacturing clusters <strong>of</strong> Agra, Chennai, Vellore, Kanpur, Kolkata etc. Some <strong>of</strong> the manufacturers <strong>of</strong><br />
shoe laces are:-<br />
• Neelam shoe lace industry (Delhi),<br />
• Indian Shoe lace (Agra). Indian shoe Lace Company has a capacity <strong>of</strong> manufacturing 25,000<br />
shoe lace pairs per day.<br />
Imports & Exports <strong>of</strong> Shoe laces<br />
The estimated import figures for laces are as given below:-<br />
HS Code Description<br />
Imports<br />
(in Rs crore)<br />
2007-08(E)<br />
58062000, 58063910, 58063990, 58081090 SHOE LACES* ~ Rs 15-20 crore<br />
Source: IBIS, IMaCS Analysis<br />
* Apart from these HS codes, Shoe-laces are also imported in nominal amounts under the HS codes - 58042990,<br />
58043000, 58061000, 58063930, 58079090, 63079090 (included in Imports value above)<br />
Hong Kong and Thailand account for over 80% <strong>of</strong> imports <strong>of</strong> shoe laces followed by China. Marginal<br />
quantity <strong>of</strong> shoe laces is also imported from Indonesia, Taiwan, US, Italy, Germany and other<br />
European countries.<br />
The direct exports <strong>of</strong> shoe-laces from India are negligible.<br />
Raw materials<br />
Polyester, Cotton and Nylon are the main raw materials used for shoe laces. Fig 1 gives the raw<br />
material based market share <strong>of</strong> shoe laces. Polyester shoe laces have the largest market share and their<br />
share has been increasing over the years. These laces are manufactured from polyester filament yarn
<strong>of</strong> 300 denier. Reliance Industries is the major supplier <strong>of</strong> polyester yarn in India. Cotton shoe laces<br />
are manufactured using cotton yarn <strong>of</strong> counts 6s, 10s, 20s and 40s. Dyed yarn is used for<br />
manufacturing standard coloured shoe laces like black, brown, blue etc.<br />
Raw material based market share <strong>of</strong> shoe laces<br />
Key machinery manufacturers/suppliers in India<br />
The machinery used for manufacturing shoe laces is given below:<br />
Machine<br />
Approximate Cost <strong>of</strong><br />
machine (Rs) Capacity<br />
Braining machine 7,500 – 20,000 60 -70 metre/hour<br />
Tipping machine<br />
Manual 80,000<br />
Semi-automatic 150,000<br />
Automatic 250,000 500 pairs/hour<br />
Waxing machine 75,000<br />
Source: <strong>Industry</strong> survey<br />
Geesons International (Ahmadabad) and Shiv Engineering Works (Faridabad) are some <strong>of</strong> the<br />
manufacturers <strong>of</strong> braiding machines.<br />
Quality Control and standards in India<br />
25%<br />
There are no IS codes for shoe laces. The manufacturers use the testing facilities <strong>of</strong> FDDI (Noida).<br />
5%<br />
70%<br />
Polyester Cotton Others
Interlining<br />
Interlining is a fabric used between the inner and outer layer <strong>of</strong> the garment to improve shape<br />
retention, strength or bulk. Interlining finds application in the waistbands, flies, pockets and belt loops<br />
<strong>of</strong> men's trousers; in the cuffs, collars and plackets <strong>of</strong> shirts and in the lapels, fronts, collars and<br />
pockets <strong>of</strong> tailored jackets and blazers. Invisible from the outside, interlining ensures accurate fit and<br />
optimum wearer comfort and thus, forms an important part <strong>of</strong> the garment.<br />
The Garment sector is presently one <strong>of</strong> the most important sectors in the economy in terms <strong>of</strong> output,<br />
foreign exchange earnings and employment. In FY2006 India’s total production in the Garment sector<br />
was estimated at 7.85 billion pieces (Rs. 933 billion) out <strong>of</strong> which exports comprised <strong>of</strong> 2.24 billion<br />
pieces (Rs 372 billion). Garment industry maintained a growth rate <strong>of</strong> 15% in 2007-08 and is expected<br />
to grow at a CAGR <strong>of</strong> around 13% over the next five years. The proposed growth <strong>of</strong> the garment<br />
sector signals good potential for interlinings.<br />
Product characteristics<br />
Interlining may be woven, knitted or nonwoven made out <strong>of</strong> cotton, polyester, polyester/cotton or<br />
polyester/viscose blend. Nonwoven interlining is available in weight ranging from 18 gsm to 70 gsm<br />
whereas woven interlining is available in weight ranging from 120 gsm to 250 gsm. Both woven and<br />
nonwoven interlinings are available in fusible as well as non-fusible varieties.<br />
Fusible interlining is a base fabric coated with a thermoplastic material usually HDPE or LDPE. It<br />
can be bonded to another fabric by the application <strong>of</strong> heat and pressure. Fusing <strong>of</strong>fers many<br />
advantages to both garment manufacturer and wearer. For the wearer, garment durability is increased<br />
and crease-recovery is improved. For the manufacturer, garments can be produced to a consistent<br />
quality.<br />
Key application areas <strong>of</strong> interlining<br />
Interlinings are majorly used in garments, the choice being driven by the buyer’s requirement and<br />
cost. Majority <strong>of</strong> garment manufacturers use fusible interlinings however, basic interlinings find<br />
application as the back cloth for embroidery. Interlinings also find application in shoes, furnishing,<br />
etc.<br />
Market dynamics and key growth drivers<br />
The demand for interlining is majorly governed by the demand for garments. Readymade and tailor<br />
made shirts account for 80% <strong>of</strong> the <strong>consumption</strong> <strong>of</strong> interlining, the balance 20% <strong>of</strong> interlining being<br />
consumed in other garments i.e. trousers, jackets, ladies dresses, suits.
The current domestic men’s readymade shirt market in India is estimated at 375 million pieces<br />
accounting for 23% <strong>of</strong> the total men’s wear market and is expected to grow at a CAGR <strong>of</strong> 12% over<br />
the next five years. The domestic women’s readymade shirt market has also seen a new dimension<br />
owing to the growing number <strong>of</strong> working women, changing fashion trends, rising level <strong>of</strong> information<br />
and media exposure and entry <strong>of</strong> large number <strong>of</strong> foreign brands. The segment is expected to grow at<br />
a CAGR <strong>of</strong> 15-20% over the next five years. In addition, the estimated sale <strong>of</strong> shirting fabric in 2007-<br />
08 was approximately 1750 million meters which corresponds to 800 million pieces <strong>of</strong> shirts. India<br />
exported 208 million pieces <strong>of</strong> shirts in 2007-08 (Source: DGCIS data) and the exports are expected<br />
to achieve a volume growth <strong>of</strong> 4-5%. The healthy growth in garment industry signals a good growth<br />
potential for the interlining industry though the market for interlining is very price conscious.<br />
Market size <strong>of</strong> interlining fabric and future forecast<br />
Readymade and tailor-made shirts account for 80% <strong>consumption</strong> <strong>of</strong> interlining fabric. On an average<br />
each shirt requires 15 to 20 cm <strong>of</strong> interlining. Interlinings are not used in all shirts; the choice based<br />
on requirement <strong>of</strong> the buyer and cost.<br />
Usage <strong>of</strong> interlining for shirts in 2007-08<br />
Readymade shirts for domestic <strong>consumption</strong> 423 million pieces<br />
Tailor made shirts for domestic <strong>consumption</strong> 800 million pieces<br />
Shirt exported 208 million pieces<br />
Shirts considered for interlining 960 million pieces<br />
Interlining required per shirt 15 – 20 cm<br />
Interlining required for shirts 170 million meters<br />
The domestic market size <strong>of</strong> interlining for shirts is estimated at 170 million meters. Other garments<br />
are expected to account for approximately 20% <strong>of</strong> the interlining domestic <strong>consumption</strong>. Thus, the<br />
total market for interlining fabric is estimated at 215 million meters valued at Rs. 515 crore.<br />
The observed trend in the garment industry reveals a shift towards readymade garments. Thus, the<br />
domestic <strong>consumption</strong> <strong>of</strong> readymade shirts is expected to increase at 10% year on year. The domestic<br />
<strong>consumption</strong> <strong>of</strong> tailor made shirts is expected to increase at 5% year on year. Thus, the demand for<br />
interlining is expected to increase to 290 million meters by 2012-13 (growing at around 7% year on<br />
year). The market potential in 2012-13 is estimated as Rs. 700 crore. No change (upwards or<br />
downwards) in the price <strong>of</strong> interlining has been assumed for deriving the projected market size. The<br />
current and future forecast <strong>of</strong> interlining <strong>consumption</strong> is given below:-
Market size <strong>of</strong> interlining<br />
fabric<br />
2007-08 2012-13<br />
Quantity 215 million meters 290 million meters<br />
Value Rs. 515 crore Rs. 700 crore<br />
Key manufacturers <strong>of</strong> interlining fabric<br />
Source: <strong>Industry</strong> survey, IMaCS Analysis<br />
In India, the key manufacturers <strong>of</strong> woven interlining are Bombay Dyeing, Ruby Mills, Ashima Syntex<br />
and Talreja Textiles. Bombay Dyeing has an installed capacity <strong>of</strong> 12 lakh meters per month <strong>of</strong> woven<br />
interlining. The company manufactures 100% cotton fusible interlining with both HDPE and LDPE<br />
coating. Ruby Mills has an installed capacity <strong>of</strong> 9 lakh meters per month. The company manufactures<br />
100% cotton woven interlining <strong>of</strong> both basic and fusible type. The fusible interlining is manufactured<br />
using powder coating technology. Ashima Syntex has an installed capacity <strong>of</strong> 6 million meters per<br />
annum <strong>of</strong> woven interlining. The company manufactures fusible interlining using HDPE/LDPE and<br />
polyester powder coating. Some <strong>of</strong> the other manufacturers <strong>of</strong> woven interlining are Udhawdas &<br />
Sons and Shri Lakshmi Cotsyn.<br />
Manufacturer Year Production<br />
quantity<br />
Installed capacity<br />
Bombay Dyeing Ltd. 2007-08 9.6 million meters 14.4 million meters<br />
Ruby Mills Ltd. 2007-08 6 million meters 10.8 million meters<br />
Ashima Syntex Ltd. 2007-08 NA 6 million meters<br />
Talreja Textile Ind Pvt. Ltd. 2007-08 NA 5 million meters<br />
Udhawdas & Sons 2007-08 5 million meters 6 million meters<br />
Shri Lakshmi Cotsyn Ltd. 2007-08 14 million meters<br />
Source: Capitaline, Annual reports, <strong>Industry</strong> survey<br />
In addition, there are a large number <strong>of</strong> small units which account for a significant share <strong>of</strong> the<br />
interlining production.<br />
Thermal bonded and chemical bonded nonwoven fabrics also find application as garment interlining.<br />
According to INDA report 140 million square meters <strong>of</strong> nonwoven interlining was consumed in India<br />
in 2006-07. The key manufacturers <strong>of</strong> non woven interlining fabric in India are:<br />
• Supreme Nonwovens Pvt. Ltd.<br />
• KK Nonwovens India<br />
• Freudenberg Nonwovens India Pvt. Ltd.Uniproducts (India) Ltd.
Imports and Exports <strong>of</strong> Interlining<br />
The estimated import figures for interlining are given below:<br />
HS Code Description<br />
54076900, 54078290<br />
55121910, 55132300<br />
59031090, 59039010<br />
59039090, 62179090<br />
56031100, 56031200<br />
56031300, 56031400<br />
56039100, 56039200<br />
56039300, 56039400<br />
100%POLYESTER,<br />
POLYESTER/COTTON<br />
BLENDED WOVEN,<br />
KNITTED, FUSIBLE<br />
INTERLINING<br />
100%POLYESTER,<br />
POLYESTER/COTTON<br />
BLENDED NON WOVEN<br />
INTERLINING<br />
Imports<br />
(in million<br />
meters)<br />
Imports<br />
(in Rs crore)<br />
2007-08(E) 2007-08(E)<br />
Around 25<br />
million meters*<br />
Around 100<br />
million meters<br />
~ Rs. 50 crore<br />
~ Rs. 35 crore<br />
Source: IBIS, IMaCS Analysis<br />
*Some interlining fabric is also imported under HS Codes 54049090, 54072090, 52121110, 60019100,<br />
60059000<br />
Interlining fabric is imported from Korea, Singapore, China, Hong Kong and Taiwan. China and<br />
Hong Kong together accounted for 70% <strong>of</strong> these imports.<br />
HS Code Description<br />
54076900,54078290<br />
55121910, 55132300<br />
59031090, 59039010<br />
59039090,62179090<br />
56031200,56039200<br />
56039400,<br />
100%POLYESTER,<br />
POLYESTER/COTTON<br />
BLENDED WOVEN,<br />
KNITTED,FUSIBLE<br />
INTERLINING<br />
100%POLYESTER,<br />
POLYESTER/COTTON<br />
BLENDED NON WOVEN<br />
INTERLINING<br />
Exports<br />
(in million<br />
meters)<br />
Exports<br />
(in Rs crore)<br />
2007-08(E) 2007-08(E)<br />
Around 2<br />
million meters*<br />
Around 6<br />
million meters<br />
~ Rs. 3 crore<br />
~ Rs. 5.5 crore<br />
Bangladesh and Srilanka account for more than 95% <strong>of</strong> these exports. The data indicate that the<br />
industry is import intensive. These exports are estimated to be Rs 11.4 crore for the year 2012-13.<br />
Raw materials<br />
Woven Interlining<br />
Woven interlinings are made <strong>of</strong> cotton, polyester and polyester/cotton blend. The fibres used are<br />
domestically sourced. The base fabric as such can be used as interlining (base interlining). Else the
fabric is coated with a thermoplastic material usually HDPE or LDPE to manufacture fusible<br />
interlining.<br />
Nonwoven Interlining<br />
Thermo bond and Chemical bond interlining are made <strong>of</strong> polyester, nylon and polypropylene sourced<br />
domestically.<br />
Key machinery suppliers for manufacturing Interlining<br />
Machine Company<br />
Machine for thermal bonding <strong>of</strong><br />
nonwoven<br />
A.T.E. Private Ltd.<br />
Machine for Chemical bonding <strong>of</strong> Dhall Enterprises and<br />
nonwoven<br />
Engineers Pvt. Ltd.<br />
Fusible Interlining Coating and Hi-Tech Engineers,<br />
Laminating Plants:<br />
Powder Dot Coating Plant<br />
Scatter Coating Plant<br />
Ahmedabad
Zip Fasteners<br />
A zipper (zip fastener or zip) is a device for temporarily joining two edges <strong>of</strong> fabric. Zippers have<br />
applications in the following areas:<br />
• Luggage industry: S<strong>of</strong>t luggage, handbags, purses, etc.<br />
• Apparel industry: Trousers, jackets, skirts, frocks, etc.<br />
• Home Furnishing industry: pillow covers<br />
• Leather Garment and Footwear industry: leather garments, shoes, etc.<br />
Product Characteristics<br />
Zip fastener/zipper consists <strong>of</strong> two parallel teeth stringers closed or opened by means <strong>of</strong> a sliding clip<br />
between them. A zipper has three major parts - the tape, the elements and the slider. Tape is usually<br />
made <strong>of</strong> polyester. However, other synthetic fibre tapes, vinyl tapes and cotton tapes are also used.<br />
Zippers can be classified into three main varieties based on the material <strong>of</strong> construction–<br />
Polyester/Nylon (Coil), Metallic and Moulded (Plastic).<br />
Polyester/nylon zippers have achieved greater commercial significance due to their light weight,<br />
longer life, corrosion resistance and easy availability in variety <strong>of</strong> colours. The application areas for<br />
various types <strong>of</strong> zippers are given below.<br />
Application area for various types <strong>of</strong> zippers<br />
Zippers Applications<br />
L type coil Trousers, Skirts<br />
Spiral Coil Trouser, Skirts, Jackets, Shoes/Boots, Luggage, Hand Bag<br />
Invisible Ladies Dresses (Back Opening), Leather Skirts<br />
Plastic Track suits, T-Shirts, Men's open shirts, Jackets<br />
Metal Denim, Cotton Trouser, Jackets, Industrial Wear, Tents, Shoes/Boots<br />
Source: <strong>Industry</strong> survey<br />
Zip fasteners are described according to width <strong>of</strong> the zip element. They are also known by their length<br />
and size (width <strong>of</strong> the zipper chain). The average size <strong>of</strong> a zipper here has been considered as 8” and<br />
the length <strong>of</strong> a zipper (tape length) on an average is 2 centimetres more than the size <strong>of</strong> the zip.<br />
Market dynamics and key growth drivers
Zippers dominate the category <strong>of</strong> fasteners. They are a key input to readymade garments industry,<br />
home furnishing industry, s<strong>of</strong>t luggage industry and leather garments and footwear industry (The table<br />
below gives the share <strong>of</strong> <strong>consumption</strong> <strong>of</strong> zippers in various application areas). Thus, growth in these<br />
end user industries is the key growth driver for the zipper industry.<br />
Consumption pattern <strong>of</strong> zip fasteners in India<br />
Application <strong>of</strong> zip fasteners % Share<br />
(2007-08)<br />
Export Garments 20%<br />
<strong>Domestic</strong> Garments 35%<br />
Luggage 30%<br />
Others* 15%<br />
*Includes cushion covers, leather products, exports etc.<br />
Source: <strong>Industry</strong> survey, IMaCS Analysis<br />
Readymade Garments industry is the largest consumer <strong>of</strong> zip fasteners. While all trousers and jeans<br />
have zippers, the product is also used to some extent in other garments such as frock, half pants, ladies<br />
dresses, skirts, jackets, kids wear and uniforms. Another major application <strong>of</strong> zip fasteners is in the<br />
s<strong>of</strong>t luggage items like hand bags, school bags, purses, laptop bags, brief cases etc. The average price<br />
<strong>of</strong> zipper is 50 paisa per inch. The <strong>consumption</strong> norms <strong>of</strong> zippers in various application areas are<br />
given below:<br />
End use product Consumption norm <strong>of</strong> zip<br />
fastener<br />
Trouser 7” to 9”<br />
Children suits 5”<br />
Ladies dresses 6” to 16”<br />
Jeans 6” to 8”<br />
Jackets 20” to 25”<br />
Bags Varies from 15” to 60”<br />
depending on the product<br />
Cushion cover 12” to 22”<br />
Sleeping bag 95” to 150”<br />
In a zipper, the tape (<strong>technical</strong> textile part) is on an average 10% <strong>of</strong> the total weight. The value <strong>of</strong> the<br />
tape is varies from 5% - 15% <strong>of</strong> the value <strong>of</strong> overall zipper. On an average the value <strong>of</strong> the tape is<br />
10% <strong>of</strong> the value <strong>of</strong> the zipper.<br />
Zippers are used extensively in the garment segment. The penetration <strong>of</strong> zippers is higher in the<br />
western garments compared to the Indian outfits. However with increase in the penetration <strong>of</strong> western<br />
outfits in the Indian clothing scenario the <strong>consumption</strong> <strong>of</strong> zippers in the overall garment sector is<br />
expected to increase in line with the growth <strong>of</strong> garment industry. The domestic garment <strong>consumption</strong><br />
is expected to register a CAGR <strong>of</strong> 10% for the next five years whereas the Indian garment export
segment is expected to grow at 4% year on year during the same period. Zippers have a significant<br />
penetration in the S<strong>of</strong>t luggage industry. Thus, the <strong>consumption</strong> <strong>of</strong> zippers is expected to increase in<br />
proportion to the growth in the s<strong>of</strong>t luggage industry (growing at 20% year on year). There are various<br />
other applications <strong>of</strong> zippers such as home furnishings (e.g. cushion covers), sleeping bags, footwear,<br />
leather products, etc. Home furnishing segment is expected to grow at 8% whereas the leather goods<br />
at around 6%.<br />
Market size <strong>of</strong> Zip Fasteners and future forecast<br />
The current and future forecast <strong>of</strong> the market size <strong>of</strong> Zip fasteners is given below:-<br />
Zip Fasteners <strong>Industry</strong> 2007-08 2012-13<br />
Quantity<br />
545 million<br />
meters<br />
950 million<br />
meters<br />
Value Rs 1370 crore Rs 2400 crore<br />
Quantity <strong>of</strong> TT Component (Tape)<br />
600 million<br />
meters<br />
1050 million<br />
meters<br />
Value <strong>of</strong> TT Component (Tape) Rs 150 crore Rs 265 crore<br />
Source: <strong>Industry</strong> survey, IMaCS Analysis<br />
The present <strong>consumption</strong> <strong>of</strong> zip fasteners in garment industry is estimated at 310 million meters<br />
valued at Rs. 620 crore. Luggage industry is another major consumer <strong>of</strong> zip fasteners; around 30% <strong>of</strong><br />
the total <strong>consumption</strong> <strong>of</strong> zip fasteners is in the luggage industry which is estimated at 160 million<br />
meters valued at Rs. 395 crore. Zip fasteners are also used in various other areas as home furnishings<br />
(e.g. cushion covers), sleeping bags, footwear, leather products, etc. which account for around 15% <strong>of</strong><br />
the total <strong>consumption</strong> <strong>of</strong> zip fasteners. The market size <strong>of</strong> zip fasteners for these applications is<br />
estimated at 85 million meters valued at Rs. 170 crore. Thus, the total market size for zip fasteners is<br />
estimated at 545 million meters valued at Rs. 1370 crore. The product mix <strong>of</strong> the zip fasteners market<br />
is given below.<br />
Market share <strong>of</strong> various varieties <strong>of</strong> zippers<br />
Zip Fasteners % Share<br />
Polyester/Nylon zippers 65%<br />
Metallic zippers 25%<br />
Plastic zippers 10%<br />
Total 100%<br />
Source: <strong>Industry</strong> survey<br />
The total market size for zip fasteners is expected to increase to 950 million meters registering a<br />
growth rate <strong>of</strong> 12% year-on-year. The market potential in 2012 – 2013 is estimated at Rs. 2400 crore.<br />
Overall the <strong>consumption</strong> <strong>of</strong> zippers in these application areas is expected to grow at a moderate rate <strong>of</strong><br />
7%.
Key manufacturers <strong>of</strong> Zip fasteners<br />
The key manufacturers <strong>of</strong> zip fasteners are:<br />
• YKK India Private Limited<br />
• Tex Corp. Ltd.<br />
• Zip Industries Ltd.<br />
• Coats India<br />
• Ansun Multitech (India) Ltd.<br />
• Sanghi Zip Fasteners<br />
• Nipon Zip <strong>Industry</strong> Pvt. Ltd.<br />
• Orbit Zippers Pvt. Ltd<br />
• E. Z. Y. Slide Fastners Limited<br />
• Prym Fashion India Private Limited<br />
Ansun Multitech (India) Ltd. manufactures nearly two million assembled Zipper Sliders, 50,000 to<br />
60,000 pieces <strong>of</strong> finished heavy duty Brass Denim Zippers, 25,000 Meters <strong>of</strong> Heavy Duty CFC Zipper<br />
long chain for Luggage and few other accessories. Besides these there are many small scale units that<br />
manufacture zip fasteners. These players in the unorganised sector account for 60% <strong>of</strong> the domestic<br />
production <strong>of</strong> zip fasteners.<br />
Imports & Exports <strong>of</strong> Zip Fasteners<br />
The estimated import figures for zip fasteners are as given below:-<br />
HS Code* Description<br />
96072000, 96071110/90,<br />
96071910/90<br />
Imports<br />
(Quantity)<br />
Imports<br />
(in Rs crore)<br />
2007-08(E) 2007-08(E)<br />
ZIP FASTENER ~ 6 million meters ~ Rs 60 crore<br />
Source: DGCIS, IBIS, IMaCS Analysis<br />
* Around 95% <strong>of</strong> imports take place under the mentioned HS codes<br />
Hong Kong and China together contribute around 70% to the total imports, whereas Taiwan and<br />
Japan contribute around 8% each. Zip fasteners are also imported in small quantities from Italy,<br />
Japan, Tukey and UK.<br />
The estimated export figures for Zip fasteners are as given below:-<br />
HS Code* Description<br />
96071110, 96071910/90,<br />
96072000<br />
Exports<br />
(Quantity)<br />
Exports<br />
(in Rs crore)<br />
2007-08(E) 2007-08(E)<br />
ZIP FASTENER ~ 20 million meters ~ Rs 10 crore
Source: IBIS, IMaCS Analysis<br />
Over 55% <strong>of</strong> the exports <strong>of</strong> zip fasteners are to Bangladesh whereas around 12% are exported to<br />
Pakistan, 10% to Sri Lanka and 8% to UAE. Out <strong>of</strong> the total exports the <strong>technical</strong> textile component is<br />
only about Rs 1.5 crore. These exports are estimated to be Rs 1.7 crore for the year 2012-13.<br />
Quality Standards Applicable<br />
The main quality standards applicable for the zip fasteners in India are: IS 8894/3184/4829. Other<br />
international standards are JIS-S3015 and ASTM D2061-1998
Elastic Narrow Fabrics<br />
Elastic narrow fabrics are an important input to the undergarment industry. They are also used in other<br />
garments i.e. shorts, jackets and skirts, moulded luggage, baby diapers, sports goods, medical goods,<br />
etc.<br />
Product characteristics<br />
Elastic narrow fabrics are made from an elastomeric yarn and yarns made from cotton, polyester and<br />
nylon. More than 3000 different varieties <strong>of</strong> elastic fabrics are manufactured however, based on<br />
manufacturing technology they can be classified as woven and knitted. The fabric is expected to have<br />
the following properties:-<br />
• Stretchability<br />
• Shrink resistance<br />
• Durability to regular wash<br />
• S<strong>of</strong>t feel<br />
Knitted elastic tapes are generally available in widths 8 mm, 12 mm, 20 mm and 25 mm. Woven<br />
elastic tapes range in widths 25 mm, 32 mm and 38 mm. These elastic tapes are primarily used for<br />
undergarments. The narrow fabric is made with or without logo along the length depending on<br />
customer’s requirement.<br />
Market dynamics and key growth drivers<br />
Elastic narrow fabrics are majorly consumed in inner wears. The inner wear market accounts for<br />
around 15 - 20% <strong>of</strong> the total apparel sales volume in India. This market is expected to maintain a<br />
steady volume growth <strong>of</strong> 6% which functions as a key driver for growth in elastics industry.<br />
Market size <strong>of</strong> elastics and future forecast<br />
Undergarments account for 80 - 85% <strong>of</strong> the <strong>consumption</strong> <strong>of</strong> elastic fabrics. As per the National<br />
Household Survey 2006 by Textile Committee the undergarment domestic <strong>consumption</strong> in 2005 -<br />
2006 was around 650 million pieces growing at a CAGR <strong>of</strong> 6% over the last 2 years. Thus, the<br />
undergarment market in 2007-08 is estimated at 750 million pieces in 2007-08 <strong>of</strong> which<br />
approximately 0.6 million pieces are imported. In addition, 50 million pieces <strong>of</strong> undergarments were<br />
exported in the same year. On an average each undergarment consumes 0.83 meters <strong>of</strong> elastic. The<br />
average price <strong>of</strong> elastic narrow fabric is Rs. 4.4 per meter.<br />
In addition elastic tapes are also used in garments, moulded luggage, wrist bands, baby diapers, etc.<br />
The usage <strong>of</strong> elastics in these applications is 15 – 20% <strong>of</strong> the total usage.
Current Market size and future potential<br />
The current and future forecast <strong>of</strong> the domestic usage <strong>of</strong> elastic narrow fabrics is given below:<br />
<strong>Domestic</strong> usage <strong>of</strong> Elastic narrow<br />
fabrics<br />
2007-08 2012-13<br />
Quantity<br />
830 million<br />
meters<br />
1,110 million<br />
meters<br />
Value Rs 365 crore Rs 625 crore<br />
Source: <strong>Industry</strong> survey, IMaCS Analysis<br />
The market size for elastic narrow fabrics is estimated at 830 million meters valued at Rs. 365 crore.<br />
The demand for elastic tapes is expected to increase to 1110 million meters by 2012-13 registering a<br />
growth rate <strong>of</strong> 6% per annum. The market potential in 2012-13 is estimated to be Rs. 623 crore. An<br />
inflationary increase <strong>of</strong> 5% has also been considered to estimate the market size.<br />
Key manufacturers <strong>of</strong> elastics<br />
Spica Elastic Private Limited is the largest manufacturer <strong>of</strong> narrow elastic fabrics in India with<br />
installed capacity <strong>of</strong> 18 million metres <strong>of</strong> narrow fabrics per month. The company has vertically<br />
integrated production facilities and manufactures broad range <strong>of</strong> products including men’s jacquard<br />
elastics for briefs and boxers, men’s plain elastics for briefs and boxers, bra strap elastics and ladies<br />
panty elastics in 100% Cotton, Nylon and Polyester.<br />
The major producers <strong>of</strong> elastics in India are given as follows:<br />
Manufacturer Year Production<br />
(million<br />
meters)<br />
Value<br />
(Rs crore)<br />
Price<br />
(Rs per<br />
meter)<br />
Installed capacity<br />
(Million Meters)<br />
Spica Elastics 2007-08 180 NA NA 216<br />
Sky Industries 2007-08 141.5 27.2 2 202.9<br />
B. R. Elastic 2007-08 7.25 NA NA NA<br />
Source: Spica Group website, Sky Industries annual report<br />
Import and Exports <strong>of</strong> elastics<br />
The import figures for elastic narrow fabrics are as given below:-
HS Code Description<br />
58062000, 58061000,<br />
58063990, 58089090,<br />
60012200, 60029000,<br />
60024000, 60059000,<br />
NARROW WOVEN FABRICS<br />
WITH 5% OR MORE OF<br />
ELASTOMER YARN THREAD<br />
KNITTED OR CROCHETED<br />
NARROW FABRICS<br />
Imports Quantity<br />
(million meters)<br />
Imports Value<br />
(Rs crore)<br />
2007-08(E) 2007-08 (E)<br />
~ 110 million<br />
meters<br />
~ Rs 50 crore<br />
~ 1.5 million<br />
~ Rs 15 crore<br />
meters<br />
Source: IBIS, IMaCS Analysis<br />
Almost 40% <strong>of</strong> the elastic narrow fabrics are imported from Hong Kong followed by around 17%<br />
from Srilanka and 14% from China. Imports also take place from Philippines and Vietnam<br />
The export figures for elastic narrow fabrics are as given below:-<br />
HS Code Description<br />
58062000, 58061000,<br />
58063990, 58089090,<br />
60012200, 60029000,<br />
60024000, 60059000<br />
OTHR NARROW WVN<br />
FBRCS CNTNG BY WT<br />
5% OR MORE OF<br />
ELASTOMRC<br />
YRN/RUBR THRD<br />
KNITD OR<br />
CROCHETED NARROW<br />
FBRCS<br />
Exports Quantity<br />
(million meters)<br />
Exports Value<br />
(Rs crore)<br />
2007-08(E) 2007-08 (E)<br />
~ 65 million meters ~ Rs 145 crore<br />
~ 45 million meters ~ Rs 11 crore<br />
Source: IBIS, IMaCS Analysis<br />
The key export destinations <strong>of</strong> elastic fabrics are Egypt and Sri Lanka with export share <strong>of</strong> 25% and<br />
28% respectively. These exports are estimated to be Rs 273 crore for the year 2012-13.<br />
Raw-materials<br />
Elastic narrow fabrics are made from heat resistant latex thread generally referred to as Rubber thread<br />
or heat resistance spandex yarn. This yarn is woven or knitted along with yarns <strong>of</strong> polyester, nylon or<br />
cotton. Polyester yarn <strong>of</strong> 150 deniers and nylon yarn <strong>of</strong> 210 denier are used for the purpose.<br />
Key machinery suppliers
The key machinery suppliers in India are:<br />
Company Machines supplied<br />
Trikso India Machineries,<br />
Ahmedabad<br />
Susmatex Machinery<br />
Ltd., Ahmedabad<br />
Other key suppliers <strong>of</strong> machinery are:<br />
• A.T.E Pvt. Ltd.<br />
• Biance Textile Solutions (I) Pvt. Ltd.<br />
• Laxmi Automatic Loom Works<br />
• Himson Textile Engineering Industries Pvt. Ltd.<br />
High Speed Needle Looms<br />
Festooning machine<br />
Warping Machine<br />
Elastic finishing machine<br />
Measuring & spool winding machine<br />
Electric Jacquared For Narrow Fabric Loom<br />
Needle Loom<br />
Warping Machine<br />
Quality Control and Standards – The manufacturer <strong>of</strong> the elastic narrow fabric usually follows the<br />
breaking strength and elongation specifications given by the customer.
Hook and Loop Tape Fasteners (Velcro)<br />
Velcro is a brand name <strong>of</strong> the fabric hook-and-loop fasteners however today it is used as a generic<br />
term for the product hook & loop tape fasteners. Hook and loop (H&L) fasteners consist <strong>of</strong> a<br />
combination <strong>of</strong> two separate woven tapes, one called as hook tape and the other as loop tape. The<br />
tapes display excellent fastening properties when placed in contact with each other and thus <strong>of</strong>fer<br />
hundreds <strong>of</strong> potential closure systems (fastening applications) for a wide range <strong>of</strong> applications. H&L<br />
fasteners find application in industries such as:<br />
• Leather garments/furnishings<br />
• Surgical and orthopaedic apparatus<br />
• Shoes and footwear manufacturing<br />
• Luggage/bag manufacturers<br />
• Toys<br />
• Plastic goods<br />
• Automobile upholstery and various other industry segments.<br />
H&L fasteners are easy to use, safe and maintenance free. The effectiveness <strong>of</strong> the fastener is<br />
maintained even after repeated fastening and unfastening. Thus, the product has achieved good<br />
penetration in various application areas. Velcro held together a human heart during the first artificial<br />
heart surgery. It is used in nuclear power plants and army tanks to hold flashlights to walls. Cars use it<br />
to bond headliners, floor mats and speaker covers. It is used in the home when pleating draperies,<br />
holding carpets in place and attaching upholstery, among many other things. It closes backpacks,<br />
briefcases and Trapper Keepers, secures pockets and holds disposable diapers on babies. It is used in<br />
surfboard leashes and orthopaedic braces. H&L fasteners made <strong>of</strong> Teflon loops, polyester hooks, and<br />
glass backing is used on space shuttles.<br />
Product Characteristics<br />
H&L fasteners are generally made <strong>of</strong> Nylon and Polyester. The product is available in width ranging<br />
from 12 mm to 125 mm and length <strong>of</strong> 25 meters though it can be produced in any length depending<br />
upon the customer’s requirement. The H&L fastener <strong>of</strong> 1 meter length and 25 mm <strong>of</strong> width, weighs<br />
7.5 grams.<br />
Market dynamics and key growth drivers<br />
H&L fasteners are used as fastening system in a variety <strong>of</strong> areas. Footwear industry is the major<br />
consumer <strong>of</strong> H&L fastener accounting for around 20-25% <strong>of</strong> the total <strong>consumption</strong>. In the footwear<br />
industry especially these fasteners are used in the kids and speciality sports category. Defence
segment consumes H&L fasteners in clothing and other accessories and is the second largest<br />
application area with around 7-10% usage. Other important segments which consume around 10% <strong>of</strong><br />
H&L fasteners are nettings, automobile and saddlery segment. Other applications include orthopaedic<br />
goods, sports goods, leather goods, abrasives, stationary, luggage etc.<br />
The price <strong>of</strong> H&L fasteners is indirectly related to the oil prices as the raw material (nylon/polyester)<br />
is a petroleum product. However the price variations are not proportionate and are experienced after a<br />
long time lag. The average price <strong>of</strong> one meter tape in the year 2007-08 was Rs 3.90.<br />
Market size <strong>of</strong> H&L fasteners and future forecast<br />
Shoe industry is the largest consumer <strong>of</strong> H&L fasteners. While all the kids’ shoes and floaters have<br />
H&L fasteners their application is lesser in other category <strong>of</strong> shoes. Another major application <strong>of</strong><br />
H&L fasteners is in the defence segment for the clothing. It also has an application in s<strong>of</strong>t luggage<br />
items like hand bags, school bags, purses, laptop bags, etc. The average price <strong>of</strong> H&L fastener is Rs<br />
3.9 per m. The <strong>consumption</strong> norms <strong>of</strong> H&L fasteners in various application areas are given below:<br />
End use product Consumption norm <strong>of</strong><br />
H&L fastener<br />
Shoes 5 to 15 cms<br />
Defence clothing 50 to 75 cms<br />
Automobile 50 to 100 cms<br />
Saddlery 75 to 100 cms<br />
Netting Equivalent to the perimeter<br />
<strong>of</strong> the net<br />
Bags Varies from 5 to 50<br />
depending on the product<br />
Cushion cover 5 to 25 cms<br />
Sleeping bag 50 cm to 2 meters<br />
Robe 5 to 10 cms<br />
The current and future forecast <strong>of</strong> H&L Fastener’s <strong>consumption</strong> is given below:<br />
Market size <strong>of</strong> H&L Fasteners 2007-08 2012-13<br />
Quantity<br />
165 million<br />
meters<br />
300 million<br />
meters<br />
Value Rs 65 crore Rs 150 crore<br />
Source: <strong>Industry</strong> survey, IMaCS Analysis<br />
The current <strong>consumption</strong> <strong>of</strong> H&L fasteners is estimated at165 million meters valued at Rs 65 crore.<br />
The market is expected to increase to 300 million meters (growing at 12% year on year) by 2012 -
2013. The market potential in 2012 – 2013 is estimated at Rs 150 crore. An inflationary increase <strong>of</strong><br />
5% is considered for estimating the market size.<br />
Key manufacturers <strong>of</strong> Hook & Loop fasteners<br />
Sky Industries Limited is the largest manufacturer in India with over 50% market share. The company<br />
exports around 15% <strong>of</strong> its produce to USA (over 40%), Turkey (over 25%), Venezuela, UK and<br />
Sweden (6-8% each), Kenya, Tanzania, Srilanka and other European countries. Sky Industries had<br />
also worked towards successful implementation <strong>of</strong> anti-dumping on narrow woven fabrics originating<br />
in or exported from China and Chinese Taipei.<br />
Manufacturer Year Sales Quantity<br />
(lakh m)<br />
Value<br />
(Rs crore)<br />
Unit Price Installed<br />
capacity<br />
Sky Industries 2007-08 904.96 34.61 Rs 3.82/m 924 lakh meters<br />
The other manufacturers in this industry are<br />
• Siddartha Filaments Private Limited, Surat<br />
• Siddartha Magic Tapes Private Limited, Gujarat<br />
• Magic Fasteners Private Limited, Rohtak, Haryana.<br />
Imports & Exports <strong>of</strong> Hook & Loop fasteners<br />
The estimated import figures for H&L fasteners are as given below:-<br />
HS Code* Description<br />
58063990, 58061000,<br />
59119090, 58089090,<br />
39269099, 54073090,<br />
58063200, 58069190<br />
Source: Capitaline, Annual reports, <strong>Industry</strong> survey<br />
VELCRO TAPE, LOOP<br />
TAPE, HOOK AND<br />
LOOP FASTENER,<br />
ETC.<br />
Imports<br />
(Quantity)<br />
Imports<br />
(in Rs crore)<br />
2007-08(E) 2007-08(E)<br />
Approx 20<br />
million meters<br />
~ Rs 9 crore<br />
Source: IBIS, IMaCS Analysis<br />
* Around 95% <strong>of</strong> imports take place under the mentioned HS codes<br />
Hong Kong (30%) and Taiwan (40%) contribute around 70% to the total imports, whereas China<br />
contributes around 5% and Vietnam around 6%. Countries like Italy, USA, Denmark & Germany<br />
each have a share <strong>of</strong> 2-3% in the H&L fastener imports in India.<br />
The estimated export figures for H&L fasteners are as given below:-
HS Code* Description<br />
58061000, 58063990,<br />
59069910, 59119090,<br />
58063190, 59069990<br />
H&L FASTENER<br />
Exports<br />
(Quantity)<br />
Exports<br />
(in Rs crore)<br />
2007-08(E) 2007-08(E)<br />
Approx 8 million<br />
mts<br />
~ Rs 5.5 crore<br />
Source: IBIS, DGCIS, IMaCS Analysis<br />
*Around 98% <strong>of</strong> imports take place under the mentioned HS codes, with over 66% under 58061000<br />
Over 23% <strong>of</strong> the exports <strong>of</strong> H&L fasteners are to USA whereas around 18% are exported to Turkey,<br />
14% to Canada and around 8% each to France, Bulgaria and Venezuela. Around 5% is exported to<br />
UK & Sweden each. These exports are estimated to be Rs 9.7 crore for the year 2012-13.<br />
Raw Materials<br />
Nylon filament yarn <strong>of</strong> deniers 100, 140, 170, 210, 280, 300 and 430 are the key raw material for<br />
Hook & Loop fasteners. Few manufacturers also use around 10% <strong>of</strong> polyester only for the black<br />
coloured H&L tapes. Because <strong>of</strong> poor quality and inconsistency <strong>of</strong> the domestic supply <strong>of</strong> these yarns<br />
80 – 85% <strong>of</strong> the raw material is imported from Malaysia or Taiwan under the HS Code 54026990.<br />
Key players like Sky Industries import around 90% <strong>of</strong> their raw material requirement.<br />
Key machinery suppliers for manufacturing H&L Fasteners<br />
The Hi speed needle looms used for making H&L fasteners are mainly supplied by KY Taiwan and<br />
Mueller.<br />
Quality Standards<br />
The main quality standards applicable to hook and loop fasteners are:<br />
• IS-8156-1994<br />
• Oeko-Tex Standard 100 (Product Class II)<br />
• The following tests are performed on the product:<br />
• Peel Strength (Initial)<br />
• Peel Strength (After 5000 opening & closing)<br />
• Shear Strength (Initial)<br />
• Shear Strength (After 5000 opening & closing)<br />
• Dimensional Stability (Shrinkage %)<br />
• Width (mm)
• Colour Fastness to washing<br />
• Phenols, Forbidden AZO-colorants, Allergenic colorants<br />
• Colour Fastness, pH value, Formaldehyde, Extractable<br />
• Heavy Metals, Organo tin compounds, Odour test<br />
IS-8156-1994 standards and some tests like Forbidden AZO-colorants, colour fastness, Organo tin<br />
compounds and other tests as per requirement are conducted mainly at BITRA, TUV SUD South<br />
Asia, TEXANLAB, SGS India. Oeko-Tex standard 100 testing is performed at Forschungsinstitut<br />
Hohenstein in Bonnigheim. The approximate price <strong>of</strong> the above tests are:<br />
Test Approximate price<br />
(Rs. per sample)<br />
Peel Strength 750<br />
Shear Strength 750<br />
Dimensional Stability 150<br />
Colour Fastness 275<br />
Organo tin compounds 5000<br />
All tests for Oeko-Tex standard 100<br />
testing & Certification<br />
5000
Labels<br />
Label is a piece <strong>of</strong> material attached to an object to show its contents, ownership, use or destination.<br />
Labels are used in garments, home furnishing, stuffed toys, s<strong>of</strong>t luggage, shoes etc. Though<br />
manufacturers use different type <strong>of</strong> labels to create a distinct identity, labels in general can be<br />
classified into the following varieties:<br />
Type <strong>of</strong> label Purpose Typical Size<br />
Size label Shows the size <strong>of</strong> garment i.e. small (S), medium<br />
(M), large (L), extra large (XL) etc.<br />
12mm x 25mm<br />
Pocket label Label stitched on to the pocket Width ranging from 15mm to<br />
30mm<br />
Main label Contains information like Brand name and Logo Width ranging from 16mm to<br />
50 mm ; may go up to 100<br />
mm<br />
Wash care label Contains the washing instructions for the garment. Width ranging from 25mm to<br />
40mm<br />
Product Characteristics<br />
There are two primary categories <strong>of</strong> labels – Printed and Woven. Printed labels are <strong>of</strong>ten printed on<br />
materials such as satin, acetate, polyester, nylon and cotton twill. These labels are available in a<br />
variety <strong>of</strong> sizes, colours, and printing options. Woven Labels also available in a variety <strong>of</strong> finishes and<br />
fabric choices i.e. damask, semi-damask, satin, and taffeta.<br />
Labels have major application in garments where the labels are expected to have smooth feel and<br />
durability to regular wear and washing as well as they should not snag. Printed labels though<br />
inexpensive, are unable to withstand the standard wear. These labels fade either through washing or as<br />
a result <strong>of</strong> skin oils reacting with the print which reduces the branding aspect <strong>of</strong> the label.<br />
On the other hand, woven labels have better durability to regular wearing and cleanings. Amongst the<br />
variety <strong>of</strong> woven labels damask and damask mixed fabrics are the most reliable and comfortable<br />
labels. Damask is a tighter weave fabric that remains s<strong>of</strong>t even with finished edges and provides the<br />
best finish with a smoothness that reflects style and comfort and thus, is the most preferred amongst<br />
quality conscious customers. Semi-damask has many qualities <strong>of</strong> damask at a slightly lower price<br />
point and hence, is a mid line choice when it comes to labels. Satin is the most popular choice but the<br />
fabric is thin and can snag easily. Taffeta is stiffer than satin and can stand up to a bit more snagging.<br />
However, with both satin and taffeta the finished edges <strong>of</strong> the labels can be stiff, leading to a prickly<br />
feeling.
Clothing labels come in a variety <strong>of</strong> styles. The product is available in the following formats:<br />
• Continuous tape in Roll Form<br />
• Cut Seal<br />
• Cut Fold in End fold, Centrefold and Mitre fold<br />
• Filled / Stuffed labels<br />
• Die-cut / Laser cut labels<br />
• Ready-to –stick labels (backside double adhesive tape)<br />
Market dynamics and key growth drivers<br />
The demand for labels is majorly governed by the demand <strong>of</strong> Apparel, home furnishing, stuffed toys<br />
and s<strong>of</strong>t luggage. Thus, the primary growth driver for the labels is the sale <strong>of</strong> these products.<br />
Per capita disposable income <strong>of</strong> Indians during 2002 to 2007 has surged at a CAGR <strong>of</strong> nearly 14%<br />
leading to increase in consumerism. Moreover, the mushrooming <strong>of</strong> shopping malls has also worked<br />
in favour resulting in growth <strong>of</strong> various consumer products. India’s total garment production in<br />
FY2006 was estimated at 7.85 billion pieces; the domestic clothing <strong>consumption</strong> registered a 5-year<br />
CAGR <strong>of</strong> 6% (Source: ICRA <strong>Industry</strong> Comment – Textiles & Clothing). Like<strong>wise</strong>, the domestic<br />
<strong>consumption</strong> <strong>of</strong> home furnishing has also registered a growth <strong>of</strong> 6%. The stuffed toys market and s<strong>of</strong>t<br />
luggage market has also seen an upsurge. <strong>Industry</strong> estimates suggest that the stuffed toys is growing at<br />
over 25 per cent annually whereas the s<strong>of</strong>t luggage market is expected to grow at 20%. Since labels<br />
play an important role in the marketing <strong>of</strong> these products, <strong>consumption</strong> <strong>of</strong> labels is expected to grow<br />
in line with the growth in these sectors.<br />
Market size <strong>of</strong> labels and future forecast<br />
Apparels including hosiery garments and home furnishing sectors account for 80 – 85% <strong>of</strong> the<br />
<strong>consumption</strong> <strong>of</strong> labels. The number <strong>of</strong> labels per garment/home furnishing varies from one to four.<br />
Considering the label requirement <strong>of</strong> various product categories i.e. shirts, trousers, uniforms, inner<br />
wear, children wear, skirts, t-shirts, bed sheet, towel etc. the average <strong>consumption</strong> <strong>of</strong> label per product<br />
is computed as 1.5 labels/garment and 1 label per home furnishing product. The average price per<br />
label is around 55 - 60 paise.<br />
Usage <strong>of</strong> labels in Apparel<br />
Particulars<br />
Average label per garment 1.6<br />
Average label per home furnishing product 1
Average price <strong>of</strong> a label Rs 0.55<br />
Average price <strong>of</strong> the big fancy label Rs 5<br />
In addition, labels are also used for shoes, s<strong>of</strong>t toys, luggage, etc. The usage <strong>of</strong> labels in these<br />
applications is around 20% <strong>of</strong> the total usage.<br />
Current Market size and future potential<br />
The current and future forecast <strong>of</strong> labels domestic usage is given below:<br />
Market size for labels 2007-08 2012-13<br />
Quantity 18560 million pcs 24840 million pcs<br />
Value Rs 1280 crore Rs 1710 crore<br />
Source: <strong>Industry</strong> survey, IMaCS Analysis<br />
The domestic market size for labels is estimated at 18560 million pieces valued at Rs. 1280 crore.<br />
Since apparel and home furnishing account for majority <strong>of</strong> the <strong>consumption</strong> <strong>of</strong> labels, the market for<br />
labels is expected to grow in line with the growth in production <strong>of</strong> these products. The market for<br />
labels is expected to increase to 24840 million pieces by 2012 – 2013 registering a growth rate <strong>of</strong> 6%<br />
year-on-year. The market potential in 2012 – 2013 is estimated at Rs. 1710 crore. No inflationary<br />
increase has been assumed to determine the market size.<br />
Key manufacturers <strong>of</strong> labels<br />
Indian Woven-labels industry has around 500 looms that are concentrated in the several cities like<br />
Bangalore (75), Delhi (200), Tirupur (50), Mumbai (30-35), Ahmedabad (50-55), Kolkata and other<br />
cities <strong>of</strong> North and North-east.<br />
Unique Tags is one <strong>of</strong> the key manufacturers <strong>of</strong> labels; the company manufactured around 25 lakh<br />
woven labels in 2005-06 with value <strong>of</strong> Rs 13.5 crore. Black Label Fashions Ltd is another player<br />
selling over 5 crore labels with revenues <strong>of</strong> over Rs 15 crore. Few other manufacturers <strong>of</strong> labels are:<br />
Manufacturer Year Quantity Value<br />
Price<br />
Installed<br />
(million pieces) (Rs crore) (Rs per unit) capacity<br />
Uniroyal Ind 2007-08 163 7.82 0.47 602880 sq m<br />
Premco Global 2006-07 4.21 0.22 0.52 60.6 million pc<br />
Arex Inds. 2006-07 215.38 14.18 0.66 10966 MPM*<br />
Arrow Webtex<br />
(Woven)<br />
2006-07 99.28 4.49 0.45 15 looms<br />
Arrow Webtex<br />
(Printed)<br />
2006-07 73.47 3.27 0.44 7 <strong>of</strong>fset machines
Gopala Polyplast 2006-07 NA 22.95 NA 12 looms<br />
Narain Labels NA NA NA 2 lac pcs per day<br />
Gokaldas Exports In-house use NA NA NA 1 lac pcs per day<br />
Source: Capitaline, Company Annual Reports, Company websites, <strong>Industry</strong> Survey<br />
*Million picks in mts<br />
Apart from these there are many small players with an installed capacity <strong>of</strong> one or two looms each<br />
Imports & Exports <strong>of</strong> labels<br />
The estimated import figures for labels are as given below:-<br />
HS Code Description<br />
58071010/20/90, 58079010/90,<br />
58011000, 58061000,<br />
58063190/990, 58081090,<br />
58089010/40/90, 59019090<br />
96063090/2990,<br />
96071110/910/990, 94069990<br />
Labels<br />
Labels<br />
Imports Imports<br />
Quantity (in Rs crore)<br />
2007-08(E) 2007-08(E)<br />
Approx. 1190<br />
million pieces<br />
~ Rs 85 crore<br />
Approx 0.5<br />
~ Rs 0.07 crore<br />
million pieces<br />
Source: IBIS, DGCIS, IMaCS Analysis<br />
Over 70% <strong>of</strong> all the imports take place from Hong Kong; China is the next highest contributor with<br />
around 10% share. Some quantity <strong>of</strong> labels is also imported from Italy, Taiwan, Germany, Turkey,<br />
France, USA, UK, Portugal and Switzerland<br />
The estimated export figures for labels are as given below:-<br />
HS Code<br />
58071010/20/90, 58079010/90,<br />
58089090, 58041090, 58109290,<br />
58012290, 58090090<br />
62171010/90, 62179090,<br />
63071010/90, 63079013/19,<br />
63079090/2090*<br />
90014090, 90029000, 90148090,<br />
95029100/900, 95051000, 96020090,<br />
96063090, 96089990<br />
Descript<br />
ion<br />
Labels<br />
Labels<br />
Labels<br />
Exports Exports<br />
Quantity (in Rs crore)<br />
2007-08(E) 2007-08(E)<br />
Approx. 170<br />
million pieces<br />
Approx 5<br />
million pieces<br />
Aprrox 0.5<br />
million pcs<br />
~ Rs 25 crore<br />
~ Rs 1.5 crore<br />
~ Rs 0.15 crore<br />
Source: IBIS, DGCIS, IMaCS Analysis<br />
* HS Codes for only main products covering over 99% <strong>of</strong> exports are shown here<br />
Sri Lanka and Bangladesh have the highest share <strong>of</strong> around 30% each in Indian label exports. Exports<br />
to UK are around 10% <strong>of</strong> the total exports. Other countries which have significant share in Indian<br />
exports are China (around 5%), Germany, UAE, Pakistan, Thailand, Kenya, Turkey and Tanzania.<br />
These exports are estimated to be Rs 37.9 (~38) crore for the year 2012-13.<br />
Raw materials
Printed labels are <strong>of</strong>ten printed on materials such as satin, acetate, polyester, nylon and cotton twill.<br />
Woven labels are manufactured on Air-Jet Weaving Looms and Rapier Weaving Looms. For<br />
polyester labels the warp yarn is supplied by international players like Global Pacific whereas weft<br />
yarn is supplied by various domestic players like Reliance, JK Textile, Valson, Welspun, Tirupati, etc.<br />
Key machinery suppliers for manufacturing flex in India<br />
The machines used for manufacturing Woven labels are:<br />
• Flexible Rapier Weaving Machines equipped with electronic jacquard<br />
• Needle Looms<br />
• Warping machines<br />
• MuCAD designing systems.<br />
• Ultrasonic slitting machine.<br />
• Cutfold machines<br />
• Laser cutting machine<br />
• Label finishing machine<br />
• Label stuffing devices<br />
The main suppliers <strong>of</strong> these machines are<br />
• Jakob-Mueller (Switzerland)<br />
• Kong River (Hong Kong)<br />
• Willy (Italy)<br />
• Viable (USA)<br />
• AG Frick<br />
Printed labels are made using the screen printing or <strong>of</strong>fset printing technology. Machines used for<br />
Printed labels are:<br />
• Flexo Fabric Printing Machines<br />
• Letter Press Machines<br />
• Sonic Cutting Machines<br />
• Cold Cut Machines<br />
• Hot Cut Machines<br />
Quality Control and Standards<br />
Quality standards for labels depend on specific buyer requirements since different buyers have their<br />
own standards related to product, environment, social etc. However, wash fastness test and
dimensional stability test are usually carried out for all labels. Another commonly followed standard<br />
is Oeko-Tex Standard 100.
Umbrella Fabric<br />
Umbrella fabric is a medium weight, plain weave taffeta fabric used for manufacturing Umbrellas.<br />
Umbrellas are used primarily in rainy seasons. They are also used for protection against Sun however<br />
such usage is majorly in regions which encounter extreme sunshine especially the regions close to the<br />
equator. Earlier umbrellas were manufactured using cotton fabric coated with waterpro<strong>of</strong>ing agent.<br />
With advent and extensive usage <strong>of</strong> synthetic material the umbrella fabric used these days is polyester<br />
and nylon taffeta fabric.<br />
Product characteristics<br />
Umbrella fabric is made <strong>of</strong> polyester filament yarn or nylon filament yarn in varying constructions i.e.<br />
150T, 160T and 190T where T indicates the thread density. The umbrella fabric is expected to be<br />
water-pro<strong>of</strong> for the rainy season, should maintain physical form during extreme ultraviolet exposure<br />
in the summer season, and should have high tear resistance and high abrasion resistance. The GSM <strong>of</strong><br />
umbrella fabric typically ranges from 110 to 280 based on type <strong>of</strong> umbrella.<br />
Market dynamics and key growth drivers<br />
The demand for umbrellas depends upon climatic conditions, population, usage <strong>of</strong> umbrella for<br />
advertisement and social outlook. The umbrella market generally grows slowly due to reuse <strong>of</strong> old<br />
umbrellas however the market has seen a spurt due to usage <strong>of</strong> umbrella in advertisement and<br />
promotional activity by Corporates. Umbrellas for kids with fancy and contemporary designs are also<br />
a growing market. The demand for umbrella is expected to grow at 7-10% over the next five years.<br />
(Source: Ministry <strong>of</strong> Micro, Small and Medium Enterprises).<br />
Market size <strong>of</strong> umbrella fabric and future forecast<br />
The polyester and nylon taffeta fabric is primarily used for umbrella manufacture. <strong>Industry</strong> survey<br />
revealed that umbrella taffeta fabric is still not manufactured in India and is imported. The other usage<br />
<strong>of</strong> taffeta fabric is for some garment application and wind cheater manufacture.<br />
The umbrella market in India is estimated to be 11 million pieces. The complete requirement for<br />
umbrella fabric is fulfilled through imports. In FY 2007-08 approximately 7 million dozens <strong>of</strong> cut<br />
umbrella straps in size ranging from 17” x 8” to 24” x 8” were imported. This translates into<br />
approximately 9 million square meters <strong>of</strong> umbrella cloth. Thus, the market for umbrella fabric is<br />
estimated to be 9 million square meters valued at Rs.80 crore. With umbrella being a necessity in<br />
certain regions due to climatic condition, the increase in population as well as the increase in use <strong>of</strong><br />
umbrella in corporate promotional activity the market for umbrella fabric is expected to increase at<br />
9% year on year, in line with increase in demand for umbrellas. Hence, the demand for umbrella
fabric is expected to increase to 14 million square meters by 2012 –13. The market potential in 2012-<br />
13 is estimated at Rs 120 crore. No change (upwards or downwards) in the price <strong>of</strong> umbrella fabric<br />
has been assumed for deriving the projected market size.<br />
The current and future forecast <strong>of</strong> umbrella fabric market is given below:<br />
<strong>Domestic</strong> umbrella fabric<br />
<strong>consumption</strong><br />
2007-08 2012-13<br />
Quantity ~9 million sq m ~14 million sq m<br />
Value Rs 80 crore Rs 120 crore<br />
Key manufacturers <strong>of</strong> umbrella<br />
Source: <strong>Industry</strong> survey, IMaCS Analysis<br />
Umbrella manufacturing is concentrated in small scale sector with few players in the organised sector.<br />
The key manufacturers <strong>of</strong> umbrella are given below:<br />
• Ebrahim Currim and Sons., Mumbai<br />
• Kwality Umbrella Manufacturing Co., Mumbai<br />
• Metro Umbrella Industries, Mumbai<br />
• Guru Nanak Industries, New Delhi<br />
• Village Kraft, Orissa<br />
Imports & Exports <strong>of</strong> umbrella fabric<br />
The entire umbrella fabric requirement is met through imports. Around 80% the imports are from<br />
China. Nearly 82 million umbrella fabric pieces <strong>of</strong> varieties ranging from 150T to 200T were<br />
imported in FY08.<br />
HS Code Description<br />
63079090<br />
Raw-materials and machinery<br />
UMBRELLA COMPONENTS /<br />
STRAPS CUT TO SIZE<br />
Imports Imports<br />
(in Rs crore)<br />
2007-08(E) 2007-08(E)<br />
Around 9<br />
~ Rs 80 crore<br />
million sq m<br />
Source: IBIS, IMaCS Analysis<br />
Taffeta fabric used as umbrella fabric is manufactured on shuttle looms as well as shuttle less looms.<br />
The basic raw material used is Nylon or Polyester filament yarn generally 70 denier.<br />
Quality Control and Standards<br />
The requirements for complete umbrella are prescribed in IS: 2920/1964.
Sewing threads<br />
Sewing thread is a ply or cabled yarn used for stitching <strong>of</strong> apparels, hosiery, embroidery, footwear,<br />
leather goods, quilted mattresses, sports goods, saddlery & harness, industrial Gloves, automotive<br />
seats/seat belts, upholstery, parachutes, sails, tents, etc.<br />
Product characteristics<br />
Sewing threads are made <strong>of</strong> natural fibres like cotton, silk or artificial fibres like Nylon, Polyester or<br />
their blends. An ideal sewing thread should confirm to a high standard <strong>of</strong> single thread strength,<br />
perfectly balanced twist and colour fastness. It should be free from yarn defects like knots, cuts,<br />
snarling, twist subs etc. The sewing threads are available in different counts ranging from 18 Tex to<br />
240 Tex. The usage <strong>of</strong> sewing thread based on end application is given below:<br />
Garments<br />
Application<br />
Approximate fabric<br />
GSM<br />
Extra light < 135<br />
Light 135 - 205<br />
Medium 205 - 270<br />
Heavy 270 - 408<br />
Extra Heavy<br />
Weight<br />
408 & above<br />
Tex Size<br />
Average Strength<br />
(gms)<br />
18<br />
21<br />
850<br />
24 1050<br />
30 1250<br />
40 1850<br />
60 2950<br />
80 3550<br />
105 4450<br />
120 5500<br />
120 5500<br />
150 7400<br />
180 9800<br />
220 10500<br />
Application Tex Application Tex<br />
Premium leather 60,40,20 Mattress and quilting 60,40<br />
Economy leather 60,40,20 Saddlery 25,15<br />
Canvas 60,40,20 Outdoor application 40,20,15<br />
Sole stitching 8, 7 Filter cloth 40<br />
Apparels (leather) 75,50,36 Compressor winding 8<br />
Accessories(leather) 75,50,36 Curtain and tents 40<br />
Automotive upholstery 60,40,20 Book binding 15<br />
S<strong>of</strong>t luggage 40,30,20<br />
Market dynamics and key growth drivers<br />
Source: <strong>Industry</strong> survey
Sewing thread being a key component in the stitching, the demand for sewing thread is derived from<br />
various end applications such as apparel, hosiery, embroidery, footwear, leather goods and many other<br />
industrial goods. The demand from apparels and hosiery are the key segments as they contribute to<br />
more than 50% <strong>of</strong> the market for sewing threads. Price and product availability are important criteria<br />
for majority <strong>of</strong> the applications.<br />
Market size <strong>of</strong> Sewing threads and future forecast<br />
Sewing threads are majorly used in the stitching <strong>of</strong> garments both readymade and tailor made, hosiery<br />
garments, footwear as well as mechanical closing <strong>of</strong> bags. The <strong>consumption</strong> <strong>of</strong> thread depends on the<br />
end application and the type <strong>of</strong> stitch. The average <strong>consumption</strong> <strong>of</strong> sewing thread is given below:<br />
Usage <strong>of</strong> sewing threads<br />
Article Average <strong>consumption</strong> <strong>of</strong><br />
sewing thread<br />
Garments/apparels 120 meter per piece<br />
Hosiery 50 meter per piece<br />
Footwear 35 meter per piece<br />
HDPE and jute bags 4 – 5 meter per piece<br />
Besides this, sewing threads are also used in stitching <strong>of</strong> leather products and tarpaulins, kite flying,<br />
umbrella stitching, book binging, fish net manufacture and other industrial uses. As per industry<br />
sources, these application areas account for 25 -30% <strong>of</strong> <strong>consumption</strong> <strong>of</strong> sewing threads.<br />
The current and future forecast <strong>of</strong> sewing thread <strong>consumption</strong> is given below:-<br />
Sewing threads domestic usage 2007-08 2012-13<br />
Quantity 130,000 MT 191,000 MT<br />
Value Rs 3,900 crore Rs 5,730 crore<br />
Source: <strong>Industry</strong> survey, IMaCS Analysis<br />
The market size for sewing thread is estimated at 130,000 MT valued at Rs.3900 crore. The demand<br />
for sewing threads is expected to increase to 191,000 MT by 2012-13 registering a growth <strong>of</strong> 8% year<br />
on year. In 2012-13 the market potential is estimated at Rs.5730 crore. An inflationary increase <strong>of</strong> 5%<br />
is considered to estimate the market potential.<br />
Key manufacturers <strong>of</strong> sewing threads<br />
The key manufacturers <strong>of</strong> Sewing threads in the organised sector are Madura Coats, Mahavir<br />
Spinning Mills (Vardhman Threads) and Precot Meridian.
Madura Coats Ltd (MCL), a subsidiary <strong>of</strong> Coats Viyella Plc, UK is a market leader in sewing and<br />
embroidery thread with 50% market share in the organised sector. MCL supplies its products to<br />
clients such as Clairborne, Lee, Levis, Gap, Nike, Adidas, Tommy Hilfiger, among others. In 2007 –<br />
08 the company had an approximate sales volume <strong>of</strong> 50 million Common Length Unit (CLU) (43<br />
million CLU in domestic and 7 million CLU in export) (One CLU = 10,000 metres).<br />
Mahavir Spinning Mills Ltd (MSML) has two subsidiaries namely VMT Spinning (73.33%) and<br />
Vardhman Threads (100%). Vardhman is the second largest producer <strong>of</strong> sewing thread in the country<br />
with production <strong>of</strong> 28.3 MT per day. The sewing thread plants are located at Hoshiarpur, Baddi,<br />
Perundarai and Ludhiana. Two-third <strong>of</strong> the sewing threads <strong>of</strong> the company have synthetic base and<br />
the remaining are made <strong>of</strong> cotton.<br />
The sewing thread market is dominated by the unorganised sector i.e. the rewinding mills which are<br />
concentrated in the cities <strong>of</strong> Mumbai, Nagpur, Amaravati, Pune and Sholapur, Ahmedabad, Kolkata,<br />
Chennai, Tuticorin, Cochin, Coimbatore, Bangalore, Hyderabad, etc.<br />
Manufacturer Year Quantity Value Unit Price Installed<br />
capacity<br />
Madura Coats 2001-02 371.173 billion Rs 467.23<br />
metres crore<br />
Mahavir Spinning 2006-07 8,851 MT Rs 296.35 Rs 335/kg 9,767 MT<br />
Mills / vardhaman<br />
crore<br />
Precot Meridian 2007-08 Rs 54 crore 2,000 MT<br />
Pasupati Spinning<br />
& Weaving Mills<br />
2006-07 5,096 MT Rs 83.66 crore<br />
Malwa Cotton 2006-07 3,995 MT Rs 122.83<br />
Spinning Mills<br />
crore<br />
Source: Capitaline, Annual reports, IMaCS Analysis<br />
Imports & Exports <strong>of</strong> Sewing thread<br />
The sewing threads are exported to more than 45 countries. The export value is estimated to be Rs 140<br />
crore in 2007-08.<br />
HS Code Description<br />
Exports<br />
(in Rs crore)<br />
Exports (Quantity MT)<br />
2006-07 2007-08(E) 2006-07 2007-08(E)
52041110 COTON THREAD, SEWING,<br />
CONTNG ANY<br />
SYNTHETICSTAPLE FIBRE 35 3 1611 222<br />
52041120 COTTON THREAD,DARNING 0.4 0.8 20 65<br />
52041130 EMBROIDERY COTTON<br />
THREAD 4.5 0.3 184 15<br />
52041140 COTON SEWING THREAD NOT<br />
CNTNG ANY SYNTHETIC<br />
STAPLE FIBRE 2.3 1.5 144 137<br />
52041190 OTHERS 48 51 3840 4544<br />
52041900 SWNG THRD CONTNG LESS<br />
THN 85% BY WEIGHT<br />
OFCOTTON NOT PUT UP FOR<br />
RETAIL SALE 3 2.5 215 119<br />
52042010 COTON THREAD,SEWING,<br />
CNTNG ANY SYNTHETIC<br />
STAPLE FIBRE 13 10 485 400<br />
52042020 COTTON THREAD,DARNING 0.0 0.1 1 3<br />
52042030 EMBROIDERY COTTON<br />
THREAD 0.2 0.9 7 32<br />
52042040 COTON SEWING THREAD NOT<br />
CNTNG ANY SYNTHETIC<br />
STAPLE FIBRE 20 19 950 810<br />
52042090 OTHER COTTON SEWING<br />
THREAD 2 2 90 100<br />
54011000 SEWING THRED OF<br />
SYNTHETIC FILAMENTS 30 46 1535 2275<br />
54012000 SEWING THREAD OF<br />
ARTIFICIAL FILAMENTS 3 3 115 120<br />
Total<br />
Exports 162 140 9200 8845<br />
Source: DGCIS, IMaCS Analysis<br />
The imports <strong>of</strong> sewing threads are dominated by Specialty threads like threads for manufacturing seat<br />
belts, automotive seat covers etc.<br />
HS Code Description Imports (in Rs crore) Imports (Quantity MT)<br />
2006-07 2007-08(E) 2006-07 2007-08(E)<br />
52041110 COTON THREAD, SEWING,<br />
CONTNG ANY<br />
SYNTHETICSTAPLE FIBRE 0.1 0.3 2 3<br />
52041120 COTTON THREAD,DARNING 0.2 9<br />
52041130 EMBROIDERY COTTON<br />
THREAD 0.2 0.2 3 5
HS Code Description Imports (in Rs crore) Imports (Quantity MT)<br />
2006-07 2007-08(E) 2006-07 2007-08(E)<br />
52041140 COTON SEWING THREAD NOT<br />
CNTNG ANY SYNTHETIC<br />
STAPLE FIBRE 0.3 0.2 22<br />
52041190 OTHERS 0.9 0.6 32 20<br />
52041900 SWNG THRD CONTNG LESS<br />
THN 85% BY WEIGHT<br />
OFCOTTON NOT PUT UP FOR<br />
RETAIL SALE 1 2 22 50<br />
52042010 COTON THREAD,SEWING,<br />
CNTNG ANY SYNTHETIC<br />
STAPLE FIBRE 0.7 80 0.1<br />
52042030 EMBROIDERY COTTON<br />
THREAD 1 0.3 22 19<br />
52042040 COTON SEWING THREAD NOT<br />
CNTNG ANY SYNTHETIC<br />
STAPLE FIBRE 0.1 0 1 0.00<br />
52042090 OTHER COTTON SEWING<br />
THREAD 1.4 0.5 50 32<br />
54011000 SEWING THRED OF SYNTHETIC<br />
FILAMENTS 15 20 613 651<br />
54012000 SEWING THREAD OF<br />
ARTIFICIAL FILAMENTS 9.4 26 393 1050<br />
Total Imports 30 50 1220 1860<br />
Source: DGCIS, IMaCS Analysis<br />
These exports are estimated to be Rs 225.5 crore for the year 2012-13.<br />
Quality Control and standards in India / other countries<br />
The relevant BIS standards are: IS 1066: 1980, IS 1376: 1998, IS 1720: 1978, IS 2196: 1985, IS 4229:<br />
1992 , IS 9543: 1980.
HOMETECH<br />
The Hometech segment <strong>of</strong> <strong>technical</strong> <strong>textiles</strong> comprises <strong>of</strong> the textile components used in household<br />
applications. These products range from blinds used in the houses to the filter products used in the<br />
vacuum cleaners. They are an important component in the mattress and pillows as well. They are<br />
made <strong>of</strong> both natural and synthetic fibres. For example, carpet backing cloth is made from jute as well<br />
synthetic fibres.<br />
The <strong>technical</strong> textile products covered under Hometech are as give below:-<br />
• Fiberfil<br />
• Mattress and pillow components<br />
• Carpet backing Cloth (Jute & Synthetic)<br />
• Stuff Toys<br />
• Blinds<br />
• HVAC Filters<br />
• Filter cloth for vacuum cleaners<br />
• Nonwoven wipes<br />
• Mosquito nets<br />
Technical <strong>textiles</strong> <strong>consumption</strong> under Hometech is estimated at around Rs 3,200 crore in 2007-08.<br />
Fiberfil and pillow and mattress components together constitute over 50% <strong>of</strong> the <strong>technical</strong> textile<br />
usage under the Hometech segment followed by blinds with a share <strong>of</strong> around 20%, stuffed toys with<br />
a share <strong>of</strong> 13% and carpet backing cloth with around 9% share. The HVAC and vacuum filter fabrics<br />
and non woven wipes segments are very small and constitute less than 1% <strong>of</strong> the total Hometech<br />
segment.<br />
Most <strong>of</strong> the demand for these products is satisfied by domestic production with imports <strong>of</strong> only<br />
around Rs 50 crore. But, in certain segments like nonwoven wipes, the percentage <strong>of</strong> imports is very<br />
high and the domestic production is low. Exports <strong>of</strong> Hometech products from India are very low<br />
except Fiberfil <strong>of</strong> which around 10% <strong>of</strong> the domestic <strong>consumption</strong> is exported. The exports <strong>of</strong> all the<br />
other products (excluding Fiberfil) are less than Rs 10 crore.<br />
The domestic <strong>consumption</strong> <strong>of</strong> <strong>technical</strong> <strong>textiles</strong> under Hometech is expected to increase from around<br />
Rs 3,191 crore in 2007-08 to around Rs 5,300 crore by 2012-13. The demand for the hometech<br />
products depends on the growth <strong>of</strong> the disposable incomes. In the medium term (next 5 years), the<br />
hometech segment is expected to achieve growth at the rate <strong>of</strong> almost 11% year on year.
The stuffed toys segment is expected to grow at around 20% y-o-y over the next 5 years. The HVAC<br />
filters are another segment which is expected to have a growth <strong>of</strong> over 20% y-o-y. With the increase<br />
in commercial infrastructure (<strong>of</strong>fice buildings) and the real estate development the <strong>consumption</strong> <strong>of</strong><br />
blinds is also expected to increase drastically.<br />
Non-woven wipes is one <strong>of</strong> the key applications <strong>of</strong> non-wovens in Hometech segment. Though the<br />
market for non-woven wipes is quite small, the segment has high growth potential over the next 5<br />
years. The market for nonwoven wipes is estimated at 1.8 million square meters valued at Rs 10 crore<br />
and is expected to double over the next 5 years.<br />
Fiberfil and carpet backing fabrics are fairly well developed segments in India. Most <strong>of</strong> the production<br />
<strong>of</strong> these products takes place in India with negligible imports. Hence, these products are not expected<br />
to grow substantially (a stable growth rate <strong>of</strong> around 5% expected).<br />
Summary <strong>of</strong> the market-sizing for Hometech<br />
Fiberfil<br />
Carpet<br />
backing<br />
Cloth (Jute<br />
& Synthetic)<br />
Stuffed toys<br />
Blinds<br />
HVAC<br />
Filters<br />
Production Imports Exports<br />
2007-08 2012-13<br />
<strong>Domestic</strong><br />
Consumption<br />
<strong>Domestic</strong><br />
Consumption<br />
Quantity 120,400 MT 500 MT 10,950 MT 109,950 MT 140,300 MT<br />
Value Rs 720<br />
crore<br />
Quantity 145 million<br />
sq m<br />
Value Rs 280<br />
crore<br />
Quantity 55 million<br />
pieces<br />
Value Rs 416<br />
crore<br />
Quantity<br />
Value<br />
Quantity<br />
Rs 2 crore Rs 60 crore Rs 660 crore Rs 840 crore<br />
2.5 million<br />
sq m<br />
Rs 5.5<br />
crore<br />
5 million<br />
pieces<br />
Rs 5.5<br />
crore<br />
0.6 million<br />
sq meters*<br />
0.3 million<br />
sq m<br />
Rs 1.5<br />
crore<br />
0.2 million<br />
pieces<br />
Rs 1.5<br />
crore<br />
0.05<br />
million sq<br />
meters<br />
145 million<br />
sq m<br />
180 million<br />
sq m<br />
Rs 285 crore Rs 360 crore<br />
60 million<br />
pieces<br />
Rs 420 crore<br />
30 million sq<br />
meters<br />
Rs 9 crore* Rs 4 crore Rs 630 crore<br />
1 million<br />
square<br />
meters<br />
1.5 million<br />
square meters<br />
120 million<br />
pieces<br />
Rs 1050<br />
crore<br />
60 million sq<br />
meters<br />
Rs 1270<br />
crore<br />
3.5 million<br />
square<br />
meters<br />
Export<br />
Potential<br />
Rs 76.6<br />
crore<br />
Rs 1.5<br />
crore<br />
Rs 1.5<br />
crore<br />
Rs 4.6<br />
crore
Mattress and<br />
pillow<br />
components<br />
Nonwoven<br />
wipes @<br />
Filter fabrics<br />
for vacuum<br />
cleaners<br />
Mosquito<br />
nets<br />
TOTAL<br />
Value<br />
Quantity<br />
Production Imports Exports<br />
270 million<br />
square<br />
meters<br />
Value Rs 945<br />
crore<br />
Quantity<br />
Value<br />
Quantity<br />
Rs 12<br />
crore $<br />
9500<br />
square<br />
meters<br />
Rs 0.3<br />
crore<br />
2007-08 2012-13<br />
<strong>Domestic</strong><br />
Consumption<br />
<strong>Domestic</strong><br />
Consumption<br />
- Rs 16 crore Rs 45 crore<br />
1.5 lakh<br />
square<br />
meters<br />
Rs 1.2<br />
crore<br />
-<br />
270 million<br />
square meters<br />
Rs 945 crore<br />
1.8 million<br />
square meters<br />
310 million<br />
square<br />
meters<br />
Rs 1350<br />
crore<br />
3.5 million<br />
square<br />
meters<br />
Rs 2 crore Rs 8 crore - Rs. 10 crore Rs. 20 crore<br />
33,800<br />
square<br />
metres<br />
Value Rs 0.35<br />
crore<br />
Quantity<br />
Value Rs 225<br />
crore<br />
Value Rs 2,584<br />
crore<br />
0.75<br />
million<br />
nos.<br />
Rs 7.5<br />
crore<br />
Rs 50<br />
crore<br />
-<br />
33,800<br />
square metres<br />
62,280<br />
square<br />
metres<br />
- Rs 0.35 crore Rs 0.80 crore<br />
0.12<br />
million<br />
nos.<br />
Rs 3.5<br />
crore<br />
Rs 72 crore<br />
90 million<br />
meters<br />
145 million<br />
meters<br />
Rs 225 crore Rs 364 crore<br />
Rs 3,191<br />
crore<br />
Rs 5,300<br />
crore<br />
* In addition, coated fabric are imported and fabricated into blinds in India<br />
$ This includes filter media used for filter applications other than that <strong>of</strong> HVAC filters<br />
@ In addition non woven fabric is imported and converted into wipes in India.<br />
As per ECTT report, the potential market sizing for 2007-08 was as given below:-<br />
Market size<br />
(ECTT report)<br />
Fiberfil<br />
2001-02 2007-08 (P)<br />
Quantity 48000 T 95,000 T<br />
Value Rs 288 crore Rs 570 crore<br />
Export<br />
Potential<br />
-<br />
Rs 3<br />
crore<br />
-<br />
-<br />
Rs 4.1<br />
crore<br />
Rs 92<br />
crore
Market size<br />
(ECTT report)<br />
Jute carpet backing<br />
cloth<br />
Stuffed toys<br />
Blinds<br />
2001-02 2007-08 (P)<br />
Quantity 2900 MT 13,900 MT<br />
Value Rs 9.86 crore Rs 41.7 crore<br />
Quantity<br />
Value Rs.60 crore Rs.96 crore<br />
Quantity<br />
Value Rs. 400 crore Rs. 1190 crore<br />
TOTAL Value Rs. 757.86 crore Rs. 1897.7 crore<br />
Capital Employed and Pr<strong>of</strong>itability <strong>of</strong> key players <strong>of</strong> Hometech<br />
Company Name<br />
Capital Employed<br />
(Rs crore)<br />
Net Pr<strong>of</strong>it Margin<br />
(%)<br />
2006-07 2007-08 2006-07 2007-08<br />
Arora Fibres Ltd. 12.0 6.4 2.6% -34.7%<br />
Auckland International Ltd. 12.0 14.2 0.6% 2.5%<br />
Birla Corporation Ltd. 788.7 1100.8 18.0% 19.5%<br />
Ganesh Polytex Ltd. 37.6 58.5 3.1% 3.5%<br />
Ginni Filaments Ltd. 377.5 398.1 1.1% -5.6%<br />
Gloster Jute Mills Ltd. 58.4 61.9 3.2% 6.9%<br />
Hanung Toys & Textiles Ltd. 240.7 360.4 9.9% 12.0%<br />
Kurlon Ltd. 58.4 76.9 3.5% 2.6%<br />
Ludlow Jute & Specialities Ltd. 18.7 24.8 1.1% 1.8%<br />
Prabartak Jute Mills Ltd. 3.8 5.4 0.4% 0.5%<br />
Responsive Industries Ltd. 156.9 179.3 11.0% 10.0%<br />
Shri Dinesh Mills Ltd. 91.0 95.5 12.2% 8.4%<br />
Source: Prowess Database, IMaCS Analysis<br />
Hometech segment <strong>of</strong> <strong>technical</strong> <strong>textiles</strong> is estimated to provide employment to 1.2 lakh people 20 <strong>of</strong><br />
whom number <strong>of</strong> <strong>technical</strong> 21 employees is estimated at 75,000 and number <strong>of</strong> non-<strong>technical</strong><br />
employees is estimated at 45,000.<br />
20 Employment has been estimated based on the analysis <strong>of</strong> primary and secondary data available for the<br />
<strong>technical</strong> textile manufacturers. IMaCS has made appropriate adjustments because <strong>of</strong> insufficient data.<br />
21 Technical includes managerial staff and skilled labour whereas non-<strong>technical</strong> includes unskilled labour.
The key impediments to growth <strong>of</strong> Hometech products are:-<br />
1. The acceptance <strong>of</strong> Fiberfil is low in India because the usage <strong>of</strong> traditional cotton fill is still<br />
prevalent on account <strong>of</strong> the lower level <strong>of</strong> awareness <strong>of</strong> the benefits <strong>of</strong> Fiberfil and higher cost<br />
2. The domestic jute carpet backing industry is facing stiff competition from synthetic carpet<br />
backing and cheaper jute imports from Bangladesh<br />
3. The domestic stuffed toys market consists <strong>of</strong> several small players as compared to Chinese<br />
counterparts who are contract manufacturers for US multinationals. In the export markets, the<br />
products manufactured by smaller Indian players do not conform to international standards.<br />
4. The Indian stuffed toys market is suffering from cheaper Chinese imports (dumping)<br />
5. Availability <strong>of</strong> cheaper imports for products like coated blinds<br />
6. Lack <strong>of</strong> awareness <strong>of</strong> benefits <strong>of</strong> non-woven products and non-availability <strong>of</strong> quality products<br />
at desired price points has resulted in lower demand for wipes
Fiberfil<br />
Fiberfil refers to Polyester Staple Fibres used as filling for pillows, decorative pillows, cushions,<br />
bolsters, quilts & & comforters, comforters, mattresses, mattress toppers, toppers, mattress mattress pads, sleeping bag bags, bag furniture<br />
cushions, furniture backs, insulated garments and s<strong>of</strong>t toys.<br />
Traditionally cotton cotton has has been been used as a a filling material material in India. Though with rapid development in<br />
synthetic fibre production technology special synthetic fibres have been developed as an alternative to<br />
cotton for filling purpose.<br />
Product characteristics<br />
Fiberfil is available available in deniers ranging ranging from from 2 to to 20 however the the most most common types types <strong>of</strong> Fiberfil used<br />
for stuffing purpose are 6 D and 15 D. The fibres are available in cut lengths <strong>of</strong> f 32mm, 40mm, 44mm,<br />
51mm, 64mm, 64mm, 76mm, 76mm, 88mm, 88mm, 108mm and and 128mm. However, the normal cut lengths used for filling<br />
are 32mm (for blow filling), 51mm and 64mm. Fiberfil can be classified based on the method <strong>of</strong><br />
production, cross section <strong>of</strong> the staple fibres, type <strong>of</strong> finishing etc.<br />
Classification <strong>of</strong> Fiberfil<br />
Based on<br />
Manufacturing<br />
Process<br />
•Virgin PSF<br />
•Regenerated PSF<br />
Based on Cross<br />
section<br />
•Hollow<br />
•Solid<br />
Virgin PSF PSF is is manufactured manufactured from from a a combination <strong>of</strong> Terypthalic Acid (PTA) and Monoethylene Glycol<br />
(MEG). The regenerated ated PSF is made by recycling polyester waste such as PET bottles and any other<br />
100% polyester scrap. Majority <strong>of</strong> the Fiberfil produced from recycled waste has solid tubular cross<br />
section whereas virgin PSF has a hollow core which gives a higher diameter for the same denier and<br />
hence higher bulk, particularly for filling end uses. As a result hollow PSF can give the same support<br />
level <strong>of</strong> recycled fibres with 15-20% 20% less filling quantity. Moreover the hollow PSF Fiberfil is more<br />
s<strong>of</strong>t and comfortable, does not t form form lumps, retains bulk bulk and shape after wash and is more durable.<br />
Siliconised PSF has more bounce than non siliconised type.<br />
Based on Finish<br />
•Siliconised<br />
•Non siliconised<br />
Conjugated Fiberfil is is another another kind <strong>of</strong> <strong>of</strong> product available which is a bi component component fibre with natural<br />
crimp (unlike other fibres which need need to to be be imparted crimps in the manufacturing process). PSF non<br />
siliconised Fiberfil with solid solid cross section section is the most widely used type in the Indian market. Fiberfil<br />
is also available in the form <strong>of</strong> wadding which is a s<strong>of</strong>t web <strong>of</strong> fibre in sheet form.
Fiberfil has the following advantages over cotton as a filling material.<br />
• Better filling and greater s<strong>of</strong>tness than cotton and other fibres <strong>of</strong> equivalent weight. The<br />
filling quantity required with Fiberfil is 70-80 % <strong>of</strong> the filling quantity with cotton<br />
• Moisture and mildew resistance which avoids infestation<br />
• Enhanced air circulation (especially for hollow PSF)<br />
• Better bounce and does not become flat with repeated usage.<br />
• Durability<br />
• Washability (hollow PSF retain bulk and shape after wash)<br />
Market dynamics and key growth drivers<br />
Fiberfil being an input for filling application, the demand for Fiberfil is derived from that <strong>of</strong> pillows,<br />
cushions, bolsters, quilts & comforters, mattresses, mattress toppers, mattress pads, sleeping bags,<br />
furniture cushions and backs, non woven ro<strong>of</strong> liners and carpets for automobiles, etc.<br />
Polyester<br />
staple fibres<br />
(Virgin and<br />
regerated<br />
Fiberfil has to compete with cotton and cotton waste which is the traditional material for filling. Inter<br />
fibre competition is a key factor for the industry thus, demand for Fiberfil is significantly impacted by<br />
the changes in cotton prices. Moreover, the end consumer <strong>of</strong> the various products like mattresses,<br />
pillows etc is unaware <strong>of</strong> the benefits <strong>of</strong> using various kinds <strong>of</strong> filling material thus, initial cost is the<br />
key factor in the purchase decision for majority <strong>of</strong> the customers. The prices <strong>of</strong> Fiberfil are volatile in<br />
nature and were between Rs 55-70 per Kg in the last few months<br />
The value chain <strong>of</strong> regenerated PSF and virgin PSF products is depicted in the following figures:<br />
Value Chain <strong>of</strong> Regenerated PSF<br />
PET scrap dealers<br />
Regenerated PSF<br />
manufacturers<br />
Cotton and<br />
cotton<br />
waste etc.<br />
Filling<br />
material<br />
Market<br />
Dealers/Wholesalers End users
Value Chain <strong>of</strong> Virgin PSF<br />
Petrochemical raw<br />
materials<br />
Market size <strong>of</strong> Fiberfil and future forecast<br />
Fiberfil has low penetration in the Indian industry. The installed capacity <strong>of</strong> Polyester Staple Fiberfil<br />
in India is 47400 MT (Source: Report on Performance <strong>of</strong> Chemical & Petrochemical <strong>Industry</strong> at a<br />
Glance, Department <strong>of</strong> Chemicals & Petrochemicals, Ministry <strong>of</strong> Chemicals & Fertilizers,<br />
Government <strong>of</strong> India). The production <strong>of</strong> virgin PSF in 2007-08 is estimated at 42400 MT.<br />
As per industry sources the current installed capacity <strong>of</strong> Regenerated PSF in India is 500 MT/day.<br />
Most <strong>of</strong> these players are operating at a capacity utilisation <strong>of</strong> 50 – 60% thus, the production <strong>of</strong><br />
regenerated PSF in 2007-08 is estimated at 78,000 MT. Considering the export and import data the<br />
domestic <strong>consumption</strong> <strong>of</strong> Fiberfil in 2007-08 is estimated at 109,950 MT valued at Rs 660 crore. The<br />
installed capacity and production <strong>of</strong> Fiberfil has remained fairly stable over the last two years.<br />
However, with increasing awareness about the product benefits its penetration is expected to increase<br />
in future. Thus, the domestic market size <strong>of</strong> Fiberfil is estimated to increase to 140,300 MT by 2012-<br />
13 (growing at 5 – 6% year on year). The market potential in 2012-13 is estimated at Rs. 840 crore.<br />
No change (upwards or downwards) in the price <strong>of</strong> Fiberfil has been assumed for deriving the<br />
projected market size. The current and future forecast <strong>of</strong> Fiberfil <strong>consumption</strong> is given below:-<br />
Key manufacturers<br />
Virgin PSF<br />
manufacturers<br />
<strong>Domestic</strong> Market size for<br />
Fiberfil<br />
Dealers/Wholesalers Endusers<br />
2007-08 2012-13<br />
Quantity 109,950 MT 140,300 MT<br />
Value Rs 660 crore Rs 840 crore<br />
Source: <strong>Industry</strong> survey, IMaCS Analysis<br />
Reliance Industries Limited is the largest manufacturer <strong>of</strong> Virgin PSF Fiberfil in India. The company<br />
markets its product under the brand name Recron. Some other major manufacturers engaged in
manufacture <strong>of</strong> virgin PSF and regenerated PSF are Ganesh Polytex, Arora Fibres limited, Alliance<br />
Fibres, Nirmal fibres Private limited.<br />
Manufacturer Product Year<br />
Reliance Industries<br />
Ganesh Polytex<br />
Arora Fibres<br />
Alliance fibres Pvt<br />
Limited<br />
Capacity<br />
(MT/annum)<br />
Production<br />
(MT/annum)<br />
Hollow PSF 2006-2007 42000 42797 -<br />
Hollow PSF 2007-2008 42000 42304 -<br />
PSF 2006-2007 32400 17005.07 81.21<br />
PSF 2007-2008 15000 9494.68 40.09<br />
PSF 2006-2007 6000 3794.8 19.3<br />
PSF 2007-2008 6000 3109.8 14.9<br />
Hollow PSF 2006-2007<br />
87.78 0.85<br />
Hollow PSF 2007-2008 6000 92.48 0.1<br />
PSF 2007-2008 7200 - -<br />
Nirmal Fiber Ltd PSF 2006-2007 3600 - -<br />
Imports & Exports <strong>of</strong> Fiberfil<br />
The import figure <strong>of</strong> Fiberfil is given in the following table.<br />
HS Code Description<br />
55032000<br />
The Fiberfil is imported from China.<br />
Hollow Polyester staple<br />
fibre<br />
Quantity<br />
(MT)<br />
The export figure <strong>of</strong> Fiberfil is given in the following table.<br />
HS Code Description<br />
55032000<br />
Hollow Polyester staple<br />
fibre<br />
Value<br />
(Rs crore)<br />
2007-08(E) 2007-08 (E)<br />
~500 MT ~ Rs 2 crore<br />
Source: IBIS, IMaCS Analysis<br />
Quantity<br />
(MT)<br />
Value<br />
(Rs crore)<br />
2007-08(E) 2007-08 (E)<br />
~10950 MT ~ Rs 60 crore<br />
Source: IBIS, IMaCS Analysis<br />
Sales<br />
(Rs. crore)<br />
Reliance Industries Ltd. is the largest exporter <strong>of</strong> Fiberfil. Argentina and USA account for more than<br />
80% <strong>of</strong> the exports. These exports are estimated to be Rs 76.6 crore for the year 2012-13.
Carpet Backing Cloth<br />
A carpet is any loom-woven, felted textile or grass floor covering. The global carpet market for<br />
domestic and industrial end use is dominated by several varieties <strong>of</strong> carpet such as Hand Knotted<br />
Carpets, Hand Woven Carpets, Tufted carpets, Needle felt carpets, Flat weave carpets, etc. Carpet<br />
Backing Cloth (CBC) is used as the backing material for both woven and tufted carpets as depicted in<br />
the figure below:<br />
CBC is generally classified into two categories:<br />
• Primary Carpet backing: The base fabric on which pile yarns are tufted and anchored to<br />
make a carpet<br />
• Secondary Carpet backing: Fabric bonded on the backside <strong>of</strong> the carpet forming an<br />
underlay.<br />
Primary backing is used for making the carpet in which yarn is woven or tufted. Carpet after being<br />
dyed is send for secondary backing. Here the surface is smoothened and backing is applied. Latex is<br />
applied on the back <strong>of</strong> the carpet by passing the carpet through the puddle <strong>of</strong> latex. Latex is forced<br />
down by the blade around all the yarn on the back <strong>of</strong> the carpet, which locks the yarn into the backing.<br />
A second coat <strong>of</strong> latex is applied thereafter which holds the secondary backing onto the tufted<br />
material. The secondary backing provides dimensional stability while locking individual tufts in<br />
place.<br />
Product Characteristics<br />
Primary backing is manufactured mainly from synthetic fabric. Secondary backing is made <strong>of</strong> both<br />
jute and woven polypropylene. Jute carpet backing cloth is approximately 104" wide with gsm<br />
varying between 180 and 407. Jute backing has certain limitations such as potential for browning and<br />
rotting. Thus, the secondary backings used today are majorly woven polypropylene made <strong>of</strong> a leno<br />
weave <strong>of</strong> slit film and spun olefin yarns that forms a stretchable secondary backing fabric. Synthetic<br />
carpet backing cloth is available in many varieties <strong>of</strong> which some are:<br />
Application Fabric characteristics<br />
Primary Backing Fabric<br />
spun polyester warp, spun polyester weft;<br />
40 ends per 10 cm and 40 picks per 10 cm<br />
Primary Backing Fabric<br />
spun polyester warp, spun polyester weft;<br />
70 ends per 10 cm and 70 picks per 10 cm<br />
Secondary Backing polypropylene warp, acrylic weft; 32 ends<br />
Fabric<br />
per 10 cm and 40 picks per 10 cm weft<br />
Secondary Backing<br />
Fabric<br />
cotton yarn nm 40/2 warp, nm 3.6/1 weft;<br />
35 x 2 ends per 10 cm warp and 32 picks<br />
per 10 per cm<br />
149 gsm<br />
266 gsm<br />
78 gsm<br />
135 gsm
Carpet backings without latex are also being produced by some manufacturers. This system eliminates<br />
delamination and thus, such carpets are light weight, more flexible, easier to install and can be<br />
recycled easily. This also eliminates the "new carpet odor".<br />
Market dynamics and key growth drivers<br />
CBC is used as primary and secondary backing for carpets. Thus, growth in the carpet industry is the<br />
key demand driver for CBC. The Indian carpet industry is mainly driven by exports. Around 95% <strong>of</strong><br />
the carpets made in India are exported majorly to USA. The carpet export witnessed a decline in<br />
recent years because <strong>of</strong> rupee appreciation against dollar. As per discussions with industry experts and<br />
key industry players the carpet exports are expected to remain stagnant in future thus, limiting the<br />
growth potential <strong>of</strong> CBC. However, marginal growth is expected in the synthetic CBC only because<br />
<strong>of</strong> replacement <strong>of</strong> jute by the synthetic category.<br />
Consumption pattern and market size<br />
CBC is used in majority <strong>of</strong> the carpets. In 2007–08, approximately 75 million square meters <strong>of</strong> non-<br />
jute carpets were exported <strong>of</strong> which 70 million square meters <strong>of</strong> carpets are expected to have carpet<br />
backing. Since 95% <strong>of</strong> the carpets manufactured in India are exported, the production <strong>of</strong> carpets with<br />
carpet backing is estimated at 73 million square meters. As per industry sources approximately 10 %<br />
<strong>of</strong> the carpets have jute carpet backing. The average GSM <strong>of</strong> jute backing is 300.<br />
The current market size <strong>of</strong> jute CBC is estimated at 4750 MT valued at Rs 17 crore. The demand for<br />
jute CBC is expected to fall because <strong>of</strong> its replacement by synthetic CBC. The market for jute CBC is<br />
expected to decrease to 3673 MT by 2012-13 (falling at 5% year on year). The market potential for<br />
jute carpet backing in 2012-13 is estimated at Rs 12.86 crore.<br />
The market size <strong>of</strong> synthetic carpet backing cloth is estimated at 128 million sq m valued at Rs 269<br />
crore. The demand for synthetic carpet backing is expected to increase on account <strong>of</strong> replacement <strong>of</strong><br />
jute CBC by synthetic. Thus, the demand for synthetic CBC is expected to increase to 164 million sq<br />
m by 2012-13 registering a growth <strong>of</strong> 5% year on year.<br />
The market potential in 2012-13 is estimated at Rs 345 crore. The current and future forecast <strong>of</strong> CBC<br />
<strong>consumption</strong> is given below:-<br />
Market size for CBC 2007-08 2012-13
Jute CBC<br />
Synthetic CBC<br />
Total<br />
Key manufacturers <strong>of</strong> CBC<br />
Quantity<br />
4700 MT or 15<br />
million sq m*<br />
3600 MT or 12<br />
million sq m*<br />
Value Rs 15 crore Rs 13 crore<br />
Quantity<br />
The major manufacturers <strong>of</strong> Jute CBC are:<br />
130 million sq<br />
m<br />
165 million sq<br />
m<br />
Value Rs 270 crore Rs 345crore<br />
Quantity<br />
Manufacturer Year Quantity (MT) Value<br />
145 million sq<br />
m<br />
~180 million<br />
sq m<br />
Value Rs 285 crore ~Rs 360 crore<br />
(Rs crore)<br />
Source: <strong>Industry</strong> survey, IMaCS Analysis<br />
* The average gsm <strong>of</strong> jute backing is 300<br />
Unit Price Installed capacity<br />
Ludlow Jute 2007-08 46360 155.21 Rs 33.48/kg 57,500 MT<br />
Birla Corporation* 2007-08 33317 113.95 Rs 34.20/kg 32 + 822 looms**<br />
Gloster Jute* 2007-08 45362 156.96 Rs 34.61/kg 1045 looms<br />
Other players include<br />
• Auckland International<br />
• Prabartak Jute<br />
• India Jute & Ind<br />
• Champadany Industries Ltd etc.<br />
Imports & Exports <strong>of</strong> CBC<br />
Source: Capitaline, Annual reports ,Company website <strong>Industry</strong> survey<br />
* This includes all the jute products besides carpet backing fabric as well<br />
** Narrow + Broad looms<br />
The estimated import figures for jute CBC and synthetic CBC are as given below:-
HS Code Description<br />
Imports<br />
Quantity<br />
Imports<br />
(in Rs crore)<br />
2007-08(E) 2007-08(E)<br />
53101011 Jute CBC*<br />
~ 0.5 million sq<br />
m<br />
~ Rs 1.5 crore<br />
54072010 PP Woven Backing ~ 2 million sq m ~Rs 4 crore<br />
Source: DGCIS,IBIS, IMaCS Analysis<br />
* This may include other hessian fabrics<br />
Import <strong>of</strong> Jute CBC takes place mainly from Bangladesh. Around 60% <strong>of</strong> the imports <strong>of</strong> synthetic<br />
CBC are from Germany while the balance from Belgium and Saudi.<br />
The estimated export figures for jute CBC and synthetic CBC are as given below:-<br />
HS Code Description<br />
Exports<br />
Quantity<br />
Exports<br />
(in Rs crore)<br />
2007-08(E) 2007-08(E)<br />
53101011 Jute CBC* 89,280 sq m ~ Rs 0.5 crore<br />
54072010 Woven PP fabric<br />
~ 0.2 million sq<br />
m<br />
~ Rs 1crore<br />
Source: DGCIS,IBIS, IMaCS Analysis<br />
* This may include other hessian fabrics<br />
India has very low export <strong>of</strong> jute CBC as compared to Bangladesh which has the highest share in the<br />
export market. Exports <strong>of</strong> synthetic CBC are mainly to USA. These exports are estimated to be the<br />
same at Rs 1.5 crore for the year 2012-13.
Stuffed toys<br />
Stuffed toys, also referred to as plush toys and s<strong>of</strong>t toys, are made up <strong>of</strong> s<strong>of</strong>t knitted fabrics stuffed<br />
with filling material. Stuffed toys are popular for a variety <strong>of</strong> reasons – as toys for kids, as gifts among<br />
youngsters for Valentine's Day, birthdays, other kind <strong>of</strong> special days or just as an expression <strong>of</strong><br />
thought.<br />
Product characteristics<br />
Stuffed toys are entirely textile material. The outer fabric or skin <strong>of</strong> stuffed toys is made <strong>of</strong> fur, fleece,<br />
polyester felt, acrylic plush fabrics, etc. The skin is stuffed with a variety <strong>of</strong> materials such as<br />
polyester staple Fiberfil, foam, cloth scrap, paper foam or cotton. The toys are manufactured in<br />
different shapes, sizes and colours, the height varying from 6 cm to 200 cm.<br />
Market dynamics and key growth drivers<br />
Stuffed toys are very popular among kids. Besides this, stuffed toys are also used by youngsters for<br />
decoration at home or work place, as gifts on occasions such as Valentine's Day, birthdays, other<br />
special days, etc. The young demography, rising disposable income and people’s preference for<br />
stuffed toys as a gift item augur well for the industry.<br />
The industry is seasonal with demand picking up during festive season, Valentine’s Day and during<br />
vacations. The demand is more or less limited to urban area with metros and other big cities<br />
accounting for majority <strong>of</strong> the demand.<br />
Market size <strong>of</strong> Stuffed toys and future forecast<br />
Based on interaction with the industry experts and key industry players the domestic market size for<br />
stuffed toys is estimated at Rs. 420 crore or 60 million pieces. On account <strong>of</strong> rising disposable income<br />
and increasing preference for stuffed toys amongst both youngsters and kids the stuff toy<br />
manufacturers have been witnessing double digit growth rates in the recent years and the industry is<br />
expected to grow at a CAGR <strong>of</strong> 15%. Thus, the market size <strong>of</strong> stuffed toys is expected to increase to<br />
120 million pieces by 2012-13. The market potential in 2012-13 is estimated at around Rs. 1,050<br />
crore. An inflationary increase <strong>of</strong> 5% is considered for estimating the market size.<br />
The current and future forecast <strong>of</strong> stuff toy <strong>consumption</strong> is given below:-
Market size for Stuffed toys 2007-08 2012-13<br />
Quantity<br />
60 million<br />
pieces<br />
120 million<br />
pieces<br />
Value Rs 420 crore Rs 1050 crore<br />
Key manufacturers <strong>of</strong> Stuffed toys<br />
Source: <strong>Industry</strong> survey, IMaCS Analysis<br />
The industry is characterised by a few leading players in the organised sector and large number <strong>of</strong><br />
unorganised home based units. Some <strong>of</strong> the leading manufacturers are Hanung toys, Sunlord apparels,<br />
and Kridnak Udyog.<br />
Hanung Toys & Textiles Ltd was set up in <strong>technical</strong> collaboration with South Korea and is India’s<br />
largest manufacturer and exporter <strong>of</strong> s<strong>of</strong>t toys, decorative cushions & children’s room furnishings.<br />
The company manufactures s<strong>of</strong>t toys made <strong>of</strong> acrylic plush fabric stuffed with hollow PSF. Besides<br />
this the company also manufactures decorative cushions in various shapes, sizes, designs and colours,<br />
home furnishings in various fabrics, colours and designs and products like bed sets, duvet covers,<br />
curtains, throws, quilts, sleeping bags, bolsters/long cushions, cushion covers, floor rugs & carpets, sit<br />
sacks (bean bags). The company’s products are exported to USA, Latin America, Europe and Middle<br />
East. Some <strong>of</strong> the key customers <strong>of</strong> Hanung are Wal-Mart, IKEA, Debenhams, American Pacific,<br />
Springs Industries, Mohawk Home, Home Centre, etc. The company markets its s<strong>of</strong>t toys under the<br />
brand Play’N’Pets. The company has agreement with Walt Disney India that allows it to manufacture<br />
s<strong>of</strong>t toys resembling Disney characters like Mickey Mouse, Donald Duck, Go<strong>of</strong>y, Nemo and Lion<br />
King among others.<br />
Company Capacity Production<br />
(2007-2008)<br />
Sales<br />
2007-2008<br />
Hanung Toys 20 million pieces 21 million pieces Rs. 213.97 crore<br />
Kridnak Udyog 0.045 million pieces<br />
Source: <strong>Industry</strong> survey, Hanung annual report<br />
Besides this, stuffed toys also manufactured by unorganised home based units. These manufacturers<br />
are concentrated in Noida and Kolkata.<br />
Imports & Exports <strong>of</strong> Stuffed toys product<br />
The estimated import figure for stuffed toys is given in the following table:
HS Code Description Quantity<br />
95030010,<br />
95030030,<br />
95030090,<br />
Stuff Toy/S<strong>of</strong>t<br />
Toy<br />
Value<br />
(Rs crore)<br />
2007-08(E) 2007-08 (E)<br />
~ 5 million<br />
pieces<br />
~ Rs 5.5 crore<br />
Source: IBIS, IMaCS Analysis<br />
Majority <strong>of</strong> stuffed toys are imported from China. Some s<strong>of</strong>t toys are also imported from France,<br />
Singapore, Srilanka, Thailand, etc.<br />
The estimated export figure for stuffed toys is given in the following table:<br />
HS Code Description Quantity<br />
95021090/9900,<br />
95034100<br />
95034990,<br />
95051000,<br />
Value<br />
(Rs crore)<br />
2007-08(E) 2007-08 (E)<br />
Stuff Toy/S<strong>of</strong>t Toy ~ 0.2 million pieces ~ Rs 1.5 crore<br />
Source: IBIS, IMaCS Analysis<br />
The stuffed toys are exported to USA, Denmark, Tanzania, Saudi Arabia etc. These exports are<br />
estimated to be the same at Rs 1.5 crore for the year 2012-13.<br />
Raw materials and machineries<br />
The outer skin <strong>of</strong> the stuffed toys is made from knitted pile fabrics/artificial fur as they have the<br />
desired s<strong>of</strong>t feel. These fabrics are mostly made <strong>of</strong> polyester or polyester cotton blends. The knitted<br />
fabrics have different pile lengths ranging from 1 mm to 16 mm. These fabrics are primarily imported<br />
from China, Korea, and Hong Kong as the locally available fabric is not <strong>of</strong> desired quality.<br />
The filling can be done with cotton, cotton waste, paper or Fiberfil. The high value products use<br />
Fiberfil for stuffing. Siliconised Fiberfil is used when higher bounce is desired. Reliance Industries<br />
limited is the leading supplier <strong>of</strong> Fiberfil in the country.<br />
Production <strong>of</strong> stuffed toys is carried out manually in the unorganised home based units. As a result the<br />
products do not meet the international quality standards. The organised players are equipped with<br />
modern tools and machines to facilitate mass production. The machineries used for the manufacturing<br />
stuffed toys are:
• Cutting machine such as fire cutting machine, press die cutting machine, bend knife cutting<br />
machine<br />
• Eyes and nose punching and sealing machine<br />
• Sewing machine<br />
• Carding and Fiberfil stuffing machine<br />
• Metal detectors<br />
• Vacuum press machines for final packaging<br />
Quality Control and standards<br />
The stuffed toys should be Azo free and also free from harmful substances like lead and cadmium<br />
which can be very harmful to the kids. The quality standards applicable to stuffed toys are:<br />
BIS Code Description<br />
IS 9873: Part 1: 2001<br />
IS 9873: Part 2: 1999<br />
IS 9873: Part 3: 1999<br />
Safety Requirements for Toys - Part 1: Safety<br />
Aspects related to Mechanical and Physical<br />
Properties<br />
Safety Requirements for Toys - Part 2:<br />
Flammability Requirements<br />
Safety Requirements for Toys - Part 3: Migration<br />
<strong>of</strong> Certain Elements<br />
In addition, the standards applicable to the toy industry are EN-71, ASTM, BS-5665, AS1647, CPSC<br />
etc.<br />
Blinds<br />
A window blind is a window covering composed <strong>of</strong> long strips <strong>of</strong> fabric or rigid material. A blind<br />
limits observation and thus “blinds” the observer to the view.<br />
Product Characteristics<br />
Blinds are made <strong>of</strong> variety <strong>of</strong> materials; the material chosen depends on the aesthetic and functionality<br />
required. The desired functional performance include light and glare control, desired outside view,<br />
ease in handling and maintenance, acoustic performance, etc. The most common window blinds are
Slat blinds, which consist <strong>of</strong> many horizontal slats, usually <strong>of</strong> metal or vinyl, connected with string in<br />
such a way that they can be rotated to allow light to pass between the slats, rotated up to about 170<br />
degrees to hide the light, or pulled up so that the entire window is clear. Vertical blinds consist <strong>of</strong> slats<br />
<strong>of</strong> stiffened fabric, plastic, or metal hanging by one end from a track. Like the horizontal versions, the<br />
slats can be rotated 90 degrees to allow light to pass through or to fold up on one side <strong>of</strong> a door or<br />
window. Vertical blinds exhibit better control over the extent <strong>of</strong> natural or exterior light entering the<br />
room because <strong>of</strong> the ability <strong>of</strong> slats to close tightly.<br />
Venetian blinds have horizontal slats, one slat above another. They are suspended by strips <strong>of</strong> cloth<br />
called tapes or by cords which are able to tip them each at the same time up to 180 degrees. There are<br />
also lift cords passing through holes in each slat. When these cords are pulled, the bottom <strong>of</strong> the blind<br />
moves upward causing slats to rest on each other as the blind is raised. Venetian blinds are basic<br />
slatted blinds made <strong>of</strong> metal or plastic; wooden slats are sometimes used but these are usually referred<br />
to as wood blinds or bamboo blinds. Slat width varies between 16 mm and 120 mm, the most<br />
common width being 50 mm.<br />
Other varieties <strong>of</strong> window blinds include Mini blinds (venetian blinds with very narrow slats usually<br />
25 mm wide), Micro blinds (with slats usually 12 mm wide), Louvers (fabric or poly vinyl), Jalousies,<br />
Brise Soleil, Holland blinds, Pleated blinds, Honeycomb blinds (similar to pleated shades except that<br />
there are two or more layers joined at the pleats to form compartments that trap air, providing<br />
insulation), Roman shades, and roller shades. The Louvers vary in width from 50 mm to 125 mm, but<br />
the most popular ones are the 100 mm louvers.<br />
Key growth drivers<br />
The commercial establishments like <strong>of</strong>fices, hospitals, hotels etc. account for majority <strong>of</strong> domestic<br />
demand for blinds. Vertical blinds are the most popular in <strong>of</strong>fices whereas Roman blinds are used in<br />
hotels. Roman blinds are also preferred for farm houses. The growth in domestic demand for blinds is<br />
expected to be driven by the infrastructure development planned in the country.<br />
Market size <strong>of</strong> Blinds and future forecast<br />
<strong>Industry</strong> survey reveals that blinds are <strong>of</strong> typically the same width and height as the window itself or<br />
slightly wider and taller depending on whether they are fixed inside or outside the window's reveal.<br />
The fabric requirement in a blind for a window size <strong>of</strong> 6 ft X 6 ft is approximately 4.2 square meters.<br />
As per industry sources the market size for blinds is estimated at Rs 1050 crore. The <strong>technical</strong> textile<br />
component constitutes 60% by value <strong>of</strong> total blind. Thus, the market size for fabric used in blends is<br />
estimated at Rs 630 crore. The current demand for fabric is estimated at 30 million square meters. The<br />
demand for blinds is expected to increase on account <strong>of</strong> enhanced construction activity. Moreover, the<br />
penetration <strong>of</strong> blinds is expected to increase in the domestic market. Thus, the demand <strong>of</strong> fabric for<br />
blinds is expected to increase to 60 million sq m by 2012-13 (growing at 15% year on year). The
market potential in 2012-13 is expected to be Rs 1270 crore. The current and future forecast <strong>of</strong> market<br />
size blinds is given below:-<br />
Market size for Blind fabric 2007-08 2012-13<br />
Quantity 30 million sq m 60 million sq m<br />
Value<br />
(TTC – 60%)<br />
Key manufacturers <strong>of</strong> Blinds<br />
Rs 1050 crore Rs 2110 crore<br />
Rs 630 crore Rs 1270 crore<br />
Source: <strong>Industry</strong> survey, IMaCS Analysis<br />
The fabric and non-fabric components <strong>of</strong> blinds are manufactured by different producers and finally<br />
assembled by one dealer for final installation. The industry has a large number <strong>of</strong> players in<br />
unorganized sector with organized sector accounting for approximately 15% <strong>of</strong> the total market. The<br />
major manufacturers <strong>of</strong> blinds in the organized sector are:<br />
• Hunter Douglas,<br />
• Mac Décor Ltd.,<br />
• Aerolux India Private Limited and<br />
• Viesta<br />
Various blind manufacturers are only fabricators and do not manufacturer fabric. These players do<br />
contract manufacturing for production <strong>of</strong> coated fabrics. There are various players in Uttar Pradesh,<br />
Hyderabad, Nasik etc who manufacture these fabrics. The other players in this industry are Bagga<br />
Enterprises, Jain Venetion Blinds Ind., Growrich Horivert Private etc.<br />
Imports & Exports <strong>of</strong> Blinds<br />
Various components used in a blind such as hangers, spacers, head rails, interlocking chain, sliding<br />
channel, runner, end cap set, bottom weight, tilting chain, etc. are domestically procured as well as<br />
imported from Taiwan, China and few European countries. Synthetic coated fabrics strips are<br />
imported from Taiwan and China. Ready blinds are also imported from Germany, Australia and USA.<br />
All the players in the organised segment import over 95% <strong>of</strong> their sales. The estimated import figures<br />
for Blinds are as given below:-<br />
HS Code Description<br />
Imports Imports<br />
Quantity (in Rs crore)<br />
2007-08(E) 2007-08(E)<br />
70195900 Venetian Blinds 70115 sq m ~ Rs 2 crore<br />
54078119, 54071029 Roller Blind Fabric 9250 sq m ~ Rs 0.15 crore<br />
58063190 Vertical Blind Fabric 122120 sq m ~ Rs 0.15 crore<br />
59031090, 59039010/90,<br />
59070099, 59119090<br />
Blind Fabric 319750 sq m ~ Rs 2 crore<br />
63031900, 63039200, Blind Fabric 70210 sq m ~ Rs 4 crore
63039910/90, 63049990,<br />
63061930<br />
39189090 & 39219010 Blind Fabric* 9380 sq m ~ Rs 0.5 crore<br />
Source: IBIS, IMaCS Analysis<br />
* Blind covers under the HS code <strong>of</strong> 39269099 have been excluded here<br />
Around 41% <strong>of</strong> the imports (included under HS Code 63) take place from China. The imports under<br />
the HS code 70 are from France, which has a share <strong>of</strong> around 20%. Around 15% <strong>of</strong> blinds are<br />
imported from Taiwan under the HS codes 54, 59 & 63. Other main countries from where blinds are<br />
imported are Spain, Germany, USA and Australia. In addition to this, coated fabric for making blinds<br />
is also imported.<br />
Blinds from India are also exported to countries like Netherlands, UK, Germany, Italy, Ghana,<br />
Senegal, France, Singapore etc. The estimated export figures for Blinds are as given below:-<br />
HS Code Description<br />
36253000 Blinds<br />
63031100, 63039100, 63039990,<br />
63049190/290, 63049990, 63061920,<br />
63071090, 63072010, 63079020/90<br />
Blinds*<br />
Exports Exports<br />
Quantity (in Rs crore)<br />
2007-08(E) 2007-08(E)<br />
Approx. 3600<br />
sq.m.<br />
~ Rs 0.8 crore<br />
Approx 44500<br />
sq m<br />
Source: IBIS, DGCIS, IMaCS Analysis<br />
* These blinds are mainly <strong>of</strong> silk, cotton & polyester<br />
~ Rs 3 crore<br />
Over 20% <strong>of</strong> exports take place to France and Maldives each. Ghana had around 16% <strong>of</strong> share in<br />
exports while Norway has half <strong>of</strong> it around 8%. Rest major countries to which blinds are being<br />
exported include USA, Austria, Germany, Sweden and Netherlands. These exports are estimated to be<br />
Rs 4.6 crore for the year 2012-13.<br />
Raw materials<br />
The fabric louvers are mostly woven on handlooms or power looms from polyester, viscose, cotton,<br />
acrylic and blended yarns. There are also other varieties including glass fibre fabrics, black-outs,<br />
Jacquards, etc. The fabric used in roller blinds is made <strong>of</strong> either 100 % polyester or polyester-viscose<br />
blend. In a few cases special fabrics for blackouts or acoustic performance are also used.<br />
Different types <strong>of</strong> coatings are done on the fabric for blinds to make it water resistant, dust repellent<br />
or stain free. Coating is done on one side (facing the sun for reflecting the light) or both the sides <strong>of</strong><br />
the fabric. The coating is also done to prevent the fading <strong>of</strong> colour due to excess exposure to sunlight.
HVAC filters<br />
HVAC stands for heating, ventilating, ntilating, and and air air conditioning. conditioning. The The HVAC HVAC systems systems are used in<br />
industries, commercial commercial and residential buildings buildings where humidity and temperature need to be closely<br />
regulated.<br />
The filtration systems in general can be classified as Liquid -Solid separation (e.g. g. vacuum and<br />
pressure filters), Air-Gas Gas separation (e.g. activated carbon filters) and Air-Solid Air Solid separation (i.e. filters<br />
that remove remove particulate particulate matter matter from from air). HVAC filters belong to the category <strong>of</strong> air filtration products.<br />
The filtration products are also also classified classified based based on on their end application as depicted below:<br />
Air filter<br />
The HVAC HVAC filters filters include include pre filters, filters, medium medium efficiency filters and HEPA filters. HEPA or High<br />
Efficiency Particulate Air Air filters are are high high efficiency efficiency filters capable <strong>of</strong> removing 99.97% o<strong>of</strong><br />
o airborne<br />
particles <strong>of</strong> <strong>of</strong> 0.3 0.3 micrometers micrometers (µm) diameter. diameter. Filters capable <strong>of</strong> removing 99.999% <strong>of</strong> dust, pollen,<br />
mold, bacteria and and any airborne particles <strong>of</strong> size 120 120 nano metres or larger from the air are categorised<br />
as ULPA or Ultra Low Penetration Air filter. filter<br />
Product Characteristics<br />
Automobil<br />
e filters<br />
Lube oil<br />
filter<br />
Classification<br />
based on<br />
Application<br />
Fuel filter<br />
Pre filters<br />
Air filter<br />
(HVAC<br />
filters)<br />
Medium<br />
efficiency<br />
filters<br />
Industrial<br />
filters<br />
Filter media media used used in in air filters filters are are nonwoven fabrics fabrics laid perpendicular to the air flow to arrest the<br />
solid particulate particulate matter. Air Air filters filters can can be be either either mechanical filters or electrostatic filters<br />
(electrostatically enhanced filters). ilters). Most Most <strong>of</strong> <strong>of</strong> the the filters filters fall fall under under the category <strong>of</strong> mechanical filters and<br />
depend on four primary filtration mechanisms - sieving, impaction, interception, and diffusion. Filters<br />
are characterized by their filtration efficiency, MERV rating and Micron size.<br />
Liquid<br />
filter<br />
HEPA<br />
filters
Filtration efficiency: Filtration efficiency can be calculated using the following formula<br />
Filter Efficiency = 1 - Particles Downstream<br />
Particles Upstream<br />
MERV Rating or Minimum Efficiency Reporting Value is a number from 1 to 16 that is relative to an<br />
air filter’s efficiency. The higher the MERV, the more efficient the air filter is. A higher MERV<br />
creates more resistance to airflow because the filter media becomes denser as efficiency increases.<br />
The table below gives the application areas <strong>of</strong> various types <strong>of</strong> filters.<br />
Filter Efficiency MERV ratings Application<br />
95% >14<br />
Final filter in hospital and other clean<br />
room HVAC systems.<br />
85% >13<br />
Commercial applications like research<br />
Labs.<br />
65% >11<br />
Standard commercial buildings, such as<br />
<strong>of</strong>fice space.<br />
25% >6<br />
Pleated panel filters, used in <strong>of</strong>fice<br />
environments, and as prefilters.<br />
10 Pre filter<br />
5 to 10 Medium efficiency filters<br />
< 5 High efficiency filters<br />
The filter media should have appropriate anti static properties to prevent build up <strong>of</strong> static charge due<br />
to dust particles which can lead to an explosion.<br />
The pre filters are generally re-usable as they can be washed when the filter medium gets choked. The<br />
HEPA filters on the other hand are disposable type.<br />
Market dynamics and key growth drivers<br />
The demand for HVAC filters is derived from the demand <strong>of</strong> HVAC systems. The HVAC industry<br />
can be broadly classified into the following two segments:<br />
Split and window type air conditioners
The type <strong>of</strong> filter used varies with each manufacturer. Most <strong>of</strong> the air conditioners use pre filters. The<br />
manufacturers have to balance the conflicting objectives <strong>of</strong> minimizing the power <strong>consumption</strong> and<br />
maintaining the air quality.<br />
Centralized air conditioners<br />
The demand for centralized air conditioning is derived from various commercial and industrial<br />
buildings .Not much attention is given to the quality <strong>of</strong> air in most cases; cost minimization is the<br />
primary goal and hence pre filters are used. HEPA and microvee filters find application in Pharma &<br />
Electronics industries, nuclear installations, and hospitals etc where the quality <strong>of</strong> air is critical.<br />
In a centralized air conditioner the filters are housed in the Air handling unit. An air handler, or air<br />
handling unit (<strong>of</strong>ten abbreviated as AHU), is a device used to condition and circulate air as part <strong>of</strong> a<br />
heating, ventilating, and air-conditioning (HVAC) system. Usually, an air handler is a large metal box<br />
containing a blower, heating and/or cooling elements filter racks or chambers, sound attenuators, and<br />
dampers. Air handlers usually connect to ductwork that distributes the conditioned air through the<br />
building, and returns it to the AHU. The AHU can have different combinations <strong>of</strong> pre filter, medium<br />
and high efficiency filters .The pre filters remove the large sized particles hence the higher efficiency<br />
filter is subject to lesser load.<br />
Air conditioning products are now considered more as a necessity rather than a luxury. The rising<br />
disposable incomes and awareness among the people <strong>of</strong> the respiratory diseases, allergies etc indicate<br />
a huge potential for the industry.<br />
Market size <strong>of</strong> HVAC filters and future forecast<br />
HVAC filters are used in split and window type air conditioners as well as centralized air<br />
conditioning. The requirement <strong>of</strong> filter media for split/window type air conditioners varies from<br />
manufacturer to manufacturer and this media is generally washable. As per industry sources<br />
approximately 2 million air conditioners were manufactured in 2007-08. Considering an average<br />
requirement <strong>of</strong> 0.35 square metres <strong>of</strong> filter media per air conditioner the demand for HVAC filters for<br />
split/window type air conditioners is estimated at 0.7 million square meters valued at Rs 6 crore.<br />
Based on trends over last few years the demand <strong>of</strong> air conditioners is estimated to grow at 15 % per<br />
annum which functions as a key driver for growth in HVAC filters. Thus, the market size is estimated<br />
to increase to 1.5 million square meters by 2012-13. The market potential in 2012-13 is estimated to<br />
be Rs 15 crore. An inflationary increase <strong>of</strong> 5% has also been considered to estimate the market size.<br />
The requirement <strong>of</strong> filter media for centralized air conditioning is dependent on various factors like<br />
desired quality <strong>of</strong> air, air flow rate, number <strong>of</strong> air handling units etc. The replacement demand <strong>of</strong><br />
throw away type filters depends on the quality <strong>of</strong> air handled. The filters are available in different
sizes and use different filtration media based on these parameters. As per industry sources the medium<br />
and high efficiency filters require around 2 - 2.5 square metre <strong>of</strong> filter media per filter.<br />
The filters are housed in the Air handling unit. The AHU can have different combinations <strong>of</strong> pre filter,<br />
Medium and high efficiency filters. A typical 3000 CFM AHU requires 2 - 4 filters.<br />
Usage <strong>of</strong> HVAC for centralised air conditioners<br />
Average requirement <strong>of</strong> filter 5 square meters<br />
media per AHU<br />
Average price <strong>of</strong> filter media Rs 120 per square<br />
metre<br />
Replacement frequency <strong>of</strong> Annual<br />
filter media<br />
As per industry sources the demand for AHU in 2007-08 is estimated to be around 32,000 units. In<br />
addition the total number <strong>of</strong> AHU in 2006-07 is estimated to be 1.3 lakhs. Thus, the demand for<br />
HVAC filters for centralized air conditioning is estimated at 0.8 million square meters valued at Rs.<br />
10 crore. The HVAC industry has witnessed a growth rate in excess <strong>of</strong> 25 % over the last few years.<br />
<strong>Segment</strong>s such as IT/ITES, retail, industrial, entertainment, pharma, healthcare, hospitality, telecom<br />
and banking fuelled the growth <strong>of</strong> the commercial air-conditioning industry. With continued<br />
investments in infrastructure, the commercial air-conditioning industry is expected to grow at 20% per<br />
annum over the next few years. Thus, the market size is expected to increase to 2 million square<br />
meters by 2012-13. The market potential in 2012-13 is estimated to be Rs. 30 crore. An inflationary<br />
increase <strong>of</strong> 5% has also been considered to estimate the market size.<br />
The current and future forecast <strong>of</strong> HVAC filters <strong>consumption</strong> is given below:<br />
Doemstic market size for HVAC filters 2007-08 2012-13<br />
HVAC filters for split<br />
and window type Air<br />
conditioners<br />
HVAC filters for<br />
centralized Air<br />
conditioners<br />
Total<br />
Quantity<br />
0.7 million square<br />
meters<br />
1.5 million<br />
square meters<br />
Value Rs 6 crore Rs 15 crore<br />
Quantity<br />
0.8 million square<br />
meters<br />
2 million square<br />
meters<br />
Value Rs 10 crore Rs 30 crore<br />
Quantity<br />
1.5 million square<br />
meters<br />
3.5 million<br />
square meters<br />
Value Rs 16 crore Rs 45 crore<br />
Source: <strong>Industry</strong> survey, IMaCS Analysis
Key manufacturers<br />
The major manufacturers <strong>of</strong> split and window type air conditioners are LG, Samsung, Videocon,<br />
Voltas, Blue star etc .Blue star and Voltas are also the leaders in centralized air conditioning industry<br />
with Blue star having a market share <strong>of</strong> around 30%.<br />
Some <strong>of</strong> the major manufacturers <strong>of</strong> Air filtration products are<br />
• Thermadyne Private Limited (Faridabad),<br />
• Spectrum Filtration Pvt. Ltd (Kolkata),<br />
• Anfilco Limited(Gurgaon),<br />
• CRE Industries (Delhi),<br />
• John Fowler (Bangalore)<br />
The filter manufacturers source the filter media from outside. Nonwoven filter media requirement is<br />
primarily met by imports. Some <strong>of</strong> the indigenous manufacturers /suppliers are<br />
• Dinesh Mills,<br />
• Supreme Nonwoven,<br />
• Mech Tech Industries (Ahmedabad),<br />
• Biyani Industrial Fabrics (Indore)<br />
Imports & Exports<br />
HS Code Description<br />
56039400, 6090090,<br />
56031300, 6031200<br />
Synthetic Non<br />
Woven Filter<br />
Media *<br />
Imports<br />
(Quantity)<br />
2007-08 (E)<br />
1 million square<br />
meters*<br />
Imports<br />
(Rs crore)<br />
2007-08 (E)<br />
Rs 12 crore*<br />
Source: IBIS, DGCIS, IMaCS analysis<br />
*This includes filter media used for filter applications other than that <strong>of</strong> HVAC filters<br />
The filter media is imported from Germany, Netherlands, Taiwan, China and USA. The imports from<br />
Netherlands account for around 40% <strong>of</strong> the imports. The HEPA filters are imported from Malaysia,<br />
China, USA, and Netherlands.<br />
The exports from India <strong>of</strong> HVAC filters and filter media are negligible.
Type <strong>of</strong> Raw materials<br />
The major filter media used in HVAC filters are nonwoven and made <strong>of</strong> polyester, polypropylene and<br />
glass fibre. These nonwoven media are generally needle punched and have a GSM <strong>of</strong> 200-250.<br />
Quality Control and standards in India<br />
The relevant BIS standards is<br />
IS 7613: 1975<br />
Method <strong>of</strong> testing panel type air filters for air conditioning and<br />
ventilation purposes<br />
The American Society <strong>of</strong> Heating, Refrigerating and Air-Conditioning Engineers (ASHRAE)<br />
standards are also relevant for the Indian market.
Filter fabrics for Vacuum cleaners<br />
Vacuum cleaners have a filter to remove the dust from the exhaust air. The dust is collected in a paper<br />
bag which can be disposed <strong>of</strong>f. Some <strong>of</strong> the vacuum cleaners also use HEPA filters.<br />
Market dynamics and key growth drivers<br />
The demand for vacuum cleaner filters is driven by the demand for vacuum cleaners. The use <strong>of</strong><br />
vacuum cleaners is mainly concentrated in the urban areas. The demand for vacuum cleaners is<br />
triggered by increasing urbanisation & disposable incomes, increasing health awareness,<br />
unavailability and rising cost <strong>of</strong> domestic help and increasing number <strong>of</strong> working women. As per<br />
industry sources the demand is also getting a boost because <strong>of</strong> number <strong>of</strong> <strong>of</strong>fices and households<br />
using carpets which necessitates use <strong>of</strong> vacuum cleaners.<br />
Market size <strong>of</strong> vacuum filters and future forecast<br />
As per industry sources most <strong>of</strong> the vacuum cleaners sold in India are imported along with the filter<br />
media. The domestic market for vacuum cleaners is estimated to be around 2.6 lakh units per annum<br />
which amounts to 33,800 square metres <strong>of</strong> filter media valued at Rs 35 lakh. The replacement demand<br />
<strong>of</strong> the filter media is also small and these are also reported to be imported.<br />
The demand for vacuum cleaners is estimated to have a growth rate <strong>of</strong> 13% based on the sales trends<br />
<strong>of</strong> Eureka Forbes. Thus, the demand for filter media in 2012-13 is estimated to be 62,280 square<br />
metres. The market potential in 2012-13 is estimated to be Rs 80 lakh. An inflationary increase <strong>of</strong> 5%<br />
per annum is assumed to estimate the market potential.<br />
The current and future forecast for <strong>consumption</strong> <strong>of</strong> filter fabric is given below:-<br />
Key manufacturers<br />
Market size <strong>of</strong> filter fabrics for<br />
vacuum cleaners<br />
Quantity<br />
2007-08 2012-13<br />
33,800<br />
square metres<br />
62,280 square<br />
metres<br />
Value Rs 35 lakh Rs 80 lakh<br />
Source: <strong>Industry</strong> Survey, IMaCS Analysis<br />
Filter fabrics used in vacuum cleaners are not manufactured by vacuum cleaner manufacturers and are<br />
outsourced. The filter fabrics are majorly imported.<br />
Imports and Exports
The import <strong>of</strong> filter fabric used in vacuum cleaners is negligible. The filter fabric is imported as a part<br />
<strong>of</strong> vacuum cleaners. The exports from India <strong>of</strong> HVAC filters and filter media are also negligible.<br />
Key importers & exporters<br />
Eureka Forbes is the key importer <strong>of</strong> vacuum cleaners. Filters for vacuum cleaners are imported as a<br />
part <strong>of</strong> vacuum cleaners.<br />
Raw materials<br />
The major filter media are nonwoven and made <strong>of</strong> polyester, polypropylene and glass fibre. These<br />
nonwoven media are generally needle punched and have a GSM <strong>of</strong> 200-250.
Mattresses and pillows<br />
A mattress is a mat or pad usually placed atop a bed. Mattresses can be broadly classified as:<br />
• Foam mattresses<br />
• Coir mattresses<br />
• Spring mattresses<br />
Mattresses are made <strong>of</strong> a filling material like coir, foam etc which provides support to the body.<br />
Traditional Indian mattresses are thick quilts made up <strong>of</strong> cotton stuffing. The protective fabric cover<br />
which encases the mattress is called ticking. Ticking fabric holds the filling material in place. It is<br />
usually made <strong>of</strong> cotton and comes in a wide variety <strong>of</strong> colours and styles. The GSM <strong>of</strong> the fabric<br />
varies from 80 to 200.<br />
The typical sizes <strong>of</strong> mattresses are given in the following table:<br />
Mattress sizes<br />
Class Dimensions in inches Class Dimensions in inches<br />
Divan<br />
Single<br />
Twin<br />
72"X30"<br />
75"X30"<br />
78"X30"<br />
72"X36"<br />
75"X36"<br />
78"X36"<br />
72"X48"<br />
75"X48"<br />
78"X48"<br />
Queen<br />
King<br />
72"X60"<br />
75"X60"<br />
78"X60"<br />
72"X72"<br />
75"X72"<br />
78"X72"<br />
The most commonly available mattresses are 72” X 36” in Northern India and 78” X 36” in rest <strong>of</strong> the<br />
country. The typical value and quantity <strong>wise</strong> break up <strong>of</strong> a mattress is given in the following table.<br />
Raw Material % by Value Average Weight per Mattress<br />
Foam + Coir 75% Ranges from 5-6 Kgs (Foam only)<br />
to 10-15 Kgs*(Foam & Coir)<br />
Fabric 10% 1-2 Kgs<br />
Packaging and Others 15% 1-2 Kgs<br />
*Depends on the ratio <strong>of</strong> foam and coir used in the mattress and the density. Sleepwell manufactures the<br />
mattresses with densities varying between 10 and 85. Density <strong>of</strong> 1 indicates that the material carries 1 Kg<br />
weight per cubic meter. Generally 60:40 Coir: Foam ratio is used since this reduces the product price and also<br />
helps save excise duty as coir based products (i.e. products with more than 50% by weight <strong>of</strong> Coir) are<br />
exempted from excise duty.
Pillows can be made <strong>of</strong> variety <strong>of</strong> filling material like cotton, feathers and foam etc. Pillows are<br />
available in variety <strong>of</strong> sizes i.e. 21''X14’’, 24’’X16’’ and 26’’X17''. The ticking fabric used for pillow<br />
is also generally made <strong>of</strong> cotton with a GSM lesser than that <strong>of</strong> the fabrics used for mattresses.<br />
Market dynamics and key growth drivers<br />
The market for mattresses and pillows can be broken down into three segments:<br />
• Households<br />
• Hotels<br />
• Hospitals<br />
The demand from the household segment accounts for 90-95 % <strong>of</strong> the total market. Mattresses are<br />
typically purchased with purchase <strong>of</strong> a new bed which in turn is dependent on the number <strong>of</strong><br />
marriages, increasing family size etc. As per industry experts mattresses are generally replaced in 8-<br />
10 years. Awareness about the pros and cons <strong>of</strong> different type <strong>of</strong> mattresses is low, thus, cost plays an<br />
important role in the purchasing decision.<br />
Distribution network is a key factor in this industry. Mattresses and pillows are bulky leading to high<br />
transportation and ware housing costs. The presence <strong>of</strong> a number <strong>of</strong> regional players and relatively<br />
less exports and imports are explained by this fact.<br />
Market size and future forecast<br />
Each mattress requires 5 square meters <strong>of</strong> ticking fabric. Mattress tapes are used in a few mattresses.<br />
The <strong>consumption</strong> norms for the same are given in table below:<br />
Usage <strong>of</strong> various mattress components<br />
Ticking fabric 5 square metre<br />
Price per square metre <strong>of</strong> ticking Rs 40 per square<br />
meter<br />
Tape 13 meter<br />
Usage <strong>of</strong> various pillow components<br />
Ticking fabric 0.4 square meter<br />
Price per square metre <strong>of</strong> pillow<br />
ticking fabric<br />
Rs 30 per square<br />
meter<br />
The domestic demand for mattresses is estimated at 35 million pieces. This translates into a demand<br />
<strong>of</strong> 175 million square meters <strong>of</strong> mattress ticking fabric valued at Rs 700 crore. Considering that 10%
<strong>of</strong> the mattresses use tapes, the demand <strong>of</strong> tapes for mattresses is estimated at 45 million meters<br />
valued at Rs 90 crore.<br />
The domestic demand for pillows is estimated at 130 million pieces thus, demand for pillow ticking<br />
fabric is estimated at around 50 million square meters valued at Rs 155 crore. As per industry sources<br />
the demand for all kind <strong>of</strong> mattresses and pillows is expected to have a moderate growth rate <strong>of</strong> 3%.<br />
The current and future forecast <strong>of</strong> mattresses and pillow components is given below. An inflationary<br />
increase <strong>of</strong> 5% is considered to estimate the market potential.<br />
Doemstic market size for components <strong>of</strong><br />
Mattresses and pillows<br />
Mattress<br />
components<br />
Pillow<br />
components<br />
Mattresses<br />
ticking fabric<br />
Mattress tape<br />
Pillow ticking<br />
fabric<br />
Key manufacturers <strong>of</strong> the product<br />
Quantity<br />
2007-08 2012-13<br />
175 million square<br />
meters<br />
200 million square<br />
meters<br />
Value Rs 700 crore Rs 1000 crore<br />
Quantity 45 million meters 50 million meters<br />
Value Rs 90 crore Rs 130 crore<br />
Quantity<br />
50 million square<br />
meters<br />
60 million square<br />
meters<br />
Value Rs 155 crore Rs 225 crore<br />
Source: <strong>Industry</strong> survey, IMaCS Analysis<br />
Kurlon Ltd. and Sleepwell are the major manufacturers <strong>of</strong> mattresses. Kurlon is the market leader<br />
with a market share <strong>of</strong> 40-45 % <strong>of</strong> the organized market. Kurlon’s products include mattresses,<br />
pillows and home furnishings. Kurlon is also involved in trading home finishing imported from<br />
Taiwan, China, Malaysia, and procured from Ahmadabad, Meerut, Mumbai and Erode. The company<br />
has manufacturing facilities at Bangalore, Bhubaneswar and Gwalior and has plans <strong>of</strong> setting up a<br />
new facility in Northern India. Kurlon sources the required fabric for ticking from various fabnric<br />
manufacturers in Meerut, Kanpur and Mumbai.<br />
Company Production Capacity Sales turnover<br />
Kurlon NA 13 lakh mattresses Rs 339 crore *<br />
Sleepwell<br />
Coir mattress - 1 lakh per month NA<br />
Flexipuff mattress - 0.5 lakh per<br />
month<br />
NA<br />
Pillows - 1 lakh per month NA<br />
Rs 3000 crore*
Imports and Exports<br />
The import figures are given in the following table:<br />
HS Code Description<br />
52083250, 52084140,<br />
52084250, 52084330,<br />
52103230, 52095160,<br />
The export figures are given in the following table:<br />
HS Code Description<br />
52083250, 52084140,<br />
52084250, 52084330,<br />
52103230, 52095160,<br />
Bed ticking ,<br />
<strong>Domestic</strong><br />
*Includes other products apart from mattresses<br />
Imports<br />
Quantity<br />
Source: DGCIS, IMaCS analysis<br />
Imports<br />
(Rs crore)<br />
2007-08 (E) 2007-08 (E)<br />
1.5 lakh square<br />
meters<br />
These exports are estimated to be Rs 3 crore for the year 2012-13.<br />
Quality Control and standards<br />
The relevant BIS standards are given in the following table<br />
BIS Code Description<br />
IS 7933: 1975<br />
Rs 1.2 crore<br />
Source: DGCIS, IMaCS analysis<br />
Specification for Flexible Polyurethane Foam for <strong>Domestic</strong><br />
Mattresses<br />
IS 9491: 1980 Specification for mattress, air<br />
Code <strong>of</strong> practice for packaging thermal insulation<br />
materials: Part 1 Slabs, mattresses and pipe-sections made<br />
IS 13013: Part 1: 1990 <strong>of</strong> fibrous materials<br />
IS 13489: 2000 Textiles - Bed Mattress - Specification<br />
Nonwoven wipes<br />
Bed ticking ,<br />
<strong>Domestic</strong><br />
A wipe is a small piece <strong>of</strong> cloth used for the purpose <strong>of</strong> cleansing or disinfecting. Wipes could be<br />
woven, knitted or nonwoven. Nonwoven wipes have recently gained popularity on account <strong>of</strong> their<br />
excellent absorption and s<strong>of</strong>tness. The product is available as dry wipe as well as wet wipe wherein<br />
the nonwoven fabric is impregnated with a solution.<br />
Imports<br />
Quantity<br />
Imports<br />
(Rs crore)<br />
2007-08 (E) 2007-08 (E)<br />
9500 square<br />
meters<br />
Rs 0.3 crore
Wet wipes are designed for specific application e.g. Baby wipes, Facial wipes, Cleansing wipes, Hand<br />
& body wipes, Moist towelettes, Personal hygiene wipes, Feminine hygiene wipes, Antibacterial<br />
wipes and Medicated wipes. The usage <strong>of</strong> baby wipes is well accepted as a convenient, portable,<br />
hygienic way to keep babies clean. Antibacterial wipes help to sanitise shopping trolleys, restaurant<br />
tables, etc. to reduce the exposure to germs. They also provide an easy way to maintain clean hands<br />
more effectively. Personal care wipes are specifically designed to carry cleansing cremes with specific<br />
ingredients to help remove makeup. Wipes also find application in manufacturing and service<br />
industries especially in food service and health care. The success <strong>of</strong> nonwoven wipes is driven by<br />
their ease-<strong>of</strong>-use, disposability, portability and reduced risk <strong>of</strong> cross-contamination.<br />
Product characteristics<br />
Non-woven wipes are made from viscose, polyester and polypropylene and are available in variety <strong>of</strong><br />
sizes ranging from 2 X 5 square cm to 30 X 40 square cm. Majority <strong>of</strong> nonwoven wipes are<br />
manufactured by Spunlace technology. The wipes are expected to have the following properties:<br />
• Smooth and s<strong>of</strong>t texture<br />
• Good absorbance characteristics<br />
• Good moisture retention properties<br />
Market dynamics and key growth drivers<br />
Busy lifestyle and high disposable income are the key factors for the acceptance <strong>of</strong> wipes. Wet wipes<br />
obviate the need for the use <strong>of</strong> separate ‘wet and dry’ combinations in cleaning tasks thus, allowing<br />
people to perform daily tasks in substantially less time. Currently the demand for wipes is limited in<br />
India but with growing number <strong>of</strong> middle class families, increasing disposable income and changing<br />
lifestyle the demand for wipes is expected to increase in the urban areas. Moreover, product<br />
innovations are further likely to boost the demand. Consumption <strong>of</strong> wipes in foodservice and health<br />
care applications is also expected to grow because <strong>of</strong> heightened health and hygiene concerns.<br />
Market size <strong>of</strong> wipes and future forecast<br />
Based on discussions with industry experts, the current market size for nonwoven wipes is estimated<br />
at 1.8 million square meters valued at Rs. 10 crore. The penetration <strong>of</strong> wipes in the Indian household<br />
sector is very less as compared to the developed countries. With increasing awareness about the<br />
benefits <strong>of</strong> these products and changing lifestyle the <strong>consumption</strong> <strong>of</strong> consumer wipes is expected to<br />
increase. In addition the demand for industrial wipes is also expected to grow. New product<br />
innovations and expanding applications are further expected to boost the demand. The market size for<br />
nonwoven wipes is expected to increase to 3.5 million square meters by 2012-13 (growing at a CAGR
<strong>of</strong> 15%). The market potential for wipes in 2012-13 is estimated to be Rs. 20 crore. No inflationary<br />
increase has been assumed for the price <strong>of</strong> the product.<br />
The current and future forecast <strong>of</strong> non-woven wipes market is given below:<br />
Market size <strong>of</strong> non-woven<br />
wipes<br />
Quantity<br />
2007-08 2012-13<br />
1.8 million square<br />
meters<br />
3.5 million square<br />
meters<br />
Value Rs. 10 crore Rs. 20 crore<br />
Key manufacturers <strong>of</strong> nonwoven wipes<br />
Source: <strong>Industry</strong> survey, IMaCS Analysis<br />
Ginni Filaments Ltd. manufactures wipes made <strong>of</strong> spunlace non-woven fabric. The company started<br />
production in 2006-07. Anjani Nonwovens, a part <strong>of</strong> Anjani Udyog Pvt. Ltd. is also reported to enter<br />
into the manufacturing <strong>of</strong> spunlace nonwoven fabric. The company is reported to invest Rs. 120 crore<br />
to set up a spunlace plant at the Mundra Special Economic Zone (SEZ) in Gujarat. The 7000<br />
MT/annum capacity plant will produce cotton pads and wipes.<br />
Birla Cellulose, the fibre division <strong>of</strong> Aditya Birla group has also entered the disposable natural wipes<br />
category. With a special focus on the institutional segment, Birla Cellulose is planning to tie up with<br />
airlines, travel agencies, pharma companies and schools to promote and build this sector. The<br />
company is currently sourcing the nonwoven fabric and marketing its disposable wipes under brands<br />
‘Kara’ (skincare), ‘Purreta’ (baby care), ‘Prim’ (homecare) and ‘Handy’ (hand santizers).<br />
Manufacturer Year Installed capacity Production Sales (Rs crore)<br />
Ginni Filaments 2006-07 649 lakh pieces 90 lakh pieces Rs 1 crore<br />
2007-08 649 lakh pieces 397 lakh pieces Rs 3.6 crore<br />
Source: <strong>Industry</strong> Survey, Annual reports <strong>of</strong> listed players<br />
Import and Exports <strong>of</strong> wipes<br />
The estimated import figure for wipes is given in the following table:<br />
HS Code Description<br />
63071090/9090, 56031300/1200,<br />
48189000, 48182000,<br />
Baby wipes, Wet wipes,<br />
refreshing wipes, wipes, etc<br />
Source: IBIS, IMaCS analysis<br />
In addition non woven fabric is imported and converted into wipes in India.<br />
Value<br />
(Rs crore)<br />
2007-08 (E)<br />
~Rs 8 crore<br />
Over 50% <strong>of</strong> the imports take place from China and Singapore. Wipes are also imported from Canada,<br />
Germany, USA and UAE.
The export <strong>of</strong> nonwoven wipes is negligible.<br />
Key importers and exporters<br />
Kimberly-Clark Lever Ltd.is a leading player in wipes. The company markets its baby wipes under<br />
the brand name ‘Huggies’. In addition Kimberly-Clark has specialized wipes marketed under the<br />
brand name ‘Wypall’ and ‘Kimtech’.<br />
Raw-materials and machinery<br />
Viscose is the preferred fibre for wipes on account <strong>of</strong> its high absorbency coupled with s<strong>of</strong>tness. Birla<br />
Cellulose is a supplier <strong>of</strong> hollow, chlorine-free, zinc-free and anti-bacterial fibres, which are<br />
environment friendly and are especially suited for applications like wipes. Wipes are also<br />
manufactured using other synthetic fibers as polypropylene, polyester, etc.<br />
Over 50% <strong>of</strong> the nonwoven wipes are manufactured by Spunlace technology. The web formation for<br />
Spunlace production line utilizes carded web making technique. The key machinery used for<br />
production <strong>of</strong> wipes is given below:<br />
• Blow room<br />
• Injection Cards<br />
• Spunlace hydro entanglement line<br />
• Dryer<br />
• Winder<br />
• Slitter<br />
• Folding and cutting line<br />
The key machinery suppliers are:<br />
• Rieter Perfojet, France<br />
• Fleissner GmbH & Co. (Germany)<br />
Mosquito nets<br />
The Mosquito net is an essential item used all over the country for protection from mosquitoes;<br />
therefore the market <strong>of</strong> the item exists through out the year. As other precautions in practice like<br />
Mosquito Repellent Mats, Ointment and coils have various side effects; people prefer the use <strong>of</strong><br />
Mosquito Nets therefore the demand is increasing day by day.<br />
Consumption norms and the market size<br />
Nylon net constitutes around 96% <strong>of</strong> the raw material cost <strong>of</strong> the mosquito net. The process <strong>of</strong><br />
manufacture <strong>of</strong> Nylon Mosquito Net is very simple. A piece <strong>of</strong> Net cut in rectangle size as per<br />
required size. The required rectangle size Net along with Cotton Tape is spread on sewing Machine<br />
and stitch from one corner to the end.
Nylon net <strong>consumption</strong> norm (Mosquito nets industry)<br />
Mosquito nets production (MT) Approx 16,000<br />
No <strong>of</strong> mosquito nets produced 9 million<br />
% <strong>of</strong> nylon net by weight 96%<br />
Average Nylon net usage per net 10 m<br />
Total nylon net usage (Rs crore) Rs 225 crore<br />
Source: Karur HDPEmono-filaments yarn & fabrics Manufacturers Association, <strong>Industry</strong> survey, IMaCS<br />
Analysis<br />
On an average, around 10 metres or 1.5-2 kg <strong>of</strong> nylon net is used for manufacturing 1 mosquito net.<br />
Around 80-100 lakh mosquito nets are manufactured every year in India for domestic use. Assuming<br />
a wastage <strong>of</strong> 5% (as per industry standards), total nylon net usage in the mosquito nets industry is<br />
estimated as Rs 225 crore approximately.<br />
The mosquito nets industry in India has been growing at around 10-15% per year and is expected to<br />
maintain its growth trend in the future.<br />
The current and future forecast <strong>of</strong> Nylon net <strong>consumption</strong> in the mosquito nets industry is given<br />
below:-<br />
Market size <strong>of</strong> mosquito<br />
nets<br />
Nylon net<br />
(in million metres)<br />
Nylon Net value<br />
(in Rs. crore)<br />
2007-08 2012-13<br />
90 million meters 145 million meters<br />
Rs 225 crore Rs 364 rore<br />
Source: <strong>Industry</strong> survey, IMaCS Analysis<br />
The potential market for nylon net in the mosquito nets industry in 2012-13 is estimated at Rs. 462<br />
crore up from Rs 225 crore in 2007-08 (E). No inflationary increase has also been assumed for the<br />
price <strong>of</strong> nylon net. In volume terms, the usage <strong>of</strong> nylon net in the mosquito nets industry is expected<br />
to grow from 90 million metres in 2007-08 to 145 million metres in 2012-13.<br />
The production <strong>of</strong> nylon tyre fabric in India is limited to a large number <strong>of</strong> small-scale producers.<br />
There are as many as 75 small-scale units manufacturing mosquito nets in Karur, Tamil Nadu itself<br />
producing around 170-180 MT <strong>of</strong> mosquito nets per annum (per unit).<br />
Raw-materials for mosquito nets<br />
All the machineries required and raw materials are available locally from local traders. The nylon is<br />
sourced from local players like Reliance and Haldia.<br />
Imports & Exports <strong>of</strong> mosquito nets
The estimated import figures for mosquito nets are as given below:-<br />
HS Code Description<br />
63049270 MOSQUITO NETS<br />
The estimated export figures for mosquito nets are as given below:-<br />
HS Code Description<br />
63049270 MOSQUITO NETS<br />
These exports are estimated to be Rs 4.1 crore for the year 2012-13.<br />
Quality Control and Standards -- As per IS 14953:2001<br />
Imports Imports<br />
Quantity Value<br />
2007-08(E) 2007-08(E)<br />
0.75 million Approx. Rs 7.5<br />
nos.<br />
crore<br />
Source: DGCIS, IMaCS Analysis<br />
Exports Exports<br />
Quantity Value<br />
2007-08(E) 2007-08(E)<br />
0.12 million Approx. Rs 3.5<br />
nos.<br />
crore<br />
Source: DGCIS, IMaCS Analysis
PROTECH<br />
Protech is an ensemble <strong>of</strong> textile products and related material used in the manufacture <strong>of</strong> various<br />
protective clothing for personnel working in hazardous environment. The protective clothing includes<br />
garments and related paraphernalia for protection from harmful chemical environment, extreme<br />
temperature environments, low visibility, ballistic protection, etc.<br />
Defence is one <strong>of</strong> the largest consumers <strong>of</strong> protective <strong>textiles</strong>. The Indian Defence Forces with a total<br />
strength <strong>of</strong> around 1.5 mn individuals comprising the army, navy, air force. Approximately 25-30 %<br />
<strong>of</strong> the troops are involved in high risk, counter insurgency & special operations in super high attitude<br />
areas and require protective clothing. In addition, around 1.2 mn individuals are present in<br />
paramilitary forces and other security forces. In addition, defence also requires uniforms / special<br />
uniforms which have not been classified as <strong>technical</strong> <strong>textiles</strong>.<br />
The usage <strong>of</strong> protective <strong>textiles</strong> in defence comprises the following:-<br />
1. Bullet pro<strong>of</strong> jackets<br />
2. NBC suits<br />
3. High altitude clothing<br />
4. Fire retardant apparel<br />
The annual requirement <strong>of</strong> these products for defence installations 22 is given below:-<br />
Items Defence requirement<br />
(units)<br />
High altitude clothing Around 1.5 - 2 lakh<br />
NBC suits Around 50,000<br />
FR suits Around 1 - 2 lakhs<br />
Bullet pro<strong>of</strong> jackets Over 2 lakhs<br />
The total usage <strong>of</strong> protective <strong>technical</strong> <strong>textiles</strong> in defence is estimated as around Rs 1,000 crore. With<br />
increasing terror threats, the usage <strong>of</strong> bullet pro<strong>of</strong> jackets and other protective clothing is set to rise.<br />
For example, additional orders were placed in Jan 2009 to procure 20,000 bullet pro<strong>of</strong> jackets on an<br />
emergent basis by the Ministry <strong>of</strong> Home Affairs (MHA) for central police organisation including the<br />
National Security Guards and the Central Reserve Police Force.<br />
Most <strong>of</strong> these requirements are catered to by imports and part <strong>of</strong> it is supplied by domestic players<br />
among which Ordinance Factory Board (OFB) is the largest supplier. OFB receives orders from<br />
22 Analysis based on data/information received from Defence. IMaCS has made appropriate adjustments because <strong>of</strong><br />
insufficient data.
Director General <strong>of</strong> Ordinance Supplies (DGOS) which in turn are given based on the requirements <strong>of</strong><br />
Master General <strong>of</strong> Ordnance (MGO). OFB receives orders for these products from the MGO on an<br />
annual requirement basis. OFB manufactures NBC suits, high altitude clothing (also known as<br />
Extreme cold climate clothing or ECC clothing), fire-retardent clothing and tents. High altitude<br />
clothing includes jackets, trousers, caps and gaiters. At present, only two types <strong>of</strong> tents are made -<br />
Tent extendable and Arctic tents. By 2010, OFB also has plans to manufacture Bullet pro<strong>of</strong> jackets to<br />
meet the growing domestic demand. In addition, OFB also manufactures parachutes (supply dropping<br />
parachutes, aircraft brake parachutes, parachutes for paratroopers and aircraft pilot ejection<br />
parachutes), sleeping bags and mattresses which are not classified under protech applications.<br />
OFB is the only indigenous manufacturer for the NBC suits and high altitude clothing in India. The<br />
total fabric <strong>consumption</strong> <strong>of</strong> OFB is estimated as around 25,000 metres. OFB has a turnover <strong>of</strong> Rs 700<br />
crore. Non woven and rubberized fabrics <strong>consumption</strong> is less than 2% <strong>of</strong> total fabric <strong>consumption</strong>.<br />
Non woven fabric requirement is only for NBC suits.<br />
Production details <strong>of</strong> OFB<br />
Items Production<br />
(2007-08)<br />
Expected<br />
growth rate<br />
High altitude clothing 5,000-7,000 nos. 15%<br />
NBC suits 22,000 nos. 15%<br />
Sleeping Bags 50,000 nos. 5%<br />
Mattresses (Kapok) 1.5 lakh nos. 5%<br />
Tents 15,000 nos. 8-10%<br />
Source: <strong>Industry</strong> survey<br />
The <strong>technical</strong> textile products covered under Protech are as given below:-<br />
1. Ballistic protective clothing – Bullet-pro<strong>of</strong> jackets<br />
2. Fire retardant apparels<br />
3. Fire retardant fabrics (for furnishings)<br />
4. Radiation protection textile/NBC suits<br />
5. High visibility clothing/Foul weather clothing<br />
6. Chemical protection clothing<br />
7. Industrial gloves/Cut. Slash protection<br />
8. High altitude clothing<br />
The products in the Protech category are typically 100% <strong>technical</strong> textile products with the exception<br />
<strong>of</strong> industrial gloves (where <strong>technical</strong> textile is fully or partly used in the end product). The <strong>technical</strong><br />
textile <strong>consumption</strong> under Protech is estimated as around Rs 1,259 crore. The key Protech products<br />
are high altitude clothing, bullet-pro<strong>of</strong> jackets and fire retardant fabrics which account for 52%, 20%<br />
and 14% <strong>of</strong> the <strong>technical</strong> textile <strong>consumption</strong> respectively in Protech segment. The fire retardant
apparels and high visibility clothing each accounts for around 5% <strong>of</strong> the usage <strong>of</strong> <strong>technical</strong> <strong>textiles</strong><br />
under Protech, rest NBC suits, chemical protection clothing and industrial gloves constitute less than<br />
2% each.<br />
The domestic <strong>consumption</strong> <strong>of</strong> <strong>technical</strong> <strong>textiles</strong> under Protech is expected to increase from around Rs<br />
1,259 crore in 2007-08 to around Rs 2,021 crore by 2012-13.The demand for the Protech products is<br />
dependent on the improvements in worker safety practices, fire protective standards for construction<br />
and increase in defence sector spending on protective clothing. In the medium term (next 5 years), the<br />
protective <strong>textiles</strong> industry is expected to achieve growth at the rate <strong>of</strong> 9-10% year on year.<br />
Amongst Protech products, high growth is expected in the fire retardant fabric, high visibility clothing<br />
material and chemical protective clothing.<br />
Summary <strong>of</strong> the market-sizing for Protech<br />
Ballistic<br />
Protective<br />
Clothing<br />
Fire<br />
Retardant<br />
Apparels<br />
Fire<br />
Retardant<br />
fabrics<br />
NBC suits<br />
High<br />
Visibility<br />
Clothing /<br />
Reflective<br />
wear*<br />
Quantity<br />
Value<br />
Quantity<br />
Value<br />
Quantity<br />
Value<br />
Quantity<br />
Value<br />
Quantity<br />
Value<br />
Production Imports Exports<br />
1.1 lakh<br />
pieces<br />
Rs 253.6<br />
crore<br />
7.7 lakh<br />
pieces<br />
Rs 72.8<br />
crore<br />
6 million<br />
meters<br />
Rs 180<br />
crore<br />
22,000<br />
pieces<br />
< 100<br />
pieces<br />
Rs 0.64<br />
crore<br />
0.25 lakh<br />
pieces<br />
Rs 2.6<br />
crore<br />
2007-08 2012-13<br />
0.1 lakh<br />
pieces<br />
<strong>Domestic</strong><br />
Consumption<br />
Around 1<br />
lakh pieces #<br />
<strong>Domestic</strong><br />
Consumption<br />
Over 2 lakhs#<br />
Rs 4.2 crore Rs 250 crore # Rs 500 crore #<br />
0.42 lakh<br />
pieces<br />
- -<br />
7.9 lakh<br />
pieces<br />
11.6 lakh<br />
pieces<br />
Rs 4.4 crore Rs 71 crore Rs 104 crore<br />
6 million<br />
meters<br />
15 million<br />
meters<br />
- - Rs 180 crore Rs 450 crore<br />
- -<br />
22,000<br />
pieces #<br />
50,000 pieces<br />
Rs 22 crore - - Rs 22 crore # Rs 50 crore<br />
-<br />
-<br />
6 million<br />
nos.<br />
Fabric<br />
equivalent<br />
Rs 66<br />
crore<br />
- 6 million nos.<br />
- Rs 66 crore<br />
12.1 million<br />
nos.<br />
Rs 132.7<br />
crore<br />
Export<br />
Potential<br />
Rs 4.6<br />
crore<br />
Rs 5.6<br />
crore<br />
-<br />
-<br />
-
Chemical<br />
Protection<br />
Clothing<br />
(CPC)*<br />
Industrial<br />
gloves<br />
(TT<br />
component)<br />
High<br />
Altitude<br />
Clothing<br />
TOTAL<br />
Quantity<br />
Value<br />
Quantity<br />
Value<br />
Quantity<br />
Value<br />
Value<br />
Production Imports Exports<br />
-<br />
-<br />
100.6<br />
million<br />
pieces<br />
Rs 43.1<br />
crore<br />
7,000<br />
pieces*<br />
Rs 0.25<br />
crore<br />
Rs 571<br />
crore<br />
78,000<br />
pieces<br />
Fabric<br />
equivalent<br />
Rs 10.87<br />
crore<br />
2.1 million<br />
pieces<br />
Rs 0.4<br />
crore<br />
0.18<br />
million<br />
pieces<br />
Fabric<br />
equivalent<br />
/ garments<br />
Rs 650<br />
crore<br />
Rs 731<br />
crore<br />
2007-08 2012-13<br />
<strong>Domestic</strong><br />
Consumption<br />
- 78,000 pieces<br />
-<br />
80.5<br />
million<br />
pieces<br />
Rs 34.5<br />
crore<br />
-<br />
Rs 10.87<br />
crore<br />
22.2 million<br />
pieces<br />
<strong>Domestic</strong><br />
Consumption<br />
1,14,000<br />
pieces<br />
Rs 20 crore<br />
35 million sq<br />
m<br />
Rs 9 crore Rs 14.1 crore<br />
0.18 million<br />
pieces<br />
0.21 million<br />
pieces<br />
- Rs 650 crore Rs 750 crore<br />
Rs 43<br />
crore<br />
Rs 1,259<br />
crore<br />
Rs 2,021<br />
crore<br />
* Predominantly, the fabric is imported under HS codes 5602 / 5603 and the protective apparel is manufactured<br />
in India<br />
# Potential demand, actual demand is constrained by supply shortage<br />
As per ECTT report, the potential market sizing for 2007-08 was as given below:-<br />
Market size<br />
(ECTT report)<br />
Fire Retardant Textiles<br />
(A) F. R. Apparels<br />
(B) Speciality F. R.<br />
Apparel for Defence<br />
2001-02 2007-08 (P)<br />
Quantity 1.00 million pieces 1.4 million pieces<br />
Value Rs 27.50 crore Rs 38.50 crore<br />
Quantity 50,000 nos. 1,75,000 nos.<br />
Value Rs 150 crore Rs 525 crore<br />
Export<br />
Potential<br />
-<br />
Rs 44<br />
crore<br />
-<br />
Rs 54.3<br />
crore
Market size<br />
(ECTT report)<br />
(C) F. R. Upholstery /<br />
Furnishing (General<br />
public)<br />
Ballistic Protective<br />
Clothing<br />
Bullet Pro<strong>of</strong> Jackets<br />
2001-02 2007-08 (P)<br />
Quantity 0.5 million metres 5 million metres<br />
Value Rs 20 crore Rs 200 crore<br />
Quantity 50,000 nos. 1,75,000 nos.<br />
Value Rs 150 crore Rs 525 crore<br />
Total Value Rs 347.5 crore Rs 1,288.5 crore<br />
Capital Employed and Pr<strong>of</strong>itability <strong>of</strong> key player <strong>of</strong> Protech<br />
Company Name<br />
Capital Employed<br />
(Rs crore)<br />
Net Pr<strong>of</strong>it Margin<br />
(%)<br />
2006-07 2007-08 2006-07 2007-08<br />
Tata Advanced Materials Ltd. 23.7 9.9 -3.6% -21.8%<br />
Source: Prowess Database, IMaCS Analysis<br />
Protech segment <strong>of</strong> <strong>technical</strong> <strong>textiles</strong> is estimated to provide employment to 2,000 people 23 <strong>of</strong> whom<br />
number <strong>of</strong> <strong>technical</strong> 24 employees is estimated at 1,500 and number <strong>of</strong> non-<strong>technical</strong> employees is<br />
estimated at 500.<br />
The key impediments to the growth <strong>of</strong> Protech products in India are:-<br />
1. Lower level <strong>of</strong> awareness and lack <strong>of</strong> stipulations mandating usage <strong>of</strong> protective <strong>textiles</strong><br />
(industrial gloves / workwear, flame retardant apparels/fabric)<br />
2. Demand for several Protech products like high altitude clothing, bullet pro<strong>of</strong> jackets is<br />
inconsistent across years leading to low capacity utlisations<br />
3. Most <strong>of</strong> the production is made-to-order<br />
4. The entry barriers are quite high as these are high technology products<br />
5. The raw material fibres like aramid, nylon-66 etc. are primarily imported resulting in higher<br />
production costs<br />
23 Employment has been estimated based on the analysis <strong>of</strong> primary and secondary data available for the<br />
<strong>technical</strong> textile manufacturers. This excludes the employees <strong>of</strong> Ordinance Factory Board. IMaCS has made<br />
appropriate adjustments because <strong>of</strong> insufficient data.<br />
24 Technical includes managerial staff and skilled labour whereas non-<strong>technical</strong> includes unskilled labour.
Bullet-pro<strong>of</strong> jacket<br />
Ballistic protection involves protection <strong>of</strong> the wearer’s body and eyes against projectiles and<br />
fragments <strong>of</strong> various shapes, size and impact velocity. The projectiles are a part <strong>of</strong> ammunition shot<br />
through weapons such as pistols, revolvers and rifles. Ballistic protection equipments have been used<br />
for ages, the earliest form <strong>of</strong> protection was metallic suit. The ballistic protection equipments evolved<br />
from metallic to natural fibre fabric (layers <strong>of</strong> silk). With the advent <strong>of</strong> synthetic fibres, all the ballistic<br />
protection equipment was made using synthetic fibres like aromatic polyamide (Aramid), Ultra High<br />
Modulus Polyethylene (UHMPE) and p - phenylene-2, 6-benzobisoxazole (PBO).<br />
The bullet-pro<strong>of</strong> jackets protect the bearer by dissipating the kinetic energy <strong>of</strong> the projectile into the<br />
equipment layers by deformation <strong>of</strong> the fabric layer cutting across yarns. For example, when a<br />
projectile hits a woven fabric a shock wave or strain wave is introduced in the fabric, which spreads<br />
through its yarns. The primarily impacted yarns interact with other yarns by means <strong>of</strong> couplings at the<br />
cross over points <strong>of</strong> the fabrics. The strain wave can thus be pushed over a large number <strong>of</strong> yarns. The<br />
positive effect <strong>of</strong> this mechanism is that the energy will be absorbed over a large area. The velocity <strong>of</strong><br />
the strain wave dissipation <strong>of</strong> energy would depend upon the modulus <strong>of</strong> the constituent <strong>of</strong> the fabric<br />
Product characteristics<br />
The bullet-pro<strong>of</strong> jackets are made from Aramid, Nylon 66, UHMPE, Carbon fibres or PBO. Each<br />
jacket weighs about 5 kilograms and is expected to have the following properties:<br />
1. Light weight<br />
2. Comfortable to wear<br />
3. Facilitate body movement<br />
4. Ability to spread the projectile energy efficiently<br />
Each jacket has about 0.6 square metres <strong>of</strong> non-woven material weighing around 750 GSM. Bulk <strong>of</strong><br />
the jacket is made from woven material as the combination <strong>of</strong> weave and the fibre characteristics<br />
influence the energy absorption characteristics <strong>of</strong> bullet-pro<strong>of</strong> jacket. The synthetic fibre (Aramid)<br />
used in production <strong>of</strong> bullet-pro<strong>of</strong> jackets is primarily imported (DSM Netherlands/DuPont etc) with<br />
the exception <strong>of</strong> carbon glass fibre.<br />
Market dynamics and key growth drivers
With the rising trend <strong>of</strong> crime, violence and terrorism, the demand for bullet-pro<strong>of</strong> jackets is rising as<br />
well. The major customers <strong>of</strong> bullet-pro<strong>of</strong> jackets are Defence, Paramilitary forces engaged in counter<br />
terrorism/insurgency operations and Law enforcement agencies (police). Despite high demand, there<br />
are only a few suppliers in the market. The demand from Indian paramilitary forces alone is estimated<br />
as up to 2 Lakh pieces per annum. But, most <strong>of</strong> the demand is unmet due to supply shortage. After the<br />
recent terrorist activities, the ministry <strong>of</strong> home affairs (MHA) ordered the purchase <strong>of</strong> 20,000 bullet-<br />
pro<strong>of</strong> jackets for central police organisation including the National Security Guards and the Central<br />
Reserve Police Force. In addition, several police departments are in the process <strong>of</strong> tendering for these<br />
jackets, though the demand from police departments is quite small, usually between 5 to 200 jackets<br />
only. The North-eastern states procure over 1,500 bullet pro<strong>of</strong> jackets, though the purchases differ<br />
across years. In addition, the retail demand <strong>of</strong> these jackets is estimated at around 500 to 1,000 jackets<br />
per annum.<br />
Though there is considerable potential demand for these jackets, the supply shortage is leading to<br />
demand build-up over the years. There is a strong need to increase the supply <strong>of</strong> bullet pro<strong>of</strong> jackets to<br />
keep pace with the growing demand.<br />
Key manufacturers <strong>of</strong> bullet-pro<strong>of</strong> jacket<br />
The key manufacturers <strong>of</strong> bullet-pro<strong>of</strong> jacket are given below:<br />
1. Tata Advanced Material Limited (TAML) – Sales: Approximately 70,000-75,000 pieces per<br />
annum.<br />
2. Anjani Technoplast<br />
3. Southern Group <strong>of</strong> Industries Pvt. Limited<br />
4. M Kumar Udyog<br />
5. Isolar India – Glass based bullet-pro<strong>of</strong> jackets<br />
6. Secure Mobile<br />
TAML has a market share <strong>of</strong> 80% in the bullet-pro<strong>of</strong> jacket market in India.<br />
Market size <strong>of</strong> and future forecast<br />
The market for bullet-pro<strong>of</strong> jacket is more from the supply perspective as compared to demand. The<br />
total domestic size in India is around 1 lakh pieces <strong>of</strong> bullet-pro<strong>of</strong> jackets valued at Rs 250 crore.<br />
The current and future forecast <strong>of</strong> the domestic usage <strong>of</strong> bullet-pro<strong>of</strong> jacket is given below:<br />
Market size<br />
2007-2008 2012-2013
Quantity Value Quantity Value<br />
(No. <strong>of</strong> pieces) (Rs crore) (No. <strong>of</strong> pieces) (Rs crore)<br />
Bullet pro<strong>of</strong> jackets Around 1 lakh pieces Rs 250 crore Over 2 lakhs* Rs 500 crore<br />
Source: <strong>Industry</strong> survey, IMaCS Analysis<br />
* Potential demand, actual demand is constrained by supply shortage<br />
The potential demand <strong>of</strong> bullet pro<strong>of</strong> jackets is already more than 2 lakh pieces per annum. But, the<br />
supply shortage has constrained the actual demand (satisfied by production) is only around 1 lakh<br />
pieces <strong>of</strong> bullet pro<strong>of</strong> jackets (estimated). Even at conservative levels, the potential demand for bullet-<br />
pro<strong>of</strong> jacket is expected to be far in excess <strong>of</strong> 2 lakh pieces by 2012 – 13. The market potential in<br />
2012 – 13 is estimated to be at least Rs. 500 crore. However, the actual demand will be constrained by<br />
the supply availability in India (as these jackets are generally not imported). This assumes no spikes in<br />
demand due to sudden jumps in Defence spending (influenced by events like deteriorating internal<br />
security situation, border conflict etc).<br />
Import and Exports <strong>of</strong> Ballistic Clothing<br />
The import figures for protective jackets are as given below:-<br />
HS<br />
Code<br />
62104010<br />
Description<br />
Personal protective garments (Bullet<br />
pro<strong>of</strong> jackets, bomb disposal jackets etc)<br />
Value<br />
(Crore Rs)<br />
2006-<br />
07<br />
The export figures for bullet-pro<strong>of</strong> jackets are as given below:-<br />
HS<br />
Code Description<br />
62104010<br />
Personal protective garments (Bullet<br />
pro<strong>of</strong> jackets, bomb disposal jackets, etc)<br />
0.27 0.64<br />
Value (Rs<br />
Crore)<br />
2006-<br />
07<br />
2007-08 Unit<br />
2007-<br />
08<br />
27.00 3.63<br />
Imports (Quantity)<br />
Pieces<br />
(thousands)<br />
200<br />
6-07<br />
2007-<br />
08<br />
0.02 0.03<br />
Source:IBIS, IMaCS Analysis<br />
Exports (Quantity)<br />
Unit<br />
Pieces in<br />
thousands<br />
2006-<br />
07<br />
2007-<br />
08<br />
28.32 9.92<br />
Source: IBIS, IMaCS Analysis<br />
These exports are estimated to be Rs 4.6 crore for the year 2012-13.<br />
Quality Control and Standards<br />
NIJ standards are followed for production <strong>of</strong> bullet-pro<strong>of</strong> jackets. The NIJ standards are based on<br />
specific threat levels.<br />
Fire/Flame retardant fabric (for furnishings)<br />
The normal textile consists <strong>of</strong> highly ignitable materials and turn into primary source <strong>of</strong> fire<br />
percolation in case <strong>of</strong> a break-out. However fabrics are required for aesthetic appeal. Fire retardant<br />
fabrics per form both the task <strong>of</strong> providing aesthetics to the surroundings and preventing spread <strong>of</strong>
fire. The there are typically two major categories <strong>of</strong> fire retardant fabrics which are coated fabric and<br />
inherently fire retardant fabric.<br />
Product characteristics<br />
The fire retardant fabrics are primarily <strong>of</strong> two types:<br />
1. 100% cotton fabric with coating <strong>of</strong> fire retardant chemical.<br />
2. Inherently fire retardant fabric.<br />
The cotton fabrics are coated with fire retardant chemical in a bath which results in a layer <strong>of</strong> fire<br />
retardant getting formed on the cotton surface. Generally, PYROVATEX® from CIBA is generally<br />
used as fire retardant coating. The weave and the basis weight <strong>of</strong> the cotton fabric too decide the<br />
performance <strong>of</strong> this fabric. However, incomplete coverage <strong>of</strong> fire retardant chemical reduces the<br />
performance with wear and tear, cracking, flaking, bending and aging.<br />
The other type <strong>of</strong> fabric is the one which uses inherently fire retardant fibres. These are modified<br />
polyester fibre with permanent fire retardant properties. The world leader in fire retardant fabric is<br />
Trevira® a Reliance Netherlands B.V. brand. The fibre is obtained after high level <strong>of</strong> polyester<br />
modification. The fabric made from inherently fire retardant fibres results in uniform fire retardant<br />
features. The other fibres used for fire retardant fabric are:<br />
Generic name Fibre Manufacturer<br />
Aramid (Meta) Nomex DuPont<br />
Aramid (Para) Kermel/Kevlar/Twaron Rhone-Poulence/ DuPont/<br />
Akzo (Holland)<br />
Modacrylic SEF/ Kanecaron Monsanto (Italy)/ Kaneka<br />
(Japan)<br />
Polyamide P84 Lenzing (Austria)<br />
Vinal Vinex FR9B Westex<br />
The typical characteristics <strong>of</strong> the fire retardant fabric are:<br />
1. Very low fume toxicity in fire<br />
2. High tear and abrasion resistance<br />
3. Breathable and comfortable<br />
4. Anti decay and Anti mould<br />
Source: Journal <strong>of</strong> Textile Association, May-June 2007
5. Crease resistance<br />
6. High dimensional stability<br />
7. No fading and excellent colour tone<br />
Market dynamics and key growth drivers<br />
The key industries which drive the <strong>of</strong>f-take <strong>of</strong> fire retardant fabric are given below:<br />
1. All building and constructions need to get fire safety clearance from the fire department.<br />
However these clearances are more from the construction perspective rather than furnishing<br />
perspective. With boom in retail and real estate there has been rapid emergence <strong>of</strong> shopping<br />
complex, malls, cinema multiplex etc. There is need <strong>of</strong> fire retardant fabrics in these areas<br />
from the security point <strong>of</strong> view.<br />
2. Airlines, Railways and Ships are another key market<br />
3. Office furnishings and hospitals and another key sector<br />
The fabrics find application in curtains, sheers, upholstery, stage curtains, blankets, bedding, wall<br />
coverings and blinds.<br />
However the awareness <strong>of</strong> these materials is low and there is no regulation on usage <strong>of</strong> these materials<br />
from the safety perspective which hinders the market <strong>of</strong>f-take.<br />
Key manufacturers <strong>of</strong> fire retardant fabric<br />
The key manufacturers <strong>of</strong> fire retardant fabric are given below:<br />
1. Chemical coated fire retardant fabrics<br />
a. Rajasthan Weaving and Spinning Mills Limited – 70% <strong>of</strong> fire retardant fabric<br />
protection is coated fabric. The company had a production <strong>of</strong> 1.7 lakh metres in 2005-<br />
2006.<br />
b. Jaya Shree Textile – Capacity: 2 million meters per annum<br />
The chemical used in fire retardant treatment is imported. ‘Pyrovatex’ is the chemical used for<br />
coating and supplied by CIBA in India.<br />
2. Inherently fire retardant fabric<br />
a. Trevira from Reliance Netherlands B.V – these fibres are primarily imported<br />
b. Rajasthan Weaving and Spinning Mills Limited – Produces Curtains and upholstery<br />
fabric with a product mix <strong>of</strong> 70% curtains and 30% upholstery fabric. Of the total fire<br />
retardant fabric production 30% is inherently fire retardant. The source <strong>of</strong> fire<br />
retardant fibre is Trevira.
In addition, Delkon Textile Pvt. Ltd., Haryana has been manufacturing and supplying fire retardant<br />
fabrics since the year 2000. Till date, they have supplied 50,000 mts <strong>of</strong> fire retardant <strong>textiles</strong>. In 2008-<br />
09 (9 months), they have supplied 21,000 mts (approx.) <strong>of</strong> fire retardant curtain fabric woven from<br />
inherent fire retardant yarns. They have capacity to manufature 2,75,000 mts per year <strong>of</strong> Fire<br />
Retardant Fabrics.<br />
Market size and future forecast<br />
The market for fire retardant fabric is estimated to be around five lakh meters per month based on the<br />
inputs <strong>of</strong> industry players. The average price <strong>of</strong> fire retardant fabric is approximately Rs. 300 per<br />
meter.<br />
The current and future forecast <strong>of</strong> the domestic usage <strong>of</strong> fire retardant apparels is given below:<br />
Market size<br />
Fire Retardant fabrics 2007-08 2012-13<br />
Quantity (million metre) 6 15<br />
Rs 180 Rs 450<br />
Value (Rs. Crore) crore crore<br />
Source: <strong>Industry</strong> survey, IMaCS Analysis<br />
The market size for fire retardant fabrics is estimated at approximately 6 million meters valued at Rs.<br />
180 crore. The demand for fire retardant fabric is expected to grow at a rate <strong>of</strong> 20% per annum to<br />
increase to around 15 million meters by 2012–13. The market potential in 2012–13 is estimated to be<br />
around Rs. 450 crore.<br />
Import and Exports<br />
The chemical required for coating is imported where as the base fabric is source locally. In case <strong>of</strong><br />
inherently fire retardant fabrics, the discussion with industry players has revealed that the required<br />
yarn is imported and the fabrics are manufactured locally.<br />
Raw-materials<br />
Coated fire retardant fabric: The base cloth is 100% cotton generally. The strength <strong>of</strong> the fabric is<br />
dictated by the cotton yarn and basis weight <strong>of</strong> the cotton fabric. By using higher GSM <strong>of</strong> the fabric,<br />
its weight strength loss can be delayed. The cotton fabric <strong>of</strong> desired weave and basis weight is treated<br />
with fire retardant chemicals and a chemical bath and processed further to give the finished fabric.<br />
The chemicals used are PYROVATEX® and PYROGUARD®.
Inherently fire retardant fabric: The fabric is made from fire retardant fibre like Trevira. The fabric<br />
characteristics are decided by the weave and basis weight. The filament yarn used is in the range <strong>of</strong> 50<br />
– 1350 dtex.<br />
Quality Control and Standards<br />
Fire retardant furnishing fabrics are covered under BIS: IS: 13501:1992 and IS: 11871:1986 and IS:<br />
12777:1989. However major manufacturer <strong>of</strong> fibre and fabric adhere to British and other European<br />
standards.
Fire /Flame retardant apparel<br />
The fire/flame retardant apparels have an industrial need as they <strong>of</strong>fer protection from fire and other<br />
heat intensive tasks. Flame, heat and splashes <strong>of</strong> molten metal etc. are hazards in many heavy<br />
engineering working conditions. The fire retardant apparels are used in refineries, iron and steel<br />
plants, aluminum plants and welding industries.<br />
Product characteristics<br />
The fire retardant apparels can be manufactured from two varieties <strong>of</strong> fabric: 100% cotton fabric with<br />
flame retardant coating or fabric made <strong>of</strong> inherently flame retardant fibre. The typical characteristics<br />
<strong>of</strong> the apparel are:<br />
1. Flame resistance – must not catch fire<br />
2. Should be breathable<br />
3. Easy to wear<br />
4. Light weight<br />
5. Should have high abrasion resistance<br />
The chemical generally used for coated fire retardant fabric is PYROVATEX® from CIBA. The<br />
apparel made from coated fabric generally has a basis weight <strong>of</strong> 250-350 GSM. The fabric used could<br />
be either woven or knitted. The coated fabric which accepted worldwide could have flaws due to<br />
incomplete coverage <strong>of</strong> fire retardant chemical on the fabric surface which would pose threat with<br />
aging.<br />
The other type <strong>of</strong> fabric used for flame retardant apparel is a one which is inherently flame retardant.<br />
Following are a few fibre retardant fibres used <strong>of</strong> this production <strong>of</strong> apparel:<br />
Generic name Fibre Manufacturer<br />
Aramid (Meta) Nomex DuPont<br />
Aramid (Para) Kermel/Kevlar/Twaron Rhone-Poulence/ DuPont/<br />
Akzo (Holland)<br />
Modacrylic SEF/ Kanecaron Monsanto (Italy)/ Kaneka<br />
(Japan)<br />
Polyamide P84 Lenzing (Austria)<br />
Vinal Vinex FR9B Westex<br />
Market dynamics and key growth drivers<br />
Source: Journal <strong>of</strong> Textile Association, May-June 2007
The market <strong>of</strong> fire retardant apparels is primarily driven by increased awareness, international level <strong>of</strong><br />
safety standard in industrial workplace and mandatory safety norms for protection <strong>of</strong> workers. The<br />
fire retardant apparels are generally used in:<br />
1. Iron and steel industry-some <strong>of</strong> the big steel producers such as Tata Steel, Steel Authority <strong>of</strong><br />
India Ltd, Ispat Industries and Essar Steel are making significantly higher investments in this<br />
area.<br />
2. Welding industry<br />
3. Oil Refineries<br />
Large Heavy <strong>Industry</strong> establishments such as SAIL require around 10000 pieces per annum on an<br />
average. Defence establishments require around 2 lakh pieces <strong>of</strong> fire retardant apparels.<br />
The manufacturers <strong>of</strong> fire retardant apparels in India generally tend to export a major part <strong>of</strong> their<br />
production (two-third or more). The awareness level being low only leading heavy industries follow<br />
necessary safety standards. With increasing emphasis on safety standards fire retardant apparel<br />
industry is expected to grow at around 8% per annum.<br />
Key manufacturers <strong>of</strong> fire retardant apparels<br />
Ordinance Factory Board manufactures the FR apparels for defence usage in India. For fire retardant<br />
fabrics, inherently flame retardant fabrics are used for clothing (while chemical coatings are used for<br />
tents). The other key manufacturers <strong>of</strong> fire retardant apparels are given below:<br />
Company Capacity Production Units<br />
Tara Lohia Pvt. Limited 2.5-3 2.5-3 Lakh pieces per annum<br />
Mallcom India Limited 6 1-2 Lakh pieces per annum<br />
Chandramukhi Impex - 0.1-0.15 Lakh pieces per annum<br />
Modern Apparels - 0.1 Lakh pieces per annum<br />
In addition to these key players there is large number <strong>of</strong> small producers <strong>of</strong> fire retardant apparels<br />
however the quality and standards followed by these units is usually suspect. Several manufacturers<br />
like Kusumgar Corporates supply fire retardant fabrics for defence purposes.<br />
Market size <strong>of</strong> and future forecast<br />
The market for fire retardant apparels is driven by demand from few big players in refining, iron and<br />
steel and other heavy engineering companies. The price <strong>of</strong> good quality fire retardant apparel
manufactured using inherently fire retardant fabric (using specialty FR yarn) ranges from Rs. 1500 to<br />
Rs. 3000, which are predominantly used by defence forces. The normal fire retardant apparel ranges<br />
from Rs 250 to Rs 500 per piece. The domestic market in India is estimated at 7.9 lakh pieces worth<br />
Rs. 71 crore.<br />
The current and future forecast <strong>of</strong> the domestic usage <strong>of</strong> fire retardant apparels is given below:<br />
Market size<br />
Fire Retardant Apparels 2007-08 2012-13<br />
Quantity (Lakh pieces) 7.9 11.6<br />
Rs 71 Rs 104<br />
Value<br />
crore crore<br />
Source: <strong>Industry</strong> survey, IMaCS Analysis<br />
The demand for fire retardant apparel is expected to increase to 11.6 lakh pieces by 2012 – 13<br />
registering a growth rate <strong>of</strong> 8% per annum. The market potential in 2012 – 13 is estimated at Rs 104<br />
crore.<br />
Import and Exports <strong>of</strong> fire retardant apparels<br />
The import figures for fire retardant apparels are as given below:-<br />
HS Code Description Value (In Rs. Crore) Imports (Quantity)<br />
62104090<br />
Other personal<br />
protective<br />
garments *<br />
2006-07<br />
2007-<br />
08(E)<br />
0.5876 2.6112<br />
Unit<br />
Number <strong>of</strong><br />
Pieces in<br />
thousands<br />
2006-<br />
07<br />
2007-<br />
08(E)<br />
12.98 25.08<br />
Source:DGCIS, IMaCS Analysis<br />
*Other products are also imported under this HS code<br />
The export figures for fire retardant apparels are as given below:-<br />
HS Code Description Value (In Rs. Crore) Exports (Quantity)<br />
62104090<br />
Other personal<br />
protective<br />
garments*<br />
2006-07<br />
2007-<br />
08(E)<br />
5.1573 4.418267<br />
Unit<br />
Number <strong>of</strong><br />
Pieces in<br />
thousands<br />
2006-<br />
07<br />
2007-<br />
08(E)<br />
117.56 42.03<br />
Source: DGCIS, IMaCS Analysis<br />
*Other products are also exported under this HS code<br />
These exports are estimated to be Rs 5.6 crore for the year 2012-13.<br />
Raw-materials
The manufacturing process generally involves cutting the fabric and stitching/sewing the fabric<br />
together based on the requirement. The thread used for sewing is also fibre retardant. The threads<br />
generally used are – Nomex, Kevlar, Fibreglass, Carbon and Quartz. The work-in-progress apparel is<br />
further fixed with reflective tapes and other materials as per the specifications.<br />
Quality Control and Standards<br />
The companies in India follow the European Standard like EN 512 based on the level <strong>of</strong> protection<br />
need to be <strong>of</strong>fered to the person wearing the apparel.
Nuclear Biological and Chemical (NBC) suits/Hazmat suits<br />
Hazardous material (Hazmat) suits were designed to protect users handling hazardous waste material<br />
such chemicals, radioactive material etc. A more specialized variety <strong>of</strong> these suits are NBC (Nuclear<br />
Biological and Chemical) suits. Developed to protect soldiers, these are designed to protect the user in<br />
a hostile environment with chemical/biological agents and against radioactive fallout dust. The suits<br />
are designed to be worn for extended periods while continuing to operate in a combat environment.<br />
Product characteristics<br />
The NBC suit consists <strong>of</strong> a trouser and jacket and can be used directly over the under garments. The<br />
suit is permeable and allows evaporation <strong>of</strong> sweat (breathable). The suits are made in different sizes,<br />
generally these sizes are: small, medium, large and extra-large.<br />
The suit is made <strong>of</strong> three layers:<br />
1. Inner layer: Fabric cotton<br />
2. Middle layer: Active charcoal treated non-woven<br />
3. Outer layer: Fabric with chemical and fire retardant fibres (inherently retardant). The outer fabric has<br />
disruptive printing to camouflage the soldiers and the base material for this coated fabric is polyester<br />
The physical characteristics <strong>of</strong> the NBC suit are given below:<br />
1. Fire/Heat/Cold/Water repellent outer fabric<br />
2. Breathable<br />
3. Effective in the temperature range <strong>of</strong> -35’C to +55’C<br />
4. Resistance to wear and tear – high abrasion resistance<br />
5. Can be decontaminated atleast two times<br />
6. Washable<br />
7. Shelf life <strong>of</strong> five to seven years<br />
Market dynamics and key growth drivers<br />
The major market for these products is primarily the Armed Forces and to a lesser extent NBC<br />
Emergency response units (National Disaster Management Authority)/Central Paramilitary<br />
Units/Other Civil Defence units etc. The Indian Army has around 1.5 million soldiers; out <strong>of</strong> these<br />
around 25% (0.375 million) are active in strike formations on the western border in normal<br />
deployment. These strike units can, in time <strong>of</strong> conflict with a hostile western neighbor, be potentially<br />
involved in combat in a hostile NBC environment. The Indian Army has been training to operate in<br />
such environments in exercises over the past few years and equipment and protocols are being<br />
developed. Thus NBC suits, while not new as a concept, would have a gradual growth going ahead.<br />
Key manufacturers
The Ordnance Factory is the only indigenous manufacturer and supplier <strong>of</strong> NBC suits in India<br />
managed by the Government <strong>of</strong> India. The technology is developed by the Defence Research<br />
Development Organisation and suits are manufactured by Ordnance Factories. Ordnance Factory has<br />
supplied around five lakh NBC suits to the army.<br />
Market size <strong>of</strong> and future forecast<br />
The Indian Defence forces have around 1.5 million soldiers, out <strong>of</strong> these around 25% (0.375 million)<br />
are tasked with operating in an environment with potentially high radiation and chemical/biological<br />
threats. The Ordnance Factory has supplied around five lakh NBC suits to the army. The current level<br />
<strong>of</strong> penetration indicates that the domestic demand is going to be more <strong>of</strong> a replacement demand. The<br />
average life <strong>of</strong> a NBC suit is assumed to be 7 years. Although the demand for these suits is not steady<br />
and products are generally built-to-order or tender, it is assumed that the demand would be uniformly<br />
distributed over the years as more units are also equipped. These suits cost around Rs 10,000 per<br />
piece.<br />
The current and future forecast <strong>of</strong> the domestic usage <strong>of</strong> NBC suits is given below:<br />
Market size<br />
NBC suits 2007-08 2012-13<br />
Quantity (Lakh Pieces) 0.22 0.50<br />
Value (Rs crore) 22 50<br />
Source: <strong>Industry</strong> survey, IMaCS Analysis<br />
The market size for NBC suits is estimated at approximately 22,000 pieces valued at Rs. 22 crore<br />
(though the initial demand was for 50,000 suits, the available capacity was only for 22,000 suits). The<br />
demand for NBC suits has been conservatively estimated at 50,000 suits in 2012–13 (same as the<br />
potential demand for 2007-08). Hence, the market potential in 2012–13 is estimated to be around Rs.<br />
50 crore. No inflationary increase is considered for estimating the market size.<br />
Import and Exports <strong>of</strong> NBC suits<br />
The export and imports <strong>of</strong> these NBC suits are negligible.<br />
Quality Control and Standards<br />
No specified quality standards, usually specification driven as per Defence Research Development<br />
Organisation.
High-Visibility clothing<br />
High visibility clothes (also known as Reflective-wear) have become very essential for the protection<br />
<strong>of</strong> people working in poorly lit environments like mines, highways, airport runways, cyclist etc. In the<br />
dark, the high visibility clothing increases the ability to spot working and guiding personnel.<br />
Product characteristics<br />
There are broadly three types <strong>of</strong> high visibility clothing:<br />
1. Reflection materials which shine when struck by light<br />
2. Photo luminescent material which give yellow light in dark<br />
3. Fluorescent material which is more visible even during the day<br />
Photo luminescent materials absorb the artificial light and emit green-yellow light in the darkness.<br />
Zinc Sulphide crystals which are not radioactive and non toxic pigments. Fluorescent materials<br />
convert energy from non-visible UV rays into visible. These are useful during daylight but <strong>of</strong>fer little<br />
protection in the dark as they do not emit or reflect light.<br />
The high visibility clothing is available in two classes:<br />
1. Suits with plastic tapes<br />
2. Suits with glass beads – or retro-reflective tapes – these give visibility up to 600 meters.<br />
Retro-reflective tapes are based on the principle that if the incident rays <strong>of</strong> light fall on<br />
concave glass, the reflected rays travel back in the same direction. This enhances the visibility<br />
<strong>of</strong> the person wearing garments consisting <strong>of</strong> retro reflective tapes. The technology involves<br />
coating <strong>of</strong> highly reflective glass beads with density as much as 50,000 tiny glass beads per<br />
square inch light.<br />
Ideal high visibility apparel should have the following characteristics<br />
• Light weight<br />
• Both day and night visibility.<br />
• Air and moisture permeability to ensure wearer comfort (Breathing perforated cloth mesh<br />
allows air and moisture through, enabling the vest to be worn over clothing in any weather.)<br />
• Universal one-size-fits-all design features so that jackets/Vests can be shared by the<br />
employees working n different shifts.<br />
• Hemmed edges for durability and neatness
The fabric used for high visibility clothing is generally 120gsm fluorescent polyester tricot fabric<br />
material with reflective micro prison sheeting. The reflective tapes are typically 5 cm in width. Each<br />
piece <strong>of</strong> vest requires 1.2 to 1.5 square meters fabric.<br />
Market dynamics and key growth drivers<br />
The key driver for high reflective clothing is the requirement <strong>of</strong> personnel visibility in ill-light areas<br />
<strong>of</strong> work both from service delivery and safety perspectives. The awareness <strong>of</strong> these products is low<br />
however is growing gradually with usage is airport, police, municipality, mining construction etc. The<br />
market in India is nascent and almost all the products are imported and marketed in India.<br />
Key manufacturers <strong>of</strong> High visibility clothing<br />
The high visibility clothing manufacturers source the clothing and tape and fabricate the jacket/vest.<br />
There are no manufacturers <strong>of</strong> these fabrics in India and these are sourced from Korea and China.<br />
Some <strong>of</strong> the key suppliers <strong>of</strong> high visibility clothing are given below:<br />
1. Reflectosafe, Mumbai – Production: 2 Lakh pieces per month<br />
a. Imports material from South Korea<br />
2. Intech Safety Private Limited, Kolkata<br />
3. Safety Solution Inc., Bangalore<br />
4. Delkon Textiles Pvt. Ltd., Faridabad<br />
Delkon manufactures woven base fabric <strong>of</strong> safety jackets (as per EN 471) and then fabricates safety<br />
jackets. They have supplied them to Govt. Organisations in the past. The retroreflective tape used<br />
during fabrication is usually imported. They have a capacity to manufacture and fabricate 3 lakh<br />
saftey jackets as per EN 471 per year.<br />
In addition to these key producers, various small importers also cater to a portion <strong>of</strong> domestic<br />
demand.<br />
Market size <strong>of</strong> and future forecast<br />
As per <strong>Industry</strong> research, the market for High-Visibility is approximately around 60 lakh pieces per<br />
annum. The average price <strong>of</strong> high visibility vests is Rs. 110. The current and future forecast <strong>of</strong> the<br />
domestic usage <strong>of</strong> high visibility clothing is given below:<br />
Market size<br />
High visibility clothing 2007-08 2012-13
Quantity (Lakh pieces) 60.0 120.7<br />
Value (Rs. Crore) 66.0 132.7<br />
Source: <strong>Industry</strong> survey, IMaCS Analysis<br />
The market size for high visibility clothing is currently estimated at approximately 60 Lakh pieces<br />
valued at Rs. 66 Crore. The demand for high visibility clothing is expected to grow at 15% per annum<br />
to around 120 Lakh pieces by 2012 – 13. The market potential in 2012–13 would accordingly be<br />
around Rs. 132 Crore. Inflationary increase is not taken into consideration as the prices are likely to<br />
reduce as the various players gain economies <strong>of</strong> scale with increase in demand.<br />
Import and Exports <strong>of</strong> high visibility clothing<br />
The fabric required for high visibility clothing is entirely imported from Korea and China.<br />
Quality Control and Standards<br />
Usually European EN standards are followed.
Chemical protection clothing<br />
Chemical Protective Clothing (CPC) is used for protection from chemical and physical hazards. The<br />
chemicals get absorbed into the human body by two ways:<br />
• Physical contact-The chemicals gets absorbed through the skin<br />
• Inhalation: The chemicals in gaseous state get absorbed in to the body through breathing.<br />
Chemical protective clothing is used for protection <strong>of</strong> the whole body against toxic chemicals which<br />
manifest their effect by absorption through skin.<br />
Product characteristics<br />
The CPC suits can be classified into two categories:<br />
a. Durable: The durable Chemical protective clothing is made <strong>of</strong> non-permeable textile fabrics<br />
(PVC/Rubber coated fabrics).The protection is achieved by blocking the penetration and<br />
permeation <strong>of</strong> the chemicals through the fabrics in the clothing. This is an effective method<br />
for providing sufficient protection to pr<strong>of</strong>essionals from contact <strong>of</strong> toxic chemicals. These<br />
fabrics do not allow air or moisture permeability which leads to stress and drop in<br />
productivity.<br />
b. Disposable: The disposable CPC is made <strong>of</strong> non woven fabric and can be used for 3-4 times<br />
.The disposable CPC provide better air and moisture permeability. Permeable type <strong>of</strong> clothing<br />
is preferred over impermeable type due to low heat stress and comfort, enabling use for a<br />
longer duration. The carbon-containing material developed so far includes carbon-coated non-<br />
woven fabric, carbon-impregnated polyurethane foam, hard carbon microsphere-adhered<br />
woven fabric and activated charcoal cloth.<br />
The non woven fabrics are also used as overalls in various industries and the demand <strong>of</strong> such products<br />
is picking up. The CPC clothing includes gas masks, hoods etc to prevent against airborne toxic<br />
agents.<br />
Market dynamics and key growth drivers<br />
The demand for CPC in India is almost entirely <strong>of</strong> the durable type. Typically PVC coated fabrics are<br />
used. The base fabric is made up <strong>of</strong> cotton or a mix <strong>of</strong> polyester cotton. The demand <strong>of</strong> CPC is from<br />
Chemicals and Chemical Products, Paints, Dyestuff, Petroleum industries etc. These suits are required<br />
by the workers engaged in the chemical handling section. The demand from Chemicals and Chemical<br />
Products industry accounts for 70 % <strong>of</strong> the total demand <strong>of</strong> the chemical protection suits. The suits<br />
used in Petroleum industries are coated with neoprene rubber as other coated fabrics are not suitable.<br />
The other fabrics swell after repeated exposure to oil. The key demand drivers are the growth <strong>of</strong>
chemical and chemical product industry and increasing awareness <strong>of</strong> occupational health and safety<br />
issues.<br />
Key manufacturers<br />
The suppliers <strong>of</strong> CPC suits are mostly unorganized. They source the coated fabric from the dealers<br />
and fabricate the CPC suits according to the specifications <strong>of</strong> the end users. These suppliers tend to<br />
have related products like rain coats in their product line. Some <strong>of</strong> the larger suppliers include<br />
Northstar Safety Products Pvt. Ltd. (Chandigarh), Intech (Kolkata), and Jyotech Engineering Co.<br />
Pvt. Ltd (Delhi).<br />
Tobit Engineers (Bombay) are distributors for Kimberly Clarke’s range <strong>of</strong> non woven overalls.<br />
Market size <strong>of</strong> and future forecast<br />
The <strong>Industry</strong>-<strong>wise</strong> factories carrying on operations declared Dangerous and workers employed in such<br />
operations in India for the year 2002 is given in the Annexure 5. The demand <strong>of</strong> chemical protection<br />
suits is found out using this data and extrapolated to 2007-08.<br />
The highest number <strong>of</strong> working factories carrying on dangerous operations was reported in<br />
‘Manufacture <strong>of</strong> Chemicals and Chemical Products’ (NIC- Code 24), cumulatively employing over<br />
13.13 million workers involved in dangerous operations. As per <strong>Industry</strong> research, the demand from<br />
this industry accounts for 65% <strong>of</strong> the total demand. While most <strong>of</strong> the process based industries<br />
typically require only gloves, boots and goggles (due to automated nature <strong>of</strong> their manufacturing),<br />
certain operations in these industries require entire work-wear to be protective.<br />
The total market for chemical protection suits is given below:<br />
Product<br />
Durable Chemical<br />
protection suits<br />
Quantity<br />
(number<br />
<strong>of</strong> pieces)<br />
Market size<br />
2007-08 2012-13<br />
Fabric<br />
Fabric<br />
requirement Value Quantity requirement<br />
(Million (Rs (Number (Million<br />
Linear M) Crore) <strong>of</strong> pieces) Linear M)<br />
Value<br />
(Rs<br />
Crore)<br />
78,000 0.3 10.87 1,14,000 0.4 20<br />
Source: <strong>Industry</strong> survey, IMaCS Analysis<br />
Note: Based on discussions with Chemical <strong>Industry</strong> experts, and comparing data on workforce<br />
employed in hazardous activities, a penetration <strong>of</strong> 0.1% is assumed in the Chemical <strong>Industry</strong><br />
workforce. The demand volume in 2007-08 is found out by assuming a CAGR <strong>of</strong> 8% over base year<br />
2000. The average life <strong>of</strong> a CPC suit is assumed to be 1 year. Based on <strong>Industry</strong> survey, we have<br />
assumed average price <strong>of</strong> a suit at Rs 1400 currently and <strong>consumption</strong> <strong>of</strong> 4 running metres <strong>of</strong> fabric<br />
per suit in order to derive the Market value and fabric requirement.
The demand for disposable CPC is yet to pick up in India. The current demand for non woven overalls<br />
is estimated to be 2500-3000 pieces per annum worth 25 lakh Rs. However, these products have a<br />
huge potential and growth depends upon the acceptance <strong>of</strong> these products.<br />
Imports and exports<br />
The disposable type overalls are imported from USA. The current levels <strong>of</strong> imports are negligible.<br />
Some chemical protection suits are imported under the following head:<br />
HS Code Description<br />
62101000*<br />
Garments, made up <strong>of</strong> nonwoven<br />
fabrics under HS<br />
codes 5602/5603 1.29 0.76<br />
Value<br />
(Rs. Crore) Imports (Quantity)<br />
2006- 2007-<br />
2006- 2007-<br />
07 08 Unit 07 08<br />
Note: * Other products are also imported under this segment.<br />
Source: DGCIS<br />
There are no exports <strong>of</strong> such products for India.<br />
Major machinery manufacturers<br />
No’s in<br />
thousands 65.08 42.7<br />
The basic machinery required is cutting and stitching machines. There are number <strong>of</strong> local<br />
manufacturers <strong>of</strong> these machines in India.<br />
Quality Control and Standards<br />
Code Description<br />
IS 15071: 2002 Chemical Protective Clothing Specification
High altitude clothing<br />
High altitude clothing are used for protection against extreme weather conditions like extremely low<br />
temperature, high velocity winds, snow fall etc. especially in critical combat areas like Siachen. The<br />
clothing at high altitudes needs to meet both functional and comfort properties. High altitude clothing<br />
is also known as Extreme cold climate clothing (ECC).<br />
Product characteristics<br />
The high altitude clothing consists <strong>of</strong> jacket, waist coat, trousers, glacier cap, rappelling gloves and<br />
glacier gloves. The gear typically weight <strong>of</strong> special clothing is around nine to ten kilograms. The<br />
typical characteristics <strong>of</strong> high altitude clothing are:<br />
1. Hydrophilic - Waterpro<strong>of</strong> and moisture resistant<br />
2. Breathable<br />
3. Abrasion resistance<br />
4. Maintain high integrity<br />
5. Resistance to quick wear and tear.<br />
The material used for these clothing is typically hydrophilic polyurethane coating, Gore-Tex coating<br />
or Sympatex coating. The hydrophilic properties are introduced by these coatings or laminates.<br />
Microporous coatings or laminates can be produced by mechanical fibrillation, phase separation,<br />
solvent extraction or solvent exchange.<br />
Indigenous Technology for high altitude clothing<br />
1. Ordnance Factory: The Ordnance Factories in India have indigenously developed high<br />
altitude clothing as substitute for Gore-Tex suit. The suit called the Suit Yeti consists <strong>of</strong> three<br />
layers <strong>of</strong> clothing conforming to an extended cold weather clothing system (ECWCS). Full<br />
ensemble has application for glacier region under extreme cold & wind chill condition. All<br />
the different layers can be worn as per the weather conditions and individuals metabolic<br />
response to cold climate.<br />
The construction details <strong>of</strong> the Suit Yeti are as follows:<br />
Outermost garment is made <strong>of</strong> a three layer fabric having PTFE sandwitched between two<br />
layers <strong>of</strong> Nylon Fabric, which acts as Breathable Membrane. This outer most Garment is<br />
seam sealed to make it fully waterpro<strong>of</strong> and windpro<strong>of</strong> garment, which keeps inner shell's<br />
thermal insulation intact however moisture is transmitted out wards from the intermittent<br />
shell. Middle layer is made up <strong>of</strong> Wind Stopper Fleece. This wind pro<strong>of</strong> material is extremely
eathable due to ePTFE membrane which transmits body moisture received from inner most<br />
layers to the outer shell. Very high level <strong>of</strong> thermal insulation is achieved by this middle<br />
garment. Innermost layer is made up <strong>of</strong> Terrypile Knitted Polypropylene Fabric which<br />
facilitates fast evaporation <strong>of</strong> sweat by wicking action. Being anti-fungal and anti bacterial<br />
Polypropylene is best suited next to skin.<br />
2. The National Institute <strong>of</strong> Design (NID) is also developing technology for the manufacture <strong>of</strong><br />
new special clothing for high altitude Army troops using materials that will be lighter,<br />
warmer, more flexible, durable and cheaper than the default merino wool. The fabric made<br />
from this technology would be superior to imports <strong>of</strong> similar material.<br />
NID would modify angora fibre (used in making suit fabric) at the micro and nano level<br />
which would give the yarn greater friction and resistance, instantly making it pack in more<br />
heat than merino wool. Fine angora fabric will replace merino in all special clothing between<br />
the inner layer <strong>of</strong> fine polyester and the outer layer <strong>of</strong> nylon. It will reduce the overall weight<br />
<strong>of</strong> troop clothing by about a quarter. The weight <strong>of</strong> the gear would be nearly two and half<br />
kilograms.<br />
Key manufacturers<br />
The key manufacturers <strong>of</strong> high altitude clothing are given below:<br />
1. Ordnance Factory Board – Around 7000 complete high altitude clothing sets<br />
2. Entermonde Polycoaters – Plans to produce breathable high altitude fabric and clothing in the<br />
next three years.<br />
Market size <strong>of</strong> and future forecast<br />
The Indian defence forces have around 1.5 million soldiers, out <strong>of</strong> these around 10% are involved in<br />
high altitude and extreme cold weather combat which would be around 0.15 million soldiers. On an<br />
average every high altitude combat soldier has two uniforms – one for use and the other as standby.<br />
The annual demand in 2007-08 is estimated to be 0.18 million pieces considering an average life <strong>of</strong><br />
2.5 years.<br />
The current and future forecast <strong>of</strong> the domestic usage <strong>of</strong> high altitude clothing is given below:
<strong>Domestic</strong> use <strong>of</strong> high altitude<br />
clothing<br />
2007-08 2012-13<br />
Quantity (pieces) 1.8 lakh pieces 2.09 lakh pieces<br />
Quantity (tonnes) 1,620 MT 1,880 MT<br />
Value Rs 650 crore Rs 750 crore<br />
Source: <strong>Industry</strong> survey, IMaCS Analysis<br />
The market size for high altitude clothing is estimated at approximately 1.8 lakh pieces valued at Rs.<br />
650 crore. The demand for high altitude clothing is expected to increase to around 2.09 lakh pieces by<br />
2012 – 13 registering a volume growth rate <strong>of</strong> 3% per annum. In tonnage, the demand for the<br />
<strong>technical</strong> <strong>textiles</strong> material is expected to increase from 1,620 tonnes in 2007-08 to 1,880 tonnes in<br />
2012-13. The market potential in 2012–13 is estimated to be around Rs. 750 crore. No inflationary<br />
increase has been considered to estimate the market size.<br />
Import and Exports <strong>of</strong> high altitude clothing<br />
In addition to Ordnance Factory, the high altitude clothing demand is also met through imports. The<br />
key suppliers from Western Europe are M/s Carinthia and M/s Aptec. The fabric is imported from<br />
Switzerland, Italy and Australia.<br />
There are no exports in this category.<br />
Quality Control and Standards<br />
No specified quality standards usually specification driven as per Defence Research Development<br />
Organisation.
Industrial Gloves<br />
Industrial hand gloves serve as an item <strong>of</strong> protective apparel for workers in factories. They are<br />
classified under Cut-Slash Protection as well as Thermal Protection. Gloves are best for protection<br />
from rough objects, sparks and heat, and for cushioning from blows in heavy-duty work requirements.<br />
Hand gloves are <strong>of</strong> various types (leather, knitted, nitrile) and sizes (varying gauges). The materials<br />
that go in the production <strong>of</strong> hand gloves vary from cotton fabrics and asbestos to variety <strong>of</strong> leathers, p-<br />
aramid etc. Gloves are widely used in <strong>Industry</strong> and Defence (Cut-Slash protection). Due to rapid<br />
industrialization, the use <strong>of</strong> industrial hand gloves is expected to grow considerably.<br />
Product characteristics<br />
The gloves used for industrial and general purposes are typically classified into following broad<br />
categories:<br />
1. Leather gloves<br />
2. Knitted gloves<br />
3. Non-latex gloves e.g. Nitrile gloves<br />
4. Rubber/Latex gloves<br />
The leather, knitted and nitrile gloves are used in industrial applications for protection and have<br />
accordingly been discussed in this section. The rubber/latex gloves are used for surgical purpose.<br />
The typical characteristics <strong>of</strong> gloves are as given below:<br />
1. Mild heat resistance<br />
2. High abrasion protection<br />
3. Better grip with anti slip coating<br />
4. Comfortable and durable<br />
5. Protection against cut and hot splash<br />
6. For gloves made from Aramid (para) –temperature tolerance ranges from 250 to 750<br />
Centigrade<br />
7. Nitrile gloves provide chemical splash protection<br />
Other than leather gloves the artificial fibres used for industrial gloves include: Kevlar (Para-aramid),<br />
Spectra, Bas<strong>of</strong>il and Dyneema.<br />
Market dynamics and key growth drivers
The market <strong>of</strong> work gloves or industrial gloves is primarily driven by increased awareness,<br />
international level <strong>of</strong> safety standard in industrial workplace and mandatory safety norms for<br />
protection <strong>of</strong> workforce. Some <strong>of</strong> the key end-use applications are:<br />
1. Iron and steel industry, where some <strong>of</strong> the big steel producers such as TISCO, SAIL, Ispat<br />
Industries and Essar Steel have been investing further.<br />
2. Welding applications<br />
3. Oil Refineries<br />
4. Construction<br />
5. Pharmaceuticals and Chemical Industries<br />
The awareness and usage level <strong>of</strong> these gloves in the Indian industry is limited compared to<br />
International worker safety standards. Majority <strong>of</strong> the Indian production gets exported with little<br />
demand from domestic market<br />
Key manufacturers <strong>of</strong> gloves<br />
The key manufacturers <strong>of</strong> industrial gloves are given below:<br />
Company<br />
Mallcom India Limited<br />
Production (lakh pairs<br />
per annum)<br />
Leather gloves 90<br />
Knitted gloves 36<br />
Nitrile gloves 80<br />
Rajda Industries and<br />
Exports Pvt. Limited 70<br />
Lumens India 36<br />
KDM Impex Pvt. 35<br />
These manufacturers account for more than 30 % <strong>of</strong> the market. The rest is covered by smaller<br />
unorganized players located in leather goods clusters in/around Mumbai, Calcutta and Vellore.<br />
Market size <strong>of</strong> and future forecast<br />
The market for industrial gloves is driven by demand from few big players in Refining, Iron and Steel<br />
and other heavy engineering sectors. Gloves are in the range from Rs. 16 (nitrile-pair) to Rs. 100
(Leather and coated fabric, along-with aramid for enhanced protection). Exports account for 80% <strong>of</strong><br />
the total production in India.<br />
The current and future forecast <strong>of</strong> the domestic market <strong>of</strong> gloves is given below:<br />
<strong>Domestic</strong> usage<br />
Industrial gloves (Nitrile + Leather) 2007-08 2012-13<br />
Quantity (million pieces) 22.2 35.0<br />
Value (Rs crore) 150 237<br />
Contribution <strong>of</strong> TT (Rs crore) 8.98 14.13<br />
Source: <strong>Industry</strong> survey, IMaCS Analysis<br />
The domestic <strong>consumption</strong> excluding imports is around 222 lakh pairs which amount to Rs 150 crore.<br />
The domestic demand is expected to increase to 350 lakh pieces by 2012–13 registering a growth rate<br />
<strong>of</strong> 9.5% per annum. The domestic market potential in 2012–13 is estimated to be Rs 237 crore.<br />
Nitrile-gloves are 100% TT while only some <strong>of</strong> Leather Gloves which are used for Industrial<br />
protection have a TT component (p-aramid lining/other non-woven lining). Based on discussions with<br />
<strong>Industry</strong> players, we have estimated the weighted average contribution from <strong>technical</strong> <strong>textiles</strong> by<br />
value (cumulative <strong>of</strong> coated fabric/nitrile gloves, p-aramid used in industrial gloves etc) at 6%. The<br />
same has been used to estimate the total potential for <strong>technical</strong> <strong>textiles</strong> in this segment for the two<br />
years.<br />
Like<strong>wise</strong>, by including exports, we can arrive at an estimate <strong>of</strong> the total potential for use <strong>of</strong> Technical<br />
Textile in Industrial Gloves as shown below:<br />
Market size including exports<br />
Industrial gloves 2007-08 2012-13<br />
Quantity (million pieces) 102.7 158.5<br />
Value (Rs crore) 727 1134<br />
Contribution TT (Rs Crore) 43.5 67.5<br />
Import and Exports<br />
The import figures for gloves are as given below:-<br />
HS Code Description Value (Rs. Crore) Imports (Quantity)<br />
2006-<br />
07<br />
2007-<br />
08(E)<br />
Unit<br />
2006-<br />
07<br />
2007-<br />
08(E)
40159030 Industrial gloves 4.95 6.36<br />
42032910<br />
Total<br />
Gloves for use in<br />
industry<br />
The export figures for gloves are as given below:-<br />
0.77 0.35<br />
5.72 6.71<br />
Pairs in<br />
thousands<br />
Pairs in<br />
thousands<br />
Pairs in<br />
thousands<br />
Source:DGCIS, IMaCS Analysis<br />
1944.48 2053.11<br />
62.72 34.64<br />
2007.20 2087.75<br />
Description Value (Rs Crore) Exports (Quantity)<br />
2006-07<br />
2007-<br />
08(E)<br />
40159030 Industrial gloves 2.62 0.61<br />
42032910<br />
Total<br />
Gloves for use in<br />
industry<br />
525.96 576.38<br />
528.58 576.99<br />
Unit 2006-07<br />
Pairs in<br />
thousands<br />
Pairs in<br />
thousands<br />
Pairs in<br />
thousands<br />
Source:DGCIS, IMaCS Analysis<br />
2007-<br />
08(E)<br />
1,469.37 147.29<br />
73407 80385<br />
74876.37 80532.29<br />
These products are exported to Australia, Austria, China, Belgium, Canada, USA and other western<br />
European countries.<br />
The <strong>technical</strong> textile elements in the gloves exported is expected to value Rs 34.5 crore. These exports<br />
are estimated to be Rs 44 crore for the year 2012-13.<br />
Raw-materials<br />
Leather gloves: The leather is checked for uniform thickness, holes and flying cuts, if any. It is then<br />
marked with the pattern and then cut with the help <strong>of</strong> scissors or clicking knife into different<br />
components. The inner lining material is cut in the dimensions <strong>of</strong> the glove. The leather lining<br />
material is stitched together. After stitching all the components suitably, the gloves are turned inside<br />
out. The gloves are then ready for packing and dispatch.<br />
Knitted gloves: The glove fabric is manufactured by knitting synthetic fibre like para-aramid (or<br />
blends <strong>of</strong> p-aramid with other fibers such as nylon and polyester) with weave properties in<br />
consonance with the desired end product characteristics. Yarn denier can vary from 0.85 to 4.2 dpf<br />
with 2.25 dpf the predominant product. The fabric is cut to desired size and so is the lining material.<br />
The parts are stitched together and gloves are turned inside out.<br />
Nitrile Gloves are manufactured by coating nitrile compound on knitted gloves <strong>of</strong> synthetic fibre or<br />
cotton fibre. The nitrile coating <strong>of</strong>fers good abrasion and cut resistance
Quality Control and Standards<br />
The companies in India follow the EN or the European Standard like EN 512 based on the level <strong>of</strong><br />
protection need to be <strong>of</strong>fered to the person wearing the gloves.
GEOTECH<br />
Geotech segment comprises <strong>of</strong> <strong>technical</strong> textile products used in Geo<strong>technical</strong> applications pertaining<br />
to soil, rock, earth etc. This class <strong>of</strong> products is loosely called Geo<strong>textiles</strong>. However Geo<strong>textiles</strong><br />
specifically refers to permeable fabric or synthetic material, woven or non-woven, which can be used<br />
with geo<strong>technical</strong> engineering material).<br />
The principal functions performed by Geo<strong>textiles</strong> are confinement /separation, reinforcement,<br />
filtration and drainage, and protection. Application areas include Civil Engineering (roads and<br />
pavements, slope stabilization and embankment protection, tunnels, rail-track bed stabilization,<br />
ground stabilization and drainage etc), Marine Engineering (Soil Erosion control and embankment<br />
protection, breakwaters) and Environmental Engineering (landfills and waste management).<br />
Other specialized Geotech products comprise Geogrids (plastics filaments and tapes etc formed into a<br />
very open, grid like configuration having large apertures), Geonets (extruded polymer ribs set in net<br />
like fashion with small apertures), Geomembranes (impermeable fabric as barrier) and Geocomposites<br />
(products using two or more Geo<strong>textiles</strong> e.g. Pre-fabricated Drains-PVD).<br />
Current Geo<strong>textiles</strong> Market in India (Imports and domestic production) is around Rs 272 Crore,<br />
comprising imports <strong>of</strong> an estimated Rs 105 Crore and domestic production <strong>of</strong> around Rs 167 Crore. In<br />
terms <strong>of</strong> product category, the market includes Rs 241 Crore <strong>of</strong> synthetic woven/non-woven<br />
Geo<strong>textiles</strong> (85 Crore <strong>of</strong> woven and 67 Crore <strong>of</strong> Non-woven) as well as other products like Geogrids<br />
and Others (Geomembranes, Geonets and Geocomposites). Agro-based Geo<strong>textiles</strong> (made <strong>of</strong> Jute and<br />
Coir) are also developing and finding acceptance as a class <strong>of</strong> products. Market size for these products<br />
was around Rs 31 Crore.<br />
Market Size including imports (Rs Crore)<br />
Synthetic Geotextile products<br />
Woven Geo<strong>textiles</strong><br />
Non Woven Geo<strong>textiles</strong><br />
Geogrids/Others<br />
Geomembranes/Geocomposites (PVD etc)<br />
Total<br />
Agro-based Geo<strong>textiles</strong><br />
Out <strong>of</strong> this, current <strong>consumption</strong> is around Rs 185 Crore. The <strong>consumption</strong> <strong>of</strong> Geo<strong>textiles</strong> is expected<br />
to be driven by the investments in the Infrastructure sector (both public, private as well as PPP mode<br />
investments). Moreover, promotion <strong>of</strong> the use <strong>of</strong> geomembrane as lining for canals, ponds and<br />
reservoirs by the National Horticulture Mission is likely to boost the <strong>consumption</strong> <strong>of</strong> geomembranes.<br />
241<br />
85<br />
67<br />
35<br />
54<br />
31<br />
272
Consumption <strong>of</strong> Geotextile products is expected to grow at a CAGR <strong>of</strong> 12% to reach Rs 326 Crore by<br />
2012-13. Market size estimates are as shown below:<br />
Geo<strong>textiles</strong><br />
(total) 2007-08 2012-2013<br />
Export<br />
Production Imports Exports Consumption Consumption Potential<br />
Rs Crore 167 105 87 185 326 128<br />
The market size for Geo<strong>textiles</strong> as per the ECTT report is as given below:<br />
Market Size from ECTT's estimates (Rs Crore) for 2007-2008<br />
Geo<strong>textiles</strong> 2640<br />
Total Roads 1816<br />
Railways 400<br />
Pavement Infrastructure 200<br />
Other Infrastructure 224<br />
Geogrids 214<br />
Capital Employed and Pr<strong>of</strong>itability <strong>of</strong> key players <strong>of</strong> Geotech*<br />
Company Name<br />
Capital Employed<br />
(Rs crore)<br />
Net Pr<strong>of</strong>it Margin<br />
(%)<br />
2006-07 2007-08 2006-07 2007-08<br />
Ashapura Volclay Ltd. 69.8 68.5 17.8% 10.8%<br />
Garware-Wall Ropes Ltd. 184.2 245.2 6.5% 5.9%<br />
Gloster Jute Mills Ltd. 58.4 61.9 3.2% 6.9%<br />
Rishi Packers Ltd. 18.4 15.6 1.6% -4.6%<br />
Source: Prowess Database, IMaCS Analysis<br />
* The above list also includes the players <strong>of</strong> Oekotech segment<br />
Geotech and Oekotech segment <strong>of</strong> <strong>technical</strong> <strong>textiles</strong> is estimated to provide employment to 2,500<br />
people 25 <strong>of</strong> whom number <strong>of</strong> <strong>technical</strong> 26 employees is estimated at 2,000 and number <strong>of</strong> non-<strong>technical</strong><br />
employees is estimated at 500.<br />
1. Introduction <strong>of</strong> the product / application areas<br />
Geo<strong>textiles</strong> can be defined as any permeable fabric or synthetic material, woven or non-woven, which<br />
can be used in association with soil, rock, earth or any other geo<strong>technical</strong> engineering related material.<br />
25 Employment has been estimated based on the analysis <strong>of</strong> primary and secondary data available for the<br />
<strong>technical</strong> textile manufacturers. IMaCS has made appropriate adjustments because <strong>of</strong> insufficient data.<br />
26 Technical includes managerial staff and skilled labour whereas non-<strong>technical</strong> includes unskilled labour.
The principal functions performed by Geo<strong>textiles</strong> are confinement /separation, reinforcement,<br />
filtration and drainage, and protection. These functions can be described thus:<br />
a) Confinement / Separation:<br />
Confinement provides a media between the aggregate and the subsoil which absorbs the load in the<br />
form <strong>of</strong> tension and prevents change in alignment <strong>of</strong> the aggregate. Geotextile economically helps the<br />
separation concept <strong>of</strong> keeping two dissimilar materials apart to maximise the physical attributes <strong>of</strong><br />
each <strong>of</strong> those materials. The object <strong>of</strong> separation by geo<strong>textiles</strong> is to prevent a well defined material or<br />
rich material from penetrating the sub-grade or the poor soil. If the separating media <strong>of</strong> geo<strong>textiles</strong> is<br />
absent, the infiltration <strong>of</strong> the sub-grade decreases permeability <strong>of</strong> the aggregate to the point where it<br />
cannot adequately transport the water reaching it.<br />
Suitable geotextile fabric with good puncture/tear resistance when used as a separator media -<br />
eliminates the loss <strong>of</strong> costly aggregate material into subsoil, prevents upward pumping <strong>of</strong> subsoil,<br />
eliminates contamination and maintains porosity <strong>of</strong> different levels.<br />
For separation purposes, both woven / nonwoven geo<strong>textiles</strong> may be used.<br />
b) Reinforcement:<br />
The purpose <strong>of</strong> geo<strong>textiles</strong> in the reinforcement function is to reinforce the weak sub-grade or subsoil.<br />
It helps to strengthen the soil surface and to increase the soils ability to stay put especially on the<br />
slopes. Due to this the slopes are stabilised either permanently or temporarily and creep stops or at<br />
least diminishes. Further, it helps in preventing water from permeating a slope and controlling the<br />
amount <strong>of</strong> infiltration that occurs during various rain events.<br />
Reinforcing aspect <strong>of</strong> geo<strong>textiles</strong> can be used for roads, temporary roads, pavements, air strips,<br />
stabilised road slopes, retaining walls, containment systems, controlling reflective cracking, fibre or<br />
fabric reinforced concrete etc. Asphalt impregnated geotextile is used as a paving fabric, relieving<br />
stress and acting as moisture barrier.<br />
For reinforcement synthetic woven fabric or spun-bond is preferred. Reinforcement is further<br />
enhanced by use <strong>of</strong> geo-grids or geo-nets.<br />
c) Filtration:<br />
The purpose <strong>of</strong> geo<strong>textiles</strong> with reference to drainage and filtration is simply to retain soil while<br />
allowing the passage <strong>of</strong> water. When geo<strong>textiles</strong> are used as drains, the water flow is within the plane<br />
<strong>of</strong> the geotextile itself i.e., they have high lateral permeability. At the same time, geo<strong>textiles</strong> must<br />
possess adequate dimensional stability to retain their thickness under pressure. The life <strong>of</strong> pavement
<strong>of</strong> highways/air fields etc is affected by the time for which the water remains under the structural<br />
section and its drainage system which is responsible for the removal <strong>of</strong> free water which is fed<br />
directly from the stone base course beneath the structure. Needle punched nonwoven is the preferred<br />
geotextile for such applications where primary requirement is filtration.<br />
Drainage:<br />
The use <strong>of</strong> geo<strong>textiles</strong> in drainage has made significant strides in changing the conventional procedure<br />
<strong>of</strong> using graded filters. Outstanding advantages <strong>of</strong> geo<strong>textiles</strong> in drainage are:<br />
• It eliminates the filter sand with the dual media backfill.<br />
• In some cases, it eliminates the need for perforated pipes.<br />
• In situations where only sand backfill is available, it is possible to wrap the drainage pipe with<br />
fabric to act as a screening agent. The fabric, thereby, prevents the sand from entering<br />
perforation in the pipe.<br />
• With Geo<strong>textiles</strong>, trench excavation is considerably reduced.<br />
• Many times the use <strong>of</strong> geo<strong>textiles</strong> eliminates the need for trench shoring.<br />
Needle-punched nonwoven geotextile is preferred where drainage is the primary functional<br />
requirement.<br />
d) Protection:<br />
Lining is used for cushioning and protection <strong>of</strong> membrane used for applications such as land fill and<br />
waste containment from puncture or training by sharp stone or stress. Geo<strong>textiles</strong> can also be<br />
impregnated with polymeric or mineral sealing materials such as bentonite clay to provide flexible<br />
barriers to mixture. Usually spun bond or needle-punched nonwovens are preferred for such<br />
applications.<br />
Each <strong>of</strong> these functions calls for highly specific textile performance characteristics. As the functional<br />
requirements are to be met over many years <strong>of</strong> the life <strong>of</strong> the civil construction, durability is <strong>of</strong>ten a<br />
very key requirement. Many applications require several <strong>of</strong> the above functions to be met<br />
simultaneously. Further, the cost <strong>of</strong> the geo<strong>technical</strong> solution is also an important factor to be taken<br />
into account in evaluating solutions.<br />
Further, specialized segments (Geogrid, Geonet and Geomembrane) also exist within the Geo<strong>textiles</strong><br />
space. These are as follows:<br />
a) Geo-grids represent a rapidly growing segment within the geo<strong>textiles</strong> area. Geogrids are<br />
plastics filaments, rovings, and tapes etc formed into a very open, grid like configuration<br />
having large apertures, unlike woven, nonwoven or knit <strong>textiles</strong>. These apertures may vary in<br />
size from 1 to even more than 10 cm. They can be mono-axial or bi-axial i.e. be stretched in
one or two directions for improved physical properties. Geogrids are mainly used for<br />
reinforcement – beneath aggregate in unpaved roads, reinforcement <strong>of</strong> embankment fills/earth<br />
dams, repairing slope failures/landslides, as inserts between geo<strong>textiles</strong>/geomembranes etc.<br />
b) Geonets constitute another specialized segment within the geo-synthetic area. Geonets are<br />
usually formed by a continuous extrusion <strong>of</strong> parallel sets <strong>of</strong> polymeric ribs at acute angles to<br />
one another. When the ribs are opened, relatively large apertures are formed into a netlike<br />
configuration. Geonets are made <strong>of</strong> polypropylene (PP) or Polyethylene (PE). Geonets are<br />
used almost exclusively for their drainage capability for applications like water drainage<br />
behind retaining walls, seeping rock slopes, beneath sport fields, building foundations;<br />
leachate drainage <strong>of</strong> landfill side slopes, above landfill liners and surface water drainage<br />
within landfill caps.<br />
c) Geo-membranes are impermeable membranes, used where the primary function is to have an<br />
impervious barrier for fluids. However, as the possibility <strong>of</strong> punctures or tears is high in many<br />
areas <strong>of</strong> use, it is common to protect these membranes by use <strong>of</strong> Geo<strong>textiles</strong>. Often the<br />
geo<strong>textiles</strong> also perform other functions besides protection <strong>of</strong> the membrane. Geomembranes<br />
are made from continuous polymeric sheets that are very flexible, but can also be made by<br />
impregnation <strong>of</strong> geotextile with asphalt or elastomer sprays or bitumen composites.<br />
Geomembranes are used in applications such as liners for water canals, waste canals, solid-<br />
waste landfills, covers for solid-waste landfills, waterpro<strong>of</strong>ing within tunnels, to control odors<br />
in landfills, to prevent infiltration <strong>of</strong> water in sensitive areas, and beneath asphalt overlays as<br />
a waterpro<strong>of</strong>ing layer.<br />
d) Geo-composites: these consist <strong>of</strong> two or more geosynthetic products put together to increase<br />
the combinations ability to optimally address the specific application (say filtration/<br />
reinforcement etc) at minimum cost. The best features <strong>of</strong> different materials are combined in<br />
such as way that the benefit/cost ratio is maximized. An example <strong>of</strong> this is known as wick<br />
drains in the U.S. and prefabricated vertical drains, PVDs, in Europe. These consist <strong>of</strong> a 100<br />
mm wide by 5 mm thick polymer cores, for conducting water, with a geotextile acting as a<br />
filter and separator socked around the core.<br />
e) Gabions are rectangular or cylindrical containers fabricated from polymer/metal meshes,<br />
usually filled with stone and used for structural purposes (retaining walls, slope and<br />
embankment protection etc). These have been used in India since 70s.<br />
2. Product characteristics
In general, the vast majority <strong>of</strong> Geo<strong>textiles</strong> are made from polypropylene (PP), polyethylene or<br />
polyester formed into fabrics based on type <strong>of</strong> process. The mechanical and hydraulic properties vary<br />
widely depending on type <strong>of</strong> application designed for. Depending on type (woven/non-woven),<br />
process (thermal bonded/resin bonded), desired performance specifications (load bearing ability, tear<br />
resistance etc), Geo<strong>textiles</strong> can range from under 40 GSM to over 3000 GSM (used in landfill<br />
applications). Geogrids are usually knitted and PVC coated. Products are designed to be resistant to<br />
mildew, bacteria, soil acids (PP) and alkalis (PP, PES) and most chemicals.<br />
Apart from the above, Agro based Geo<strong>textiles</strong> (woven <strong>textiles</strong> based on Jute, Coir) are also a niche<br />
but growing segment. These have the advantage <strong>of</strong> being bio-degradable as well as being cheaper.<br />
3. Market dynamics and key growth drivers: Infrastructure sector in India<br />
India's economic performance, particularly over the past three years, has been robust on several<br />
counts. Economic growth accelerated and averaged over 8 per cent per annum. From Planning<br />
Commission estimates, it became obvious that to sustain this rate <strong>of</strong> growth, the country’s<br />
infrastructure spending would have to increase substantially. Over the past 3-4 years, a clear political<br />
consensus has emerged on the need for speeding up the development <strong>of</strong> the country’s infrastructure. A<br />
number <strong>of</strong> large infrastructure projects have received support from the government, irrespective <strong>of</strong><br />
which political party is in power. A key Governmental step has been deregulation/ Policy<br />
Streamlining – The government has announced commitments to build large infrastructure projects<br />
through significant public expenditure and with the help <strong>of</strong> private partners - including, for the first<br />
time, foreign investors. Currently, few limits exist on foreign direct investment in infrastructure. The<br />
Government has also begun the process <strong>of</strong> privatizing significant government-owned infrastructure<br />
assets. Other initiatives in this direction include deregulation <strong>of</strong> highways, establishing a national<br />
highway toll system (including provisions for toll increases), establishing a fair and transparent<br />
process for the award <strong>of</strong> projects in most sectors and putting a sound contractual system in place to<br />
protect investor interests (providing model concession agreements for investment in some sectors).<br />
This has resulted in a robust flow <strong>of</strong> investments into the sector in the last few years. Basis goals<br />
set/investment planned by the Government and on sector-<strong>wise</strong> macroeconomic indicators, we can<br />
estimate the total sector-<strong>wise</strong> investment needs. This is shown below:<br />
Table 1: Infrastructure needs sector <strong>wise</strong><br />
Sectors<br />
Investment Needs<br />
during 2006-07 to<br />
2010-11 (INR Crore)<br />
Investment Needs during<br />
2006-07 to 2010-11 (USD<br />
million*) – approx.
Roads (excluding<br />
PMGSY)<br />
245,000 54,400<br />
Power 665,000 148,000<br />
Ports 86,000 19,000<br />
Airports 40,000 8,900<br />
Railways 122,000 27,100<br />
Urban Infrastructure 22,000 4,900<br />
Others (Gas pipelines,<br />
SEZs, and tourism)<br />
420,000 93,300<br />
Total 16,00,000 355,550<br />
Source: Various Programs <strong>of</strong> GoI, Reports <strong>of</strong> various Committees and IMaCS analysis<br />
1. Power: Ministry <strong>of</strong> Power, GoI, Kohli Committee Report<br />
2. Roads: NHAI and Ministry <strong>of</strong> Shipping, Road and Highways, GoI, Transport Sector, Vision 2021, GoI,<br />
www.infrastructure.gov.in, Report <strong>of</strong> the Sub-Group on State Roads for the 11 th Five Year Plan, MoSRTH<br />
3. Railways: Conference on Building Infrastructure, Oct 7, 2006, The Hindu, Oct 8, 2006, National Conference on<br />
Regulatory Performance in India: achievements, constraints and future action" Nov 9-10, 2006, and IMaCS<br />
analysis<br />
4. Ports: National Maritime Development Programme, www.shipping.nic.in<br />
5. Airports: Financing Plan for Airports, Committee on Infrastructure, Jul 2006<br />
6. Urban Infrastructure: Planning Commission norms, Zakaria Committee norms, Xth plan document, IMaCS analysis<br />
7. Gas Pipelines: Ministry <strong>of</strong> Petroleum and Natural Gas, CII-IBEF<br />
8. SEZs: Business World, Nov 2006, IMaCS analysis<br />
9. Tourism: Investment Commission Report<br />
* Assumption: INR 45 = 1 USD<br />
According to our calculations, the envisaged infrastructure investment needs <strong>of</strong> India during 2006-07<br />
to 2010-11 amount to about Rs. 16 lakh crore (USD 355.5 billion), <strong>of</strong> which the estimated investment<br />
needs in the road sector are Rs. 245,000 crore, about 14% <strong>of</strong> the total. All sectors, especially roads,<br />
represent a eas <strong>of</strong> opportunity for use <strong>of</strong> Geo<strong>textiles</strong>.<br />
Road sector in particular represents the most obvious area <strong>of</strong> opportunity due to the direct<br />
applicability as well as the sheer scale <strong>of</strong> projects. Roads were till recently, the largest consumer <strong>of</strong><br />
Geosynthetics in the small Indian Geotextile market. The origin <strong>of</strong> investment in the road sector in the<br />
country started with the initiation <strong>of</strong> the National Highways Development Project (NHDP) in the ‘90s.<br />
The largest highway project ever undertaken by the country, this was initiated in a phased manner,<br />
with National Highways Authority <strong>of</strong> India (NHAI) being set up as the implementing agency, starting<br />
with Phase I and II which focused on the Golden Quadrilateral and North-South-East-West Corridor<br />
road development. The various phases <strong>of</strong> NHDP are outlined below:<br />
Phases<br />
Total Length<br />
(in Km)<br />
Phase Cost<br />
Approved (Rs<br />
Crore)
Phase I GQ,EW-NS corridors, Port<br />
connectivity & others<br />
Phase II 4/6-laning North South- East<br />
West Corridor, Others<br />
7498 30300<br />
6647 34339<br />
Phase III, Upgradation,4/6-laning 12109 80626<br />
Phase IV , 2-laning with paved<br />
shoulders<br />
V 6-laning <strong>of</strong> GQ and High density<br />
corridor<br />
20000 N.A<br />
6500 41210<br />
VI Expressways 1000 16680<br />
VII Ring Roads, Bypasses and ring<br />
roads/flyovers and other structures<br />
Source: NHAI, Ministry <strong>of</strong> Surface Transport<br />
700 Km <strong>of</strong> ring<br />
roads/ bypass<br />
+ flyovers etc<br />
16680<br />
Note: Cost <strong>of</strong> Phase I and II are at 1999 prices and 2003 prices respectively. Phase-IV is yet to be<br />
approved by the Government.<br />
Currently, phase III and V are being executed while later phases are in planning/feasibility stage. In<br />
the later phases, as more and more roads become multilane, with more expressways, usage <strong>of</strong><br />
Geo<strong>textiles</strong> will clearly grow.<br />
The Pradhan Mantri Gram Sadak Yojana (PMGSY), was launched by the Govt. <strong>of</strong> India to provide<br />
connectivity to unconnected rural Habitations as part <strong>of</strong> a poverty reduction strategy. Government <strong>of</strong><br />
India is endeavoring to set high and uniform <strong>technical</strong> and management standards and facilitating<br />
policy development and planning at State level in order to ensure sustainable management <strong>of</strong> the rural<br />
roads network. About 368,000 km <strong>of</strong> new road construction and 370,000 km <strong>of</strong> upgradation/renewal<br />
is expected to be done at a cost <strong>of</strong> about $26 billion. This is expected to increase the demand <strong>of</strong><br />
Geotextile in India.<br />
4. Key manufacturers <strong>of</strong> the product with information on capacity / production / sales<br />
Some <strong>of</strong> the key manufacturers <strong>of</strong> Geo<strong>textiles</strong> in India include Techfab India, Kusumgar Corporates,<br />
SKAPS and Shri Ambica.<br />
Manufacturer Year Capacity<br />
(MT)<br />
Production<br />
(MT)<br />
TechFab India 2007-08 8000 2199<br />
SKAPs 2007-08 4000 4000
Kusumgar Corporates 2007-08 250 225<br />
Maccaferi India 2007-08 1850 740<br />
Shri Ambica Polymers 2007-08 5000 1500<br />
Shakti Polyweave Pvt. Ltd. 2007-08 1723<br />
Shri Jagdamba Polymers Ltd. 2007-08 2115<br />
Garware Wall Ropes (Geosynthetics) 2007-08 360 291<br />
Source: <strong>Industry</strong> Survey, IMaCS Analysis<br />
Note: Capacity in MT estimated based on discussions with <strong>Industry</strong> players. Capacity for products<br />
determined in square or linear metres has been converted into tonnage using appropriate gsm<br />
assumptions in case <strong>of</strong> Techfab. Capacity for Maccaferi’s Pune plant is largely for its Soil<br />
Embankment reinforcement products. Garware produces woven fabric and Pre-fabricated Drains,<br />
however only capacity for woven fabric is included in the above table. Capacity <strong>of</strong> Ambica Polymers<br />
is 5000 MT, but only 30% is dedicated to Geotech.<br />
Apart from the above mentioned firms, International Packaging Product Pvt. Ltd., Texel Industries<br />
Ltd. and Aadi Plastic Industries Pvt. Ltd. manufacture geo-membranes used as lining for canals,<br />
ponds and reservoirs. Other Technical Textile manufacturers like Supreme Nonwoven, Charminar<br />
Nonwoven also produce Geo<strong>textiles</strong> – however both are focused towards automotive <strong>textiles</strong> and<br />
Geo<strong>textiles</strong> is a small part <strong>of</strong> their business. Kusumgar Corporates sold about Rs 10 crore worth <strong>of</strong><br />
Geotextile in 2007-08.<br />
Neo Corp International Ltd., Indore has also commissioned a woven Geo<strong>textiles</strong> plant with a capacity<br />
<strong>of</strong> 720 MT per annum. As <strong>of</strong> now, the total produce is exported. The company is increasing its<br />
capacity by 2160 MT per annum. The orders for plant and machineries have already been placed.<br />
Apart from these, manufacturers <strong>of</strong> Jute Geo-<strong>textiles</strong> (JGT) include Gloster Jute Mill, Birla Jute Mill<br />
Premchand Jute Mill located in West Bengal. As per data from the Jute Manufacturers Development<br />
Council, around 2188 MT <strong>of</strong> Jute Geo<strong>textiles</strong> (3.8 million sq. metres) were produced and used in<br />
projects within the country. This includes around 124 MT (0.18 million sqm) used for rural roads<br />
constructed under the The Pradhan Mantri Gram Sadak Yojana (PMGSY), scheme. Around 5882 MT<br />
<strong>of</strong> Jute Geo<strong>textiles</strong> was exported. Coir Products are mostly manufactured by small units in southern<br />
India. As per the Coir Board around 104 MT <strong>of</strong> Coir Geo<strong>textiles</strong> was used in road construction in<br />
India in 2007-08, while around 3,365 MT <strong>of</strong> coir geo<strong>textiles</strong> was exported.<br />
5. Market size and future forecast
Based on discussions with <strong>Industry</strong> players and analysis <strong>of</strong> imports data, the total market for<br />
Geotextile products in India is currently estimated at Rs 272 Crore 27 . Excluding exports, the total<br />
<strong>consumption</strong> <strong>of</strong> Geo<strong>textiles</strong> in the India was around Rs 185 Crore.<br />
The total market in 2007-2008 has been broken into the following key components:<br />
Market Size including imports<br />
(Rs Crore)<br />
Geosynthetics<br />
241<br />
Woven Geo<strong>textiles</strong><br />
85<br />
Non Woven Geo<strong>textiles</strong><br />
67<br />
Geogrids<br />
35<br />
Geomembranes*/Geocomposites<br />
(PVD etc)<br />
54<br />
Agro-based Geo<strong>textiles</strong><br />
31<br />
Total<br />
272<br />
*This includes geo-membranes used as lining for canals, ponds and<br />
reservoirs.<br />
The major use <strong>of</strong> Geo<strong>textiles</strong> has been in roads – wherein the major function has been separation and<br />
reinforcement. Consumption <strong>of</strong> Geogrids has mostly been for Mechanically Stabilized Earth (MSE)<br />
and Reinforced Soil Slope (RSS) applications. Geogrids in NHAI projects have mostly been used in<br />
reinforced soil retaining walls and approaches to flyover. The general <strong>consumption</strong> norm is 10 sq. m.<br />
per sq. m. <strong>of</strong> wall. Other composites like PVD Drains are also being used. However major use <strong>of</strong><br />
composites and non-woven geo<strong>textiles</strong> has been in other infrastructure (e.g. L&T alone used 1.25<br />
million metres <strong>of</strong> PVD and 0.9 million sq. metres <strong>of</strong> nonwovens in Dhamra port project).<br />
Agro-based Geo<strong>textiles</strong> (major contribution being Jute, Coir products being mostly exported) have<br />
been used in small patches <strong>of</strong> NHAI projects for slope and sub-grade stabilization. However their use<br />
in PMGSY (Prime Minister’s Gram Sadak Yojna) projects has been successfully validated. It is<br />
expected that going forward, not only PMGSY projects but even district roads would use Jute-<br />
Geo<strong>textiles</strong> in greater quantities given the cost benefits compared to synthetic Geo<strong>textiles</strong>.<br />
The potential for Geo<strong>textiles</strong> in India can be determined from the previously discussed total spends<br />
expected in Infrastructure in India over the next few years as shown below:<br />
27 Analysis based on data/information received from NHAI and Railways. IMaCS has made appropriate adjustments because<br />
<strong>of</strong> insufficient data.
Sectors<br />
Investment<br />
Needs during<br />
2006-07 to<br />
2010-11 (Rs<br />
Crore)<br />
Projects<br />
with<br />
potential<br />
use <strong>of</strong><br />
Geo<strong>textiles</strong>,<br />
assuming<br />
low<br />
penetration<br />
Potential<br />
Geotech<br />
Spend @ 1-<br />
2% <strong>of</strong><br />
project cost<br />
(Rs Crore)<br />
Average<br />
Geotech<br />
spend per<br />
annum<br />
possible over<br />
five year<br />
period<br />
Estimated<br />
Geotech<br />
Spend Rs<br />
Crore '07-<br />
08<br />
Roads<br />
(excluding<br />
PMGSY) 245,000 29,400 441 88 76<br />
Power 665,000 33,250 333 67 NA<br />
Ports 86,000 8,600 172 34 30<br />
Airports 40,000 800 8 2 0<br />
Railways 122,000 7,320 73 15 4<br />
Urban<br />
Infrastructure 22,000 2,200 33 7 2<br />
Others (Gas<br />
pipelines,<br />
SEZs, tourism<br />
etc)** 420,000 50,400 504 101 73<br />
Total 1,600,000 131,970 1,564 313 185<br />
Note:*Others overlap with Oekotech as end-use etc also occurs for waste management<br />
Assumptions: We have assumed conservative use <strong>of</strong> Geo<strong>textiles</strong> across sectors. Hence a certain<br />
percentage <strong>of</strong> projects (value derived from the total investment proposed) have been assumed to use<br />
Geo<strong>textiles</strong>, varying from a low <strong>of</strong> 2% in Airports (since few airport projects, wherein only runways<br />
will actually be the end-use) to a high <strong>of</strong> 12% for Roads sector. As per <strong>Industry</strong> feedback, we have<br />
assumed 1%-1.5% contribution (variance due to wide variety <strong>of</strong> end-use specifications) <strong>of</strong> Geo<strong>textiles</strong><br />
towards the total project cost. This gives us the total potential for Geo<strong>textiles</strong> over the five year<br />
period. Since the demand is project specific, hence we have shown an average annual demand for<br />
Geo<strong>textiles</strong>.<br />
Our estimates <strong>of</strong> current sector-<strong>wise</strong> usage are also shown in the above table. Although Railroad<br />
applications are an important market worldwide, Indian market has not seen the same demand. While<br />
Geo<strong>textiles</strong> have been sporadically used in Indian Railway track stabilization and other construction<br />
projects for a few years now, it has not been a large market 28 . While Rail Design and Standards<br />
Organization (RDSO) has evolved guidelines on usage <strong>of</strong> Geotech products in Rail projects, they<br />
don’t have any data on actual usage since usage <strong>of</strong> Geotech products in projects is decided by the<br />
Regional Railway Divisions individually. In the absence <strong>of</strong> precise user data, we have estimated usage<br />
based on discussion with <strong>Industry</strong> and analysis <strong>of</strong> railway construction tenders.<br />
28 Analysis based on data/information received from Railways. IMaCS has made appropriate adjustments because <strong>of</strong><br />
insufficient data.
In order to predict growth <strong>of</strong> Geo<strong>textiles</strong>, we need to evaluate the possibility <strong>of</strong> the Infrastructure<br />
projects staying on course as scheduled. Due to the current financial market crisis and restricted credit<br />
availability, many Infrastructure projects are being delayed. However Infrastructure projects (being<br />
necessarily long gestation term projects) should speed up after a three-four year lag. We also expect<br />
that projects for Roads (which is a significant demand area) will come online as much <strong>of</strong> the<br />
committed spend is yet to take place. NHAI is yet to award initiate work on the majority <strong>of</strong> NHDP<br />
Phase III and Phase V (up gradation, 4/6 laning work).<br />
Total Length<br />
(Km.)<br />
Already 4-Laned<br />
(Km.)<br />
Under<br />
Implementation<br />
GQ<br />
NHDP & Other NHAI Projects<br />
(Status :30th September, 2008)<br />
NS -<br />
EW NHDP<br />
Ph. I &<br />
II<br />
NHDP Port<br />
Phase<br />
III<br />
NHDP<br />
Phase V<br />
NHDP<br />
Total<br />
Connect<br />
ivity<br />
Others<br />
Total<br />
by<br />
NHAI<br />
5,846 7,300 12,109 6,500 31,755 380 962 33,097<br />
5,698 2,838 551 25 9,112 203 671 9,986<br />
(Km.) 148 3,483 1,524 1,005 6,160 171 271 6,602<br />
Contracts Under<br />
Implementation<br />
(No.) 16 141 28 2 187 8 15 210<br />
Balance length for<br />
award<br />
(Km.)<br />
- 821 10,034 5,470 16,325 6 20 16,351<br />
Further, Phase VI and Phase VII (with Ring Roads, Expressways and Bridges) which by the nature <strong>of</strong><br />
the works involved should see high-usage <strong>of</strong> Geo<strong>textiles</strong> are still in the pipeline. We expect currently<br />
planned projects to pick up speed after three years (e.g. Pending NHAI projects are also expected to<br />
be released in due course as part <strong>of</strong> Government initiatives to boost the economy).<br />
Moreover, promotion <strong>of</strong> the use <strong>of</strong> geomembrane as lining for canals, ponds and reservoirs by the<br />
National Horticulture Mission is likely to boost the <strong>consumption</strong> <strong>of</strong> Geomembrane. Keeping the
above factors in mind, we have assumed a growth <strong>of</strong> 12% for Geo<strong>textiles</strong>. The Consumption <strong>of</strong><br />
Geo<strong>textiles</strong> can thus be expected to grow to Rs 326 Crore by 2012-2013.<br />
6. Imports & Exports <strong>of</strong> TT product<br />
Geo<strong>textiles</strong> are imported under HS codes shown below:<br />
Total<br />
Imports<br />
Value (Rs<br />
Crore)<br />
Estimated<br />
Geo<strong>textiles</strong><br />
Value (Rs<br />
Crore)<br />
HS Code Description<br />
2007-08 2007-08<br />
39189090 FLOOR COVERING OF OTHER PLASTICS NES<br />
OTHR SHETS ETC OF OTHR ACRYLIC<br />
21.88 1.8<br />
39205999<br />
POLYMER NES<br />
OTHR PLTS,SHTS,FILM FOIL,STRIP ETC NES<br />
2.98 1.33<br />
39219099<br />
OTHER 272.02 10.38<br />
39269099 OTHR ARTICLE OF PLASTIC NES<br />
FELT,IMPRGNATED,COATED,COVERED OR<br />
851.78 52.37<br />
56029000<br />
LAMINATED 10.99 1.21<br />
56031100 MAN-MADE FILMNT WGHNG150G/SQM<br />
OTHER FILMNT WGHNG BETWN 70G/SQM<br />
13.52 1.12<br />
56039300<br />
AND 150G/SQM 12.14 2.82<br />
56039400 OTHER FILMNT WGHNG >150G/SQM 77.84 19.87<br />
56049000 OTHER RUBBER THREAD,CORD ETC 18.82 5.36<br />
Total Imports 1338.93 105.12<br />
Source: DGCIS, IBIS, IMaCS Analysis<br />
Since most <strong>of</strong> these HS codes are used for a variety <strong>of</strong> products, we have estimated the import <strong>of</strong><br />
fabric/products meant for use as Geo<strong>textiles</strong> as around Rs 105 Crore.<br />
Geo<strong>textiles</strong> are largely exported under HS codes shown below:<br />
Total<br />
Exports Geo<strong>textiles</strong><br />
HS Code Description<br />
Estimated<br />
Value (Rs Value (Rs<br />
Crore) Crore)<br />
2007-08 2007-08<br />
39189090 Floor Covering <strong>of</strong> other plastics 76.60 4.20<br />
39269080<br />
Polypropylene articles, not elsewhere specified or<br />
included<br />
300.65 53.00<br />
63051080 Jute Soil Savers 10.43 10.43<br />
56090010 Coir Products (e.g. Coir Fender) 14.84 14.44
56031100,<br />
56031200,<br />
56031300,<br />
56031400,<br />
56039200,<br />
56039300,<br />
56039400<br />
Non-Woven (Various) cumulative 13.14 5.00<br />
Total<br />
Imports 415.66 87<br />
Source: DGCIS, IBIS, IMaCS Analysis<br />
As in the case <strong>of</strong> imports, since most <strong>of</strong> these HS codes are used for a variety <strong>of</strong> products, we have<br />
estimated the import <strong>of</strong> fabric/products meant for use as Geo<strong>textiles</strong>, which is around Rs 87 Crore.<br />
These exports are estimated to be Rs 127.8 crore for the year 2012-13.<br />
7. Key importers & exporters<br />
Some <strong>of</strong> the key importers in the Indian market are listed below:<br />
• Garware Wall Ropes, represents Tensar International <strong>of</strong> UK<br />
• Maccaferi India itself imports products like geo-grids which it doesn’t manufacture here.<br />
• Terram is represented by its distributor - Terracorp situated in Gurgaon.<br />
• Huesker is represented by its distributor – Archana Structural Engineering<br />
Dupont also sells its own non-woven brands directly through its <strong>of</strong>fice. Manufacturers like Kusumgar<br />
also import on the project specific basis.<br />
Ambica Polymers, SKAPs and TechFab export to the US and Europe<br />
8. Manufacturing process and Type <strong>of</strong> Raw materials<br />
Geo<strong>textiles</strong> are manufactured from polypropylene, polyester or polyethylene which can be either<br />
woven or non-woven. Manufacturing process for Woven products includes Weaving / Knitting<br />
and Coating (PVC). Products can be - woven multi-filament, woven slit-film mon<strong>of</strong>ilament and<br />
woven slit-film multifilament. The non-woven Geo<strong>textiles</strong> can be made from heat bonding or<br />
needle-punching. Geogrids are knitted, while Geonets and Geomembranes are extruded from<br />
HDPE.<br />
9. Key machinery manufacturers/suppliers in India<br />
Most units surveyed used Sulzer looms for manufacturing Woven Geo<strong>textiles</strong>. Knitting machines<br />
from Karl Mayer are also used. Nonwoven needle-punching lines from Hunter, Dilo Group and<br />
Trutzschler are used. In India, the leading machinery vendors are represented by ATE and Voltas.<br />
10. Quality Control and standards in India
At present, majority <strong>of</strong> manufacturers <strong>of</strong> geo<strong>textiles</strong> follow ASTM and EN standards. BIS has<br />
formulated the standard [TX 30 (0934)] for geo-synthetics made from poly-olefin or polyester<br />
material for highways however, it is in draft stage and still has to be finalised.<br />
Geo-membranes used as lining for canals, ponds and reservoirs to control seepage and for proper<br />
disposal <strong>of</strong> industrial effluents etc.are governed by IS 15351:2008.<br />
11. Impediments to growth in domestic and export market<br />
The major impediments to growth in the domestic market are as follows:<br />
• Road Projects in India have traditionally been awarded on the lowest cost bid model, based on<br />
specifications provided by the state agency (NHAI/PWD etc). Road construction projects,<br />
even in NHDP contracts, are low margin businesses. Consequently, major contractors<br />
hesitated to use significant quantity <strong>of</strong> Geosynthetics despite its clear benefits. However with<br />
changing norms such as introduction <strong>of</strong> DBFO model wherein concessionaires have the<br />
freedom to design independently, and being responsible for maintenance also have an interest<br />
in ensuring longevity <strong>of</strong> construction at optimal cost, it is likely that some <strong>of</strong> the pitfalls <strong>of</strong> the<br />
L1-system can be avoided.<br />
• Many <strong>of</strong> key end-users and Government agencies are <strong>of</strong> the opinion that while Geo<strong>textiles</strong><br />
may be beneficial, it is just one <strong>of</strong> many civil engineering solutions and hence its usage has to<br />
be seen on a case by case basis depending on cost, availability, time criticality.<br />
Understandably, this conservatism also impacts the adoption <strong>of</strong> Geo<strong>textiles</strong> in many projects.<br />
Other<strong>wise</strong>, State level government agencies (PWD etc) need more awareness about the<br />
benefits <strong>of</strong> Geo<strong>textiles</strong>.<br />
• Lack <strong>of</strong> adequate testing facilities was cited as a major impediment by most end-users. Lack<br />
<strong>of</strong> certification <strong>of</strong>ten leads to delay as there are no obvious means at project sites to verify if<br />
the material will actually confirm to the design specifications. Contractors <strong>of</strong>ten work on tight<br />
timelines and budgets and are unwilling to order material much in advance.<br />
• Alongside awareness, availability <strong>of</strong> trained <strong>technical</strong> personnel is also critical for<br />
manufacturing to improve.<br />
• Geo<strong>textiles</strong> are not included in the ‘Schedule <strong>of</strong> Rates’ <strong>of</strong> tenders floated by Public Works<br />
Departments at both Centre and State levels as well as in the IRC guidelines. This inhibits the<br />
<strong>consumption</strong> <strong>of</strong> Geo<strong>textiles</strong> since the contractors prefer to use the materials mentioned in the<br />
Schedule <strong>of</strong> Rates.<br />
In the export market, Indian manufacturers are currently at small scale compared to European or<br />
even Chinese manufacturers who benefit from economy <strong>of</strong> scale.
• EOU Units like Ambica export their entire production. For such small units, raw material<br />
prices are a significant concern.<br />
Most producers are <strong>of</strong> the opinion that mandatory usage only will promote demand for<br />
geo<strong>textiles</strong>, leading to greater investments and realisation <strong>of</strong> scale, in turn making the products<br />
cheaper and more competitive for both domestic usage and exports. However mandatory usage<br />
may not be feasible for the reasons - Geo<strong>textiles</strong> are just one among many geo<strong>technical</strong> solutions,<br />
and given the conservative approach <strong>of</strong> many Government Institutions, awareness is still building<br />
up.
OEKOTECH<br />
Oekotech segment refers to use <strong>of</strong> <strong>technical</strong> <strong>textiles</strong> in Environmental Engineering. The primary<br />
segment in this is Landfill waste management. This refers to the use <strong>of</strong> Geosynthetic products to<br />
secure landfills against leakage <strong>of</strong> municipal or hazardous waste. Other areas include secondary<br />
protection in Chemical/Oil Industries (ground covers and the like around process tanks for secondary<br />
containment should the tanks leak).<br />
A modern engineering landfill has the following components - a basal lining system to prevent the<br />
contamination <strong>of</strong> soil, and ground water by pollutants, a capping system to seal the waste when the<br />
capacity <strong>of</strong> the landfill is exhausted, an impervious sealing layer which prevents the entry <strong>of</strong><br />
pollutants in the ground, a leachate collection system for the collection and transmission <strong>of</strong> leachates<br />
to a collection pit, a secondary leachate collection/leak detection system.<br />
The market is expected to grow based on spends on municipal waste disposal in accordance<br />
with Municipal Solid Wastes (Management & Handling) Rules, 2000, as well as greater<br />
awareness and government activity on Hazardous Waste in accordance with Supreme Court<br />
Guidelines. The market for Landfill management projects is currently around Rs 68 Crore.<br />
Summary <strong>of</strong> Data<br />
Current Market size is Rs 68 Crore. Market over the next 5 years i.e. 2007-2012 is as shown:<br />
Category<br />
Annual<br />
Waste<br />
(MT)<br />
Landfill<br />
Area (Sq<br />
KM)<br />
Avg Cost<br />
<strong>of</strong> TT<br />
(Rs.Sq M)<br />
Value (Rs<br />
Crore)<br />
Volume (Million<br />
Sq M)<br />
Municipal<br />
Waste 14 Mn 14.2 340 482.8 28.4<br />
Hazardous<br />
Waste 8 Mn 4.2 340 142.8 8.4<br />
As per ECTT Report, the market size estimated was:<br />
Period 2003-08 2007-08<br />
ECTT<br />
Category<br />
Land<br />
Area<br />
(Km2)<br />
Rate<br />
Rs/Sq M<br />
Value Rs<br />
Crore<br />
Value<br />
Rs<br />
Crore<br />
MSW 11.83 210 248.67 99.47<br />
HW 2.15 210 45.24 18.1<br />
13.98 293.91 117.57
Introduction <strong>of</strong> the product / application areas<br />
Oekotech application segment includes concepts in environmental protection, waste disposal and<br />
recycling. The most well known concept is the use <strong>of</strong> geosynthetic products (discussed earlier in<br />
Geotech) in Landfill management. Secure landfills are considered to be the best available <strong>technical</strong><br />
option for the safe disposal <strong>of</strong> large volumes <strong>of</strong> solid waste/slurry. Waste management (both<br />
Municipal and Hazardous) has become a major environmental issue in India as well as other<br />
countries.<br />
A modern engineering landfill has the following components - a basal lining system to prevent the<br />
contamination <strong>of</strong> soil, and ground water by pollutants, a capping system to seal the waste when the<br />
capacity <strong>of</strong> the landfill is exhausted, an impervious sealing layer which prevents the entry <strong>of</strong><br />
pollutants in the ground, a leachate collection system for the collection and transmission <strong>of</strong> leachates<br />
to a collection pit, a secondary leachate collection/leak detection system.<br />
Geosynthetics are extensively used in the design <strong>of</strong> both base and cover liner systems <strong>of</strong> landfill<br />
facilities. The products include:<br />
• Geogrids,which can be used to reinforce slopes beneath the waste, reinforce walls as well as<br />
to reinforce cover soils above geomembranes;<br />
• Geonets, which can be used for in-plane drainage;<br />
• Geomembranes,which are relatively impermeable sheets <strong>of</strong> polymeric formulations that can<br />
be used as a barrier to liquids, gases and/or vapors; provide the critical functions <strong>of</strong> leachate<br />
containment, protection <strong>of</strong> ground water and Landfill Gas (LFG). They are also used in<br />
landfill caps.<br />
• Geocomposites, which consist <strong>of</strong> two or more geosynthetics, can be used for separation,<br />
filtration or drainage;<br />
• Geosynthetic clay liners (GCLs), which are composite materials consisting <strong>of</strong> Bentonite and<br />
geosynthetics that can be used as an infiltration/hydraulic barrier; they find application not<br />
only in landfills/waste management but also for mine rehabilitation, tunnels, secondary<br />
containment e.g. <strong>of</strong> petrochemicals, landscaping etc.<br />
• Geopipes, which can be used in landfill applications to facilitate collection and rapid drainage<br />
<strong>of</strong> the leachate to a sump and removal system;<br />
• Geo<strong>textiles</strong>, which can be used for filtration purpose or as cushion to protect the<br />
geomembrane from puncture.<br />
Product characteristics
Both woven and non-woven geosynthetics are used. Geosynthetic clay liners consist <strong>of</strong> non-woven<br />
fabric layers <strong>of</strong> 180-250 GSM with an intermediate layer <strong>of</strong> Bentonite mineral (Unit Mass: 1-5 kg/sq<br />
m). Geo<strong>textiles</strong> used for filtration/cushion are typically high GSM (285 – 3000) non-woven fabrics.<br />
HDPE geomembranes are manufactured using approximately 97% high molecular weight<br />
polyethylene, 2 to 3% carbon black, and 0.5 to 1.0% stabilizers and antioxidants. Some salient<br />
features <strong>of</strong> HDPE geomembrane include chemical resistance, low permeability and ultraviolet<br />
resistance. The thickness <strong>of</strong> this geomembrane is 2 mm.<br />
Market dynamics and key growth drivers:<br />
Issue <strong>of</strong> waste management has seen rising public and government awareness over the years. Waste<br />
can be categorized as Municipal Solid Waste (MSW) and Hazardous Waste (HW).<br />
The per capita MSW generated in India ranges from above 100 grams in small town to over 600<br />
grams in large cities. In India these are collected by respective municipalities and transported to<br />
disposal sites which are normally low lying areas outside the city. Given the limited revenues <strong>of</strong><br />
municipalities, most bodies have not been able to afford the treatment and disposal <strong>of</strong> MSW required<br />
under environmental guidelines. Not surprisingly, many urban waste sites pose a serious health<br />
hazard for the semi-urban/rural communities nearby. Municipal Solid Wastes (Management &<br />
Handling) Rules, 2000 (MSW Rules) are applicable to every municipal authority responsible for<br />
collection, segregation, storage, transportation, processing and disposal <strong>of</strong> municipal solid. In early<br />
2007, only a handful <strong>of</strong> urban areas – Surat, Pune, Ahmedabad Urban Development Authority, Puttur,<br />
Karwar, Navi Mumbai and Bangalore had engineered landfill sites.<br />
Hazardous waste consists <strong>of</strong> corrosive, reactive, ignitable and toxic wastes. India produces at least 8<br />
million tones <strong>of</strong> HW every year (CPCB data submitted to Supreme Court Monitoring Committee,<br />
2006). These in turn are currently dumped at over 118 known sites in India. Waste<br />
Management/Pollution Control was largely under the purview <strong>of</strong> Central Pollution Control Board at<br />
the central level and State Pollution Control Boards/ Pollution Control Committees. This is under the<br />
ambit <strong>of</strong> the Hazardous Waste (Management & Handling) Rules, 1989 notified by the Ministry <strong>of</strong><br />
Environment & Forests (MoEF) under Environment (Protection) Act, 1986 (further amendments<br />
made in the year 2000 and 2003)<br />
In 2003, basis the hearings <strong>of</strong> a PIL filed in the Supreme Court <strong>of</strong> India, the Supreme Court directed<br />
major changes in the Waste Management system in India. Amendments were made in the Hazardous<br />
Waste Rules and a monitoring committee set up. Subsequently, as per those directives, all states have<br />
to set up suitably prepared landfill sites and Treatment, Storage and Disposal Facilities (TDSF). For<br />
Municipal Waste, CPCB and MOEF have instituted a scheme for setting up <strong>of</strong> demonstration project<br />
for solid waste management in accordance with MSW Rule, with 12 projects across 12 states. The
Twelfth Finance Commission has recommended devolution <strong>of</strong> grants for Urban Local Bodies to the<br />
tune <strong>of</strong> Rs.5000 crore for the period 205-2010 <strong>of</strong> which Rs.2500 crore have to be devolved upon local<br />
bodies exclusively for setting-up <strong>of</strong> solid waste management systems in Urban areas to ensure<br />
management <strong>of</strong> MSW in accordance with MSW Rules. CPCB’s annual report (’07) states that as per<br />
information provided by SPCBs, landfill facilities have been constructed at Bangalore, Mangalore,<br />
Karwar, Puttur, Ankola, Surat, Alang, Nashik, Ambad, Sonpeth, Viziaanagaram (AP), Jodhpur, Sirsa<br />
and Ambala. Regional/common landfill facilities are under construction at Ahmedabad, North Dum-<br />
Dum, New Barrackpore and Chandigarh.<br />
Clearly most states are yet to develop significant number <strong>of</strong> landfills for both categories <strong>of</strong> waste. At<br />
the same time, as the Indian economy develops further, waste generated will increase (due to greater<br />
retail <strong>consumption</strong> <strong>of</strong> use and throw products, ready to eat etc). However, given the required<br />
regulatory framework already in place, once the State Government agencies get the basic groundwork<br />
in place by identifying sites, going forward these sites will represent a significant opportunity for use<br />
<strong>of</strong> Technical Textiles.<br />
Key manufacturers <strong>of</strong> the product with information on capacity / production / sales<br />
Currently, only one player – Ashapura group is manufacturing Geosynthetic Clay Liners in India.<br />
Ashapura Volclay Limited has set up India’s first Geosynthetic Clay Liner Plant using technology<br />
from CETCO (A subsidiary <strong>of</strong> AMCOL International), with an estimated capacity <strong>of</strong> 5 million square<br />
meter per annum.<br />
Market size <strong>of</strong> TT product and future forecast<br />
Some <strong>of</strong> the prominent engineering contractors active in waste management include UPL<br />
Environmental Engineers, Ramky, MEPL, Baruch Enviro & Surat Infrastructure. Garware’s<br />
Geosynthetics division has also executed projects in this space. Basis discussions with <strong>Industry</strong>, waste<br />
management contracts in 2007-2008 used up an estimated Rs 68 Crore worth <strong>of</strong> Technical Textile<br />
products.<br />
Components <strong>of</strong> Landfill<br />
Lakh Sq<br />
M<br />
Approx<br />
Rate/ Sq M Cost Rs Lakh<br />
Non woven needle punched geotextile 40 56 2240<br />
Woven Geotextile 0.7 32.5 22.75<br />
HDPE Liner 20 120 2400<br />
Geocomposite 11.7 185 2164.5
Total 72.40 6827.25<br />
Source: <strong>Industry</strong> survey, IMaCS Analysis<br />
Assumptions: All projects have been assumed as double liner landfills<br />
This market is growing at around 6%-7% per annum as per <strong>Industry</strong> experts since Municipal spends<br />
on engineered landfills have been much behind schedule.<br />
We can also estimate the total potential for Landfill applications by arriving at the total area required<br />
for waste management. As per data from a CPCB study (2006) covering 59 Urban Agglomerations<br />
(Metros/major cities/state capitals, UTs), India cumulatively generated around 14 million MT <strong>of</strong><br />
waste. Like<strong>wise</strong>, an estimated 8 million MT Hazardous waste is also generated by Industrial units. We<br />
have accordingly estimated the area required for the same and assuming an average per unit area<br />
<strong>technical</strong> textile component cost <strong>of</strong> a landfill, arrived at the total potential usage to be achieved over<br />
the next 5 years:<br />
Annual Landfill Area Avg Cost <strong>of</strong> Value (Rs Volume (Million<br />
Category Waste (MT) (Sq KM) TT (Rs.Sq M) Crore) Sq M)<br />
Municipal Waste 14 Mn 14.2 340 482.8 28.4<br />
Hazardous Waste 8 Mn 4.2 340 142.8 8.4<br />
Note:<br />
1. Engineered Landfills are assumed tohave a height <strong>of</strong> 15 m, for estimating average landfill area.<br />
2. Life <strong>of</strong> landfill is estimated at 20 years, post which it would have to be capped.<br />
3. Average Cost/Sq M assumes use <strong>of</strong> double liner - non-woven, HDPE liner and geocomposites as<br />
discussed in previous section. This however may vary from site to site depending on engineering<br />
specifications, topography<br />
We estimate this to be potential to be realized over the next five years as greater municipal spends on<br />
landfills drives growth. The market size is accordingly expected to reach Rs 160 Crore by 2012-2013.<br />
Category<br />
2012-2013<br />
(Rs Crore)<br />
Municipal Waste 123.48<br />
Hazardous Waste 36.52<br />
We have not taken into account other potential application areas such as landscaping (Golf courses,<br />
Ponds etc), Mine rehabilitation, Tunnel linings etc since these applications do not represent<br />
predictable, recurring usage currently.<br />
Imports & Exports <strong>of</strong> TT product<br />
HS Codes for GCLs are usually – 39269099, which is also used for Geo<strong>textiles</strong>.<br />
Key importers & exporters
Currently, key importers <strong>of</strong> GCL in India include Ge<strong>of</strong>abrics India, Garware Wall Ropes<br />
(Geosynthetics Division).<br />
Manufacturing process and Type <strong>of</strong> Raw materials<br />
GCLs are manufactured from quality polypropylene geo<strong>textiles</strong> and premium grade Sodium Bentonite<br />
powder. The upper and base layers <strong>of</strong> geo<strong>textiles</strong> can be <strong>of</strong> non-woven and wove fabric respectively.<br />
Typically, Bentonite clay is placed on a woven Geotextile, with the non-woven cover then being<br />
placed. They are fibre-reinforced by needle-punching the composite across the entire surface area <strong>of</strong><br />
the product, and are then thermally-locked to ensure high long-term shear strength.<br />
Key machinery manufacturers/suppliers in India<br />
Machinery used for Geo<strong>textiles</strong> is used for manufacturing liners used in GCL.<br />
Quality Control and standards in India / other countries<br />
No BIS Code is currently applicable in India. The typical properties <strong>of</strong> GCL which need to be<br />
checked are Swell Index, Fluid Loss, Bentonite Mass/Unit Area, Tensile Strength and Mid-Plane<br />
Shear Strength (all <strong>of</strong> which have defined values under ASTM test methods).<br />
Impediments to growth in domestic and export market<br />
Landfills need to be recognized as the last solution for waste management, after options <strong>of</strong><br />
reduction/segregation, recycling, treatment, incineration for energy etc have been utilized. At the<br />
same time, diversion <strong>of</strong> land for waste disposal is <strong>of</strong>ten difficult due to serious scarcity <strong>of</strong> vacant land<br />
as well opposition from local communities. Naturally lack <strong>of</strong> progress on landfills would impede the<br />
use <strong>of</strong> geo-<strong>textiles</strong>. Further, lack <strong>of</strong> adequate enforcement <strong>of</strong> laws and delay on part <strong>of</strong> Government<br />
bodies (as discussed in previous sections) also impacts growth in the domestic market. For smaller<br />
urban local bodies, financial constraints and lack <strong>of</strong> knowledge also act as barriers since economy <strong>of</strong><br />
scale may not be realized in smaller landfills.<br />
INDUTECH<br />
Indutech includes <strong>technical</strong> textile products used in the manufacturing sector. The <strong>technical</strong> textile<br />
products covered under Indutech are given below:-<br />
• Conveyor belts (TT component)<br />
• Drive belts (TT component)<br />
• Cigarette filter rods<br />
• Decatising cloth<br />
• Bolting cloth
• AGM glass battery separators<br />
• Coated abrasives (TT component)<br />
• Ropes & cordages<br />
• Composites (<strong>technical</strong> <strong>textiles</strong> component)<br />
• Printed circuit boards (TT component)<br />
• Computer printer ribbon<br />
• Paper making fabrics<br />
• Filteration Products<br />
Technical <strong>textiles</strong> <strong>consumption</strong> under Indutech in India is estimated at around Rs 2,326 crore.<br />
Prineted circuit boards, AGM battery separators and other applications <strong>of</strong> fibre glass constitute around<br />
one-third <strong>of</strong> the <strong>technical</strong> <strong>textiles</strong> usage in Indutech valued at Rs 743 crore in 2007-08 and are<br />
expected to grow at over 17% year on year. Ropes and cordages account for around 30% share in the<br />
Indutech segment valued at Rs 669 crore in 2007-08. Computer printon ribbon, filteration products,<br />
conveyor belts & drive belts, cigarette filters are the other key products in the segment each<br />
accounting for around 8-10% <strong>of</strong> the segment.<br />
Overall, the domestic <strong>consumption</strong> <strong>of</strong> <strong>technical</strong> <strong>textiles</strong> under Indutech is expected to increase from<br />
around Rs 2,326 crore in 2007-08 to around Rs 4,090 crore by 2012-13 growing at a CAGR <strong>of</strong> around<br />
12%.<br />
The total segment imports are Rs 859 crore and account for one third <strong>of</strong> the total domestic<br />
<strong>consumption</strong>. The exports are worth Rs 762 crore and account for around 35% <strong>of</strong> the total production.<br />
Summary <strong>of</strong> the market-sizing for Indutech<br />
Conveyor<br />
belts (TT<br />
component)<br />
Drive belts<br />
(TT<br />
component)<br />
Cigarette<br />
filter rods<br />
Quantity<br />
Value<br />
Quantity<br />
Value<br />
Quantity<br />
Production Imports Exports<br />
2007-08 2012-13<br />
<strong>Domestic</strong><br />
Consumption<br />
<strong>Domestic</strong><br />
Consumption<br />
6,040 MT 400 MT 2,500 MT 3,940 MT 6,062 MT<br />
Rs 160<br />
crore<br />
Rs 11<br />
crore<br />
Rs 66 crore Rs 105 crore Rs 162 crore<br />
6,018 MT 1,237 MT 2,178 MT 5,067 MT 7,288 MT<br />
Rs 86<br />
crore<br />
Approx<br />
14,310<br />
million<br />
Rs 34<br />
crore<br />
Approx<br />
90 million<br />
nos.<br />
Rs 36 crore Rs 84 crore Rs 121 crore<br />
Around<br />
400<br />
million<br />
14,000 million<br />
nos.<br />
17,000<br />
million nos.<br />
Export<br />
Potential<br />
Rs 106<br />
crore<br />
Rs 40<br />
crore
Decatising<br />
cloth<br />
Bolting<br />
cloth<br />
AGM glass<br />
battery<br />
separators<br />
Coated<br />
abrasives<br />
(TT<br />
component)<br />
Ropes &<br />
cordages<br />
Composites<br />
(TT<br />
component)<br />
Printed<br />
circuit<br />
boards (TT<br />
component)<br />
Computer<br />
printer<br />
ribbon<br />
Filteration<br />
Products<br />
Value<br />
Quantity<br />
Value<br />
Quantity<br />
Value<br />
Quantity<br />
Value<br />
Quantity<br />
Value<br />
Quantity<br />
Value<br />
Quantity<br />
Value<br />
Quantity<br />
Value<br />
Quantity<br />
Value<br />
Quantity<br />
Production Imports Exports<br />
nos. nos.<br />
Rs 157<br />
crore<br />
1.15<br />
million<br />
meters<br />
Rs 26<br />
crore<br />
2 lakh sq<br />
m<br />
Rs 10<br />
crore<br />
-<br />
-<br />
16.7<br />
million<br />
meters<br />
Rs 89<br />
crore<br />
126,371<br />
MT<br />
Rs 704<br />
crore<br />
73,000<br />
MT<br />
Rs 641<br />
crore<br />
2007-08 2012-13<br />
<strong>Domestic</strong><br />
Consumption<br />
<strong>Domestic</strong><br />
Consumption<br />
Rs 2 crore Rs 7 crore Rs 152 crore Rs 182 crore<br />
0.05<br />
million<br />
meters<br />
-<br />
1.2 million<br />
meters<br />
1.4 million<br />
meters<br />
Rs 4 crore - Rs 30 crore Rs 35 crore<br />
4 lakh sq<br />
m<br />
Rs 15<br />
crore<br />
20.1<br />
million sq<br />
m<br />
Rs 60.3<br />
crore<br />
-<br />
- -<br />
6 lakh sq m 7 lakh sq m<br />
Rs 25 crore Rs 30 crore<br />
20.1 million sq<br />
m<br />
- Rs 60.3 crore<br />
16.7 million<br />
meters<br />
51.6 million<br />
Rs 150.8<br />
crore<br />
26.9 million<br />
meters<br />
- - Rs 89 crore Rs 143 crore<br />
10,000<br />
MT<br />
Rs 165<br />
crore<br />
60,000<br />
MT<br />
Rs 443<br />
crore<br />
21,000 MT 115,371 MT 170,066 MT<br />
Rs 200<br />
crore<br />
Rs 669 crore<br />
Rs 1,037<br />
crore<br />
33,000 MT 1,00,000 MT 1,75,000 MT<br />
Rs 434<br />
crore<br />
Rs 650 crore<br />
Rs 1,400<br />
crore<br />
- 6,615 MT - 6,615 MT 35,577 MT<br />
-<br />
Rs 184.4<br />
crore<br />
Rs 33<br />
crore<br />
554 nos. 519 nos.<br />
Rs 16.5<br />
crore<br />
3.75<br />
million<br />
sqm<br />
- Rs 33 crore Rs 178 crore<br />
Rs 7.1<br />
crore<br />
0.1<br />
million<br />
sqm<br />
12.9 million sq<br />
m<br />
18.4 million<br />
sq m<br />
Rs 193.8 crore Rs 290 crore<br />
Export<br />
Potential<br />
Rs 7.7<br />
crore<br />
-<br />
-<br />
-<br />
-<br />
Rs 402<br />
crore<br />
Rs 609<br />
crore<br />
-<br />
Rs 7.1<br />
crore
Paper<br />
making<br />
fabrics<br />
TOTAL<br />
Value<br />
Quantity<br />
Value<br />
Value<br />
Production Imports Exports<br />
Rs 86crore<br />
Rs 85.5<br />
crore<br />
Rs 2,229<br />
crore<br />
Rs 60<br />
crore<br />
1128<br />
pieces<br />
Rs 15<br />
crore<br />
Rs 859<br />
crore<br />
2007-08 2012-13<br />
<strong>Domestic</strong><br />
Consumption<br />
<strong>Domestic</strong><br />
Consumption<br />
Rs 4 crore Rs 142 crore Rs 243 crore<br />
540 pieces 5,300 MT 12,500 MT<br />
Rs 7.5<br />
crore<br />
Rs 762<br />
crore<br />
Rs 93 crore Rs 119 crore<br />
Rs 2,326 crore<br />
As per ECTT report, the potential market sizing for 2007-08 was as given below:-<br />
Market size<br />
(ECTT report)<br />
Conveyor belts<br />
Hoses<br />
Ropes & cordages<br />
Drive belts<br />
Computer ribbons<br />
Battery separators<br />
Filtration media<br />
Decatising cloth<br />
2001-02 2007-08 (P)<br />
Quantity 3,230 MT 4,847 MT<br />
Value Rs 94 crore Rs 140 crore<br />
Quantity<br />
Value Rs 99 crore Rs 157 crore<br />
Quantity 74,000 MT 114,160 MT<br />
Value Rs 407 crore Rs 628 crore<br />
Quantity 2,000 MT 2,680 MT<br />
Value Rs 50 crore Rs 67 crore<br />
Quantity 3 million sq m 14.5 million sq m<br />
Value Rs 30 crore Rs 145 crore<br />
Quantity 8.83 million sq m 21.63 million sq m<br />
Value Rs 23 crore Rs 56.33 crore<br />
Quantity<br />
Value Rs 81 crore Rs 132 crore<br />
Quantity 1 million meters 1.26 million meters<br />
Value Rs 25 crore Rs 31.6 crore<br />
Rs 4,091<br />
crore<br />
Export<br />
Potential<br />
-<br />
Rs 10<br />
crore<br />
Rs 1,182<br />
crore
Market size<br />
(ECTT report)<br />
Bolting cloth<br />
Quantity<br />
2001-02 2007-08 (P)<br />
Value Rs 10 crore Rs 12 crore<br />
TOTAL Value Rs 819 crore Rs 1,368.93 crore<br />
Capital Employed and Pr<strong>of</strong>itability <strong>of</strong> key players <strong>of</strong> Indutech<br />
Company Name<br />
Capital Employed Net Pr<strong>of</strong>it Margin<br />
(Rs crore)<br />
(%)<br />
2007-<br />
2006-07 2007-08 2006-07 08<br />
Abee Info-Consumables Ltd. 12.1 NA -2.8% NA<br />
Akasaka Electronics Ltd. [Merged] 17.6 19.1 6.7% 3.6%<br />
At & S India Pvt. Ltd. 132.5 117.0 1.0% 4.2%<br />
Axel Polymers Ltd. 4.3 5.1 0.2% 2.8%<br />
Bombay Dyeing & Mfg. Co. Ltd. 959.5 1238.1 -7.4% -4.8%<br />
Carborundum Universal Ltd. 414.1 631.4 10.7% 13.0%<br />
Circuit Systems (India) Ltd. 34.7 50.8 6.2% 5.5%<br />
Fenner (India) Ltd. 239.0 297.6 19.0% 6.8%<br />
Garware-Wall Ropes Ltd. 184.2 245.2 6.5% 5.9%<br />
Goa Glass Fibre Ltd. 104.9 105.2 0.5% 4.0%<br />
Goodyear India Ltd. 173.4 141.3 4.8% 4.1%<br />
Grindwell Norton Ltd. 195.9 277.5 10.6% 19.2%<br />
L G Balakrishnan & Bros. Ltd. 328.5 303.7 4.2% 2.4%<br />
Lipi Data Systems Ltd. 53.9 68.2 4.7% 7.8%<br />
M R F Ltd. 1106.9 1297.9 1.9% 3.4%<br />
Nirlon Ltd. 127.2 235.8 6.0% 4.3%<br />
Owens-Corning (India) Ltd. 374.9 378.1 0.7% 3.5%<br />
Phoenix Yule Ltd. 86.7 NA 5.8% NA<br />
Pix Transmissions Ltd. 103.9 114.7 1.0% 0.9%<br />
Polymer Papers Ltd. 5.0 4.3 0.1% -5.0%<br />
Purolator India Ltd. 60.7 NA 1.9% NA<br />
S R F Ltd. 1285.9 1330.9 14.6% 7.7%<br />
T V S Electronics Ltd. 41.4 50.6 0.6% 4.8%<br />
U P Twiga Fiberglass Ltd. 93.5 92.3 7.9% 4.2%<br />
Voith Paper Fabrics India Ltd. 69.8 78.3 18.5% 19.0%<br />
Source: Prowess Database, IMaCS Analysis
Indutech segment <strong>of</strong> <strong>technical</strong> <strong>textiles</strong> is estimated to provide employment to 1 lakh people 29 <strong>of</strong> whom<br />
number <strong>of</strong> <strong>technical</strong> 30 employees is estimated at 65,000 and number <strong>of</strong> non-<strong>technical</strong> employees is<br />
estimated at 35,000.<br />
Decatising Cloth<br />
Decatising cloth, also known as Decatising wrapper is an industrial fabric used in Decatising<br />
machines. The fabric is an integral part <strong>of</strong> both Open Decatising and Kier Decatising machines that<br />
are majorly used for mechanical finishing <strong>of</strong> woven fabrics.<br />
Product characteristics<br />
Decatising cloth is a polyamide/cotton or polyester/cotton blended woven fabric available in weights<br />
ranging from 400 gsm to 600 gsm.<br />
Market dynamics and key growth drivers<br />
Decatising wrapper is used for mechanical finishing <strong>of</strong> synthetic fabrics or synthetic rich blends.<br />
<strong>Industry</strong> survey reveals that textile manufacturers are switching to other finishing machines thus,<br />
reducing the demand <strong>of</strong> the wrapper. Moreover, because <strong>of</strong> changing fashion trends cotton and cotton<br />
rich blends have become popular. The shift in demand towards cotton and cotton blends has also<br />
affected the demand <strong>of</strong> decatising wrapper.<br />
Market size <strong>of</strong> decatising cloth and future forecast<br />
Decatising cloth is used for the finishing <strong>of</strong> woven fabrics. For this purpose, it is used as a wrapper on<br />
the beam <strong>of</strong> Decatising machine; the <strong>consumption</strong> per beam depends on the diameter <strong>of</strong> the beam and<br />
varies from 400 meters to 850 meters. The wrapper is replaced after finishing certain length <strong>of</strong> fabric;<br />
the replacement depends on severity <strong>of</strong> treatment. Replacement frequency <strong>of</strong> decatising wrapper for<br />
different fabric varieties being decatised is given below:<br />
29 Employment has been estimated based on the analysis <strong>of</strong> primary and secondary data available for the<br />
<strong>technical</strong> textile manufacturers. IMaCS has made appropriate adjustments because <strong>of</strong> insufficient data.<br />
30 Technical includes managerial staff and skilled labour whereas non-<strong>technical</strong> includes unskilled labour.
Replacement frequency <strong>of</strong> decatising wrapper<br />
Fabric variety Average length after which the<br />
wrapper is replaced<br />
Worsted suiting Every 9 lakh meters<br />
Synthetic suiting Every 18 lakh meters<br />
Shirting Every 25 lakh meters<br />
Sarees Every 0.95 lakh meters<br />
Dress materials Every 30 lakh meters<br />
Source: <strong>Industry</strong> survey<br />
All suiting fabric manufactured in India is decatised whereas only a certain percentage <strong>of</strong> other fabrics<br />
are decatised. As per industry sources the share <strong>of</strong> each variety <strong>of</strong> fabric that is decatised is given<br />
below:<br />
Fabric variety Share <strong>of</strong> the total<br />
production that is<br />
decatised<br />
Suiting 100%<br />
Shirting 50%<br />
Sarees 15%<br />
Dress materials 15%<br />
Source: <strong>Industry</strong> survey<br />
The market for decatising wrapper is estimated at 1.2 million meters valued at Rs. 30 crore. Based on<br />
the industry trends the demand for decatising wrapper is estimated to grow at a CAGR <strong>of</strong> 3% over the<br />
next five years. Thus, the market size <strong>of</strong> wrapper is expected to increase to 1.4 million meters by<br />
2012-13. The market potential in 2012-13 is estimated to be Rs. 35 crore. No inflationary increase has<br />
been assumed for the price <strong>of</strong> the product.<br />
The current and future forecast <strong>of</strong> the <strong>consumption</strong> <strong>of</strong> decatising wrapper is given below:<br />
Market size <strong>of</strong> decatising<br />
wrapper<br />
2007-08 2012-13<br />
Quantity 1.2 million meters 1.4 million meters<br />
Value Rs 30 crore Rs 35 crore<br />
Key manufacturers <strong>of</strong> decatising wrapper<br />
Source: <strong>Industry</strong> survey, IMaCS analysis
Bombay Dyeing is the largest manufacturer <strong>of</strong> decatising wrapper with a market share <strong>of</strong> around 50%.<br />
The company manufactures polyester/cotton (70/30) blended decatising wrapper in several varieties<br />
with an average gsm <strong>of</strong> 400. Other manufacturers are:<br />
• JKT Fabrics, Mumbai<br />
• Noor Textiles, Panipat<br />
In addition, a few players in Tarapur and Surat also manufacture this fabric.<br />
Manufacturer Year Production Installed<br />
quantity capacity<br />
Bombay Dyeing 2007–08<br />
0.66 million<br />
meters<br />
0.78 million<br />
meters<br />
Source: <strong>Industry</strong> survey<br />
Imports and Exports <strong>of</strong> decatising wrapper<br />
The estimated import figures for decatising wrapper are given below:-<br />
HS Code Description<br />
59113290, 59119090<br />
Imports<br />
Quantity<br />
Imports<br />
Value<br />
2007-08(E) 2007-08(E)<br />
Spare parts for Kier decatising<br />
(Blowing wrapper)<br />
Around 0.5 lakh<br />
meters<br />
~ Rs. 4 crore<br />
Source: IBIS, IMaCS Analysis<br />
Manufacturers <strong>of</strong> premium suiting fabrics like Raymonds are the importers <strong>of</strong> decatising wrapper. The<br />
imports are primarily from Italy.<br />
The exports <strong>of</strong> decatising wrapper from India are negligible.<br />
Raw materials<br />
Polyester/cotton decatising wrapper is woven from polyester cotton blended yarn. Warp yarn <strong>of</strong> 3/48 s<br />
and weft yarn <strong>of</strong> 34 s is used for the same. The fabric is woven on Sulzer looms.<br />
Quality control and standards<br />
The parameters tested for decatising wrapper along with the test method are mentioned in the table<br />
below:<br />
Parameter Test Method<br />
Air Permeability IS 11056:1984<br />
Strength IS 1969-1985, ASTM D 5035-95<br />
GSM IS 1964-2001, ASTM D 3776-96
EPI/PPI IS 1963-1981, ASTM D 3775-03
Bolting Cloth<br />
Bolting cloth is a mesh fabric used primarily for screen printing in Textile industry. The fabric also<br />
has applications in filtration.<br />
Product characteristics<br />
Bolting cloth is a woven fabric manufactured from polyester and nylon yarns and is available in a<br />
variety <strong>of</strong> mesh sizes.<br />
Market dynamics and key growth drivers<br />
Bolting cloth is majorly used for screen printing in textile processing industry. The advent <strong>of</strong> new<br />
printing technology in India has reduced the use <strong>of</strong> screen printing, thus, impacting the demand for<br />
this fabric negatively.<br />
Market size <strong>of</strong> Bolting cloth and future forecast<br />
Based on discussions with the industry experts, the market size for bolting cloth is estimated at around<br />
6 lakh square meters valued at Rs. 25 crore. According to industry trends, the demand for bolting<br />
cloth is estimated to grow at 3% year on year. Thus, the market size <strong>of</strong> bolting cloth is expected to<br />
increase to 7 lakh square meters by 2012-13. The market potential in 2012-13 is estimated to be Rs 30<br />
crore.<br />
The current and future forecast <strong>of</strong> bolting cloth <strong>consumption</strong> is given below:<br />
Market size for Bolting Cloth 2007-08 2012-13<br />
Quantity<br />
6 lakh square<br />
meters<br />
7 lakh square<br />
meters<br />
Value Rs 25 crore Rs 30 crore<br />
Key manufacturers <strong>of</strong> Bolting Cloth<br />
The manufacturers <strong>of</strong> bolting Cloth are:<br />
• Bombay Bolting Centre, Mumbai<br />
• Surat Bolting, Surat<br />
• Khanna Bolting, Surat<br />
• Mithil Corporation, Mumbai<br />
• Biyani Industrial Textile (P) Limited, Indore<br />
• Deekay Nylobolt Industries Pvt. Ltd., Pune<br />
• Tejas Fabrics, Surat<br />
Source: <strong>Industry</strong> survey, IMaCS analysis
• Sur Syntex Pvt. Ltd., Surat<br />
In addition, many filter manufacturing units in Surat also manufacture bolting cloth.<br />
Imports & Exports <strong>of</strong> bolting cloth<br />
The estimated import figures for bolting cloth are given below:-<br />
HS Code Description<br />
59112000<br />
59119090<br />
Bolting Cloth, Screen mesh<br />
Imports<br />
Quantity<br />
Imports<br />
Value<br />
2007-08(E) 2007-08(E)<br />
Around 4 lakh<br />
square meters<br />
Rs 15 crore<br />
Source: DGCIS, IMaCS Analysis<br />
Majority <strong>of</strong> Bolting Cloth is imported from China and Germany. Bolting cloth is also imported from<br />
Switzerland in small quantities. Screen mesh is majorly imported from Italy.<br />
The exports <strong>of</strong> bolting cloth from India are negligible.<br />
Raw materials used<br />
Polyester and nylon mono-filament yarn is used as the raw material.
Absorbent Glass mat Battery separators<br />
Battery separator is a porous sheet placed between the positive and negative electrodes in a liquid<br />
electrolyte, a gel electrolyte or a molten salt battery. Its function is to prevent physical contact <strong>of</strong> the<br />
positive and negative electrodes while serving as an electrolyte reservoir to enable free ionic transport.<br />
According to the structure, the separator can be divided as micro porous and non-woven.<br />
An ideal battery separator should have the properties <strong>of</strong> high porosity, small mean pore diameter,<br />
oxidation resistance, puncture resistance, thermal dimensional stability and freedom from harmful<br />
chemical contaminants, favourable voltage characteristics, retardation <strong>of</strong> antimony transfer,<br />
electrochemical compatibility and prevention <strong>of</strong> dendrite growth.<br />
The battery separators are made <strong>of</strong> PVC, PE and non-woven glass mats (Absorbent glass mats or<br />
AGM). The glass mats are known as AGM (Absorbable Glass Mat). The battery separator market is<br />
dominated by PVC although there is a gradual migration to PE separators. In India, the storage<br />
battery industry is slowly shifting from PVC separators to Polyethylene separators. Glass mat with<br />
PVC or polythylene is mostly used in all industrial batteries and in a few cases in automobile batteries<br />
depending on the function, customer requirement and price.<br />
Market dynamics and key growth drivers <strong>of</strong> batteries market in India<br />
The storage batteries industry can be classified as Industrial batteries and automotive batteries.<br />
Industrial batteries<br />
Industrial batteries with a market size <strong>of</strong> Rs 4,000 crore include Lead-acid batteries (including VRLA<br />
or valve-regulated lead acid batteries), Lithium and nickel-cadmium batteries. Of this market, 40% is<br />
unorganised. The Industrial Batteries <strong>Segment</strong> can be broken up into the Infrastructure market<br />
(Railways, Telecom and Power), Submarine batteries and fast-moving industrial batteries (UPS and<br />
Inverters). VRLA batteries are the most important kind <strong>of</strong> batteries used in the Industrial <strong>Segment</strong>.<br />
The growth in this sector has been driven by surge in demand from the telecom and UPS segment,<br />
which is likely to continue in the coming years.<br />
The Industrial batteries i.e., VRLA type <strong>of</strong> batteries are the prominent users <strong>of</strong> non-woven Glass mat<br />
battery separators, since such batteries are used for heavy-duty works.<br />
Automotive batteries
Automotive batteries with a market size <strong>of</strong> Rs 2,700 crore include lead-acid batteries and VRLA<br />
batteries and are required in almost all automobiles for applications like horn, light, self-start, etc. The<br />
automotive batteries market can be further divided into OEM and aftermarket, <strong>of</strong> which the former<br />
constitutes about 40%.<br />
The market for 2 wheeler OEM batteries is around 6.7 million in 2007-08 while 2 wheeler<br />
replacement batteries market is estimated to be around 7.5 million in 2007-08. This is expected to<br />
more than double to around 12 million OEM batteries and 17 million replacement batteries in next 5<br />
years.<br />
The market for passenger cars/MUVs/MPVs OEM batteries is around 1.76 million in 2007-08 while<br />
the replacement batteries market is estimated to be around 3.5 million in 2007-08. This is expected to<br />
almost double to 3.5 million OEM batteries and 6.5 million replacement batteries in next 5 years.<br />
The market for CVs (passenger and goods carriers) OEM batteries is around 0.55 million in 2007-08<br />
while the replacement batteries market is estimated to be around 1.05 million in 2007-08. This is<br />
expected to increase to 0.75 million OEM batteries and 1.45 million replacement batteries in next 5<br />
years.<br />
The market for three-wheeler OEM batteries is around 0.5 million in 2007-08 while the replacement<br />
batteries market is estimated to be around 1 million in 2007-08. This is expected to increase to 0.75<br />
million OEM batteries and 1.5 million replacement batteries in next 5 years.<br />
In Automotive batteries, PVC or Polyethylene type separators are used. VRLA batteries are also used<br />
in some <strong>of</strong> the four-wheelers. Amara Raja and few other players have introduced VRLA batteries for<br />
two-wheelers as well. But, the penetration <strong>of</strong> VRLA batteries in two-wheeler segment is very low.<br />
Non - woven micro porous absorbent glass mat with PVC or Polyethylene separators are used mainly<br />
in high priced customer specified auto batteries.<br />
Key battery manufacturers<br />
The major manufacturers <strong>of</strong> batteries in organised sector are Exide Industries (and group companies),<br />
Amara Raja Batteries, AMCO batteries (and group companies), Tudor India, HBL Power Systems,<br />
etc. Exide is the market leader in the automotive batteries segment with 75% market share in the<br />
branded batteries market. Exide is the market leader in the branded industrial batteries segment with<br />
around 45% market share. HBL and Amara Raja are the market leaders in the industrial VRLA<br />
batteries segment. The usage <strong>of</strong> battery separators for some <strong>of</strong> the key battery manufacturers is given<br />
below:-
End-user Year Quantity Value (Rs Unit Price Battery Battery sales<br />
crore)<br />
production (Rs crore)<br />
Amara Raja<br />
2007-08<br />
2007-08<br />
636 MT<br />
5.28 mn. sq. m.<br />
9.77<br />
15.94<br />
Rs 154/kg<br />
Rs 30.2/sqm<br />
4.195 million 1350<br />
AMCO batteries 2006-07 26.27 mn. Nos. 1.57 Rs 0.6/unit 2.7 million 113.86<br />
Tudor India 2007-08 34.56 mn. Nos. 3.73 Rs 1.08/unit 0.384 million 143<br />
HBL Power 2007-08 1260 MT 17.78 Rs 141/kg 838 million Around Rs<br />
Systems<br />
AH 1000 crore<br />
Total* Rs 48.79<br />
Around Rs<br />
crore**<br />
2700 crore<br />
Source: Capitaline<br />
* Data on Battery separators for Exide, the largest manufacturer <strong>of</strong> batteries in India and other battery<br />
manufacturers is not available<br />
** The value <strong>of</strong> battery separators includes Absorbent glass mat (AGM) based separators as well as other<br />
battery separators<br />
Key players - Battery separators<br />
Daramic products dominate the PE segment and the company has started operations in India. Daramic<br />
is the world's leading manufacturer and supplier <strong>of</strong> battery separators for automotive, industrial, and<br />
specialty applications. Daramic operates six manufacturing facilities with a combined annual capacity<br />
<strong>of</strong> over 350 million square meters <strong>of</strong> battery separator products. The company is importing AGM<br />
separators as <strong>of</strong> now and plans to setup a factory in India for the manufacture <strong>of</strong> these separators by<br />
next year.<br />
In addition, there are numerous convertors in the battery separator market concentrated in Bangalore,<br />
Bombay, Delhi and Kolkata. These players import the AGM separators sheets/rolls and supply<br />
separators to battery manufacturers after cutting/processing.<br />
Market size <strong>of</strong> AGM Battery separators<br />
Automotive batteries<br />
The AGM glass separators are typically used in high-end passenger cars – <strong>Segment</strong>s A3 (Executive),<br />
A4 (Premium) & A5 (Luxury) and MUVs/MPVs as per SIAM classification. These vehicles account<br />
for around 45% <strong>of</strong> all passenger cars sales. In addition, 5-6% two-wheelers also use VRLA batteries<br />
with AGM separators. Hence, total number <strong>of</strong> VRLA automotive battery sales (OEM + replacement)<br />
using AGM separators is around 2.9 million.<br />
Around 0.75 sq. m. <strong>of</strong> AGM battery separator is used in an automotive battery on an average. Also,<br />
usage <strong>of</strong> AGM separator in a two-wheeler battery is around 70-80% <strong>of</strong> the usage in car batteries (as<br />
two-wheeler batteries are 6-9V batteries while car batteries are typically 12V batteries). Hence, total<br />
estimated size <strong>of</strong> AGM battery separators usage in automotive segment is around 2.1 million sq. m. in<br />
2007-08.
In the next 5 years, the percentage <strong>of</strong> passenger cars/MUVS/MPVs using AGM separators is expected<br />
to increase by 15-20%. In addition, marginal shift <strong>of</strong> two-wheeler batteries towards VRLA batteries is<br />
expected. Hence, the usage <strong>of</strong> AGM battery separators is expected to increase to around 8 million<br />
batteries per annum i.e. around 5.6 million sq. m. <strong>of</strong> AGM separators.<br />
Industrial batteries<br />
Industrial batteries with a market size <strong>of</strong> Rs 4,000 crore include Lead-acid batteries, VRLA batteries<br />
and nickel-cadmium batteries. 40% <strong>of</strong> the market is unorganized. VRLA batteries account for 70-75%<br />
<strong>of</strong> this market. Around 6,000 square meter <strong>of</strong> AGM glass separators are consumed per crore sales <strong>of</strong><br />
industrial batteries. Hence, the estimated size <strong>of</strong> AGM battery separators usage in industrial segment<br />
is around 18 million sq. m. in 2007-08.<br />
The industrial batteries market has witnessed rapid growth over the past few years. The industry is<br />
likely to grow at the rate <strong>of</strong> 20-25 % over the next five years. In the next 5 years, the usage <strong>of</strong> AGM<br />
battery separators in industrial segment is expected to increase to around 45 million sq. m. per annum.<br />
Hence, the current and future forecast <strong>of</strong> AGM separators usage in India is given below:-<br />
Contact lens usage in<br />
India<br />
AGM battery<br />
separators<br />
(million sq m)<br />
AGM battery<br />
separators value<br />
(Rs crore)*<br />
2007-08 2012-13<br />
Automotive Industrial Total Automotive Industrial Total<br />
2.1 18 20.1 5.6 45 51.6<br />
6.3 54 60.3 16.8 134 150.8<br />
Source: <strong>Industry</strong> survey, IMaCS Analysis<br />
The potential market for AGM separators in 2012-13 is estimated at Rs. 150.8 crore up from Rs 60.3<br />
crore in 2007-08 (E). No inflationary increase has been assumed for the price <strong>of</strong> AGM separators.<br />
Imports & Exports <strong>of</strong> AGM separators<br />
The estimated import figures for glass-fibre based battery separators are as given below:-<br />
HS Code Description<br />
Imports<br />
(in Rs crore)<br />
2007-08(E)
70193900, 70199010, GLASS FIBRE SHEETS FOR<br />
~ 3 - 4<br />
70193100, 70191900 BATTERY SEPARATORS*<br />
AGM (ABSORBENT GLASS<br />
85079010, 85079090 MAT) BATTERY<br />
~ 55 - 60<br />
SEPARATORS**<br />
Source: IBIS, IMaCS Analysis<br />
* Apart from these HS codes, Battery separators <strong>of</strong> fibre glass are also<br />
imported in nominal amounts under the HS codes - 70109000, 70199090<br />
(included in Imports value above)<br />
** Under these HS codes as well as under 39201019 & 39042110,<br />
Battery separators made <strong>of</strong> PVC/PE without glass-fibre mats valuing<br />
over Rs 100 crore are also imported<br />
China accounts for over 70-80% <strong>of</strong> imports <strong>of</strong> fibre-glass battery separators <strong>of</strong> India with HS code<br />
70X followed by Thailand with 20-25% share. Singapore, Germany & Japan account for less than 5%<br />
<strong>of</strong> fibre-glass battery separators imports <strong>of</strong> India.<br />
Under the HS code 85X, China accounts for 40-50% <strong>of</strong> imports <strong>of</strong> battery separators <strong>of</strong> India<br />
followed by Thailand, Hong Kong, Taiwan, Indonesia & France accounting for around 40-50%<br />
imports. The remaining imports <strong>of</strong> glass-fibre based battery separators are from UK, Germany, US,<br />
Japan and Philippines.<br />
The glass-fibre based battery separators are not exported from India.<br />
Raw materials<br />
The absorbent glass mats (AGM) are manufactured by dry-laid process, wet-laid process, spun-bond<br />
process or melt-blown process using glass fibre / glass wool.<br />
All these processes consist <strong>of</strong> three steps:<br />
a. making fabric webs,<br />
b. bonding webs and<br />
c. post-treatment<br />
and in most cases the web making and bonding are done in one step.<br />
Quality Control and standards<br />
There are no standards pertaining to battery separators. The manufacturers have their own set <strong>of</strong><br />
specifications based on the battery performance requirements.<br />
Cigarette Filter<br />
Cigarette filter reduces harshness <strong>of</strong> tobacco smoke by reducing the amount tar, smoke and other fine<br />
particles during combustion <strong>of</strong> the tobacco portion. The filter is primarily made-up <strong>of</strong> cellulose acetate<br />
fibres known as tow. The fibres are bonded together with a hardening agent, tri-acetin plasticizer,<br />
which helps the filter to keep its shape. The filter is wrapped in paper and sealed with a line <strong>of</strong><br />
adhesive.
Cigarette and Cigarette filter market in India<br />
The total size <strong>of</strong> the filter cigarette industry in India is around 120 billion cigarettes. ITC Limited has<br />
a near monopoly with around 73% volume market share followed by Godfrey Philips and Vazir<br />
Sultan Tobacco (VST).<br />
The Union budget 2008-09 has increased the excise duty for cigarettes below length <strong>of</strong> 60 mm by<br />
500% and non-filter cigarettes in the 60-70 mm length by 250%. In addition to excise hike a 12.5%<br />
VAT on these products has rendered the non-filter cigarette industry unviable. Hence, over the next<br />
few years the capacities <strong>of</strong> these non-filter cigarette capacities would gradually convert to filter<br />
cigarette capacities which would further boost the demand for cigarette filters. The number cigarettes<br />
manufactured per filter rod is typically 5.5 based on ITC data and this is metric is used to arrive at the<br />
number <strong>of</strong> cigarette filters market in the next five years.<br />
Consumption norms and the market size<br />
The cigarette filter is typically 20 mm long in each cigarette and is a 100% <strong>technical</strong> textile. Typically<br />
six cigarettes are made from one cigarette rod. The length <strong>of</strong> the cigarette rod is made to the<br />
specification <strong>of</strong> the cigarette manufacturer.<br />
The current and future forecast <strong>of</strong> cigarette filters industry is given below:-<br />
Market size <strong>of</strong> cigarette filter 2007-08 2012-13<br />
Quantity<br />
Around 14,000<br />
million filter rods<br />
Around 17,000<br />
million filter rods<br />
Value Rs 152 crore Rs 182 crore<br />
Source: <strong>Industry</strong> Survey, IMaCS Analysis<br />
The potential market for cigarette filter industry in 2012-13 is estimated at Rs. 182 crore up from Rs.<br />
152 crore in 2007-08 (E). No inflationary increase has been assumed for the price <strong>of</strong> the material. In<br />
volume terms, the usage <strong>of</strong> cigarette filter is expected to grow from around 14,000 million filter rods<br />
in 2007-08 to around 17,000 million filter rods in 2012-13. The cigarette industry is expected to<br />
undergo de-growth at around 3% y-o-y over the next 5 years. But, the conversion from cigarettes<br />
without filter to filter cigarettes is expected to lead to the growth <strong>of</strong> cigarette filers.<br />
The production and sales data <strong>of</strong> major cigarette manufacturers is as given below:-<br />
Manufacturer Year Production<br />
Quantity<br />
Sales Quantity<br />
(Million)<br />
Quantity<br />
(million filter<br />
Value <strong>of</strong> Filter<br />
rods
(Million) rods) (Crore)<br />
ITC 2007-08 65770* 80723 11475 123<br />
Godfrey Philips 2007-08 5364* 14376 1806 19.8<br />
VST 2007-08 8799* 8844 644 5.6<br />
Source: Capitaline, <strong>Industry</strong> Survey, IMaCS Analysis<br />
* Sale is higher than production as remade cigarettes as marketed as well<br />
The major manufacturers <strong>of</strong> cigarette filters in India are Hind Filters and Hitkari Multifibers apart<br />
from smaller manufacturers like Nirmesh Enterprises. The production figure <strong>of</strong> key cigarette filter-<br />
manufacturers in India is given below:-<br />
Manufacturer Year Quantity<br />
(Million<br />
filters)<br />
Value Unit Price Installed<br />
capacity<br />
Hind Filters 2003-04 2141* Rs 23.9 crore Rs 0.112/filter 4850 million<br />
rod<br />
filters<br />
Hitkari<br />
2004-05 2527* Rs 22 Rs 0.087 /filter 5300 million<br />
Multifibers<br />
rod<br />
filters<br />
Source: Capitaline, <strong>Industry</strong> Survey, IMaCS Analysis<br />
* One filter rod is generally 0.12 metre long<br />
Imports <strong>of</strong> cigarette filter<br />
The estimated import figures for cigarette filter are as given below:-<br />
HS Code Description<br />
56012190,<br />
56012900<br />
CIGARETTE<br />
FILTER<br />
Imports Imports<br />
Quantity (in Rs crore)<br />
2007-08(E) 2007-08(E)<br />
Approx. 10 Rs 2 crore<br />
million metres approx.<br />
Source: IBIS, IMaCS Analysis<br />
The cigarette filters are imported in India from Korea, Pakistan and Indonesia.<br />
Exports <strong>of</strong> cigarette filter<br />
The estimated import figures for cigarette filter are as given below:-<br />
HS Code Description<br />
56012190,<br />
56012900,<br />
56012110<br />
CIGARETTE<br />
FILTER<br />
Exports Exports<br />
Quantity (in Rs crore)<br />
2007-08(E) 2007-08(E)<br />
Approx. 45<br />
million metres<br />
Rs 6.5 – 7 crore<br />
approx.<br />
Source: IBIS, IMaCS Analysis
Cambodia and Iran account for two-third <strong>of</strong> exports <strong>of</strong> cigarette filters from India followed by UAE<br />
and Taiwan, which account for the remaining share. These exports for the year 2012-13 are estimated<br />
to be Rs 7.7 crore.<br />
Quality Control and Standards – There are no Indian standards.
Coated abrasives<br />
An abrasive material is used to finish a work piece through rubbing the surface <strong>of</strong> the work piece.<br />
Abrasives are primarily used in industrial applications like grinding, polishing, buffing, honing,<br />
cutting, smoothening etc. The coated abrasives are classified into two broad categories: Woven coated<br />
abrasives and Non-woven coated abrasives.<br />
Product characteristics<br />
The cloths used are cotton, polyester and polyester blends, processed to obtain a suitable coated<br />
abrasives backing. These backings have special characteristics as weight, tensile strength and<br />
flexibility. The type <strong>of</strong> backing cloth used is Jeans cloth called “J” weight cloth, Drills cloth called<br />
“X” weight cloth and Sateen called “S” weight cloth. Jeans cloth is lighter and more flexible, while<br />
Drills cloth is stronger and used in the manufacturing <strong>of</strong> coated abrasives to work under medium and<br />
heavy duty pressures.<br />
There are two sides <strong>of</strong> the drill cloth which are different from each other. One side bears a net <strong>of</strong> fine<br />
lining if seen carefully and this side is called drilled side <strong>of</strong> the cloth. Drill side is filled with fillers.<br />
The other side <strong>of</strong> the cloth is called the coating side.<br />
"J" weight cloth typically has a weight <strong>of</strong> about 130-195 GSM."X" weight cloth typically has a weight<br />
<strong>of</strong> about 200-245 GSM and "Y" weight cloth typically has a weight <strong>of</strong> about 270-330 GSM.<br />
The non-woven coated abrasives are made from abrasive grade fibres and made available for usage in<br />
various sizes and forms.<br />
Market dynamics and growth drivers<br />
The market <strong>of</strong> coated abrasives is primarily driven by growth in automobiles, auto-ancillaries, auto-<br />
after markets, castings and forging, consumer goods, tanneries, hand tool, power tools, furniture,<br />
sanitary-ware and construction.<br />
The demand for coated abrasives from various industries as given below:<br />
Customer segment <strong>of</strong> Percentage share <strong>of</strong><br />
Coated Abrasive coated abrasive sales<br />
Auto 40%
Customer segment <strong>of</strong> Percentage share <strong>of</strong><br />
Coated Abrasive coated abrasive sales<br />
After market,<br />
maintenance, repair<br />
and over haul<br />
35%<br />
Tanneries 12%<br />
White Goods 10%<br />
Key manufacturers <strong>of</strong> coated abrasives in India<br />
Source: SSKI, CUMI<br />
The two biggest manufacturers <strong>of</strong> coated abrasive in India are Carborundum Universal and Grindwell<br />
Norton. These two producers cover close to 80% <strong>of</strong> the coated abrasives market in India.<br />
Manufacturer Year Quantity Value (Rs Unit Price Installed<br />
( Sqm) crore) (Rs)<br />
capacity<br />
CUMI 2007-08 10320000 146.9 145 18830000<br />
Grindwell Norton 2007-08 3250000 146 456 5200000<br />
Total 2007-08 13570000 292.9 - 24030000<br />
Source: Capitaline<br />
Both CUMI and Grindwell Norton have woven and non-woven coated abrasives in their product mix.<br />
However, Grindwell Norton is the only manufacturer non-woven coated abrasives in India with<br />
production <strong>of</strong> one million square meters annually. CUMI on the other hand does not have a non-<br />
woven manufacturing unit and trades in the non-woven category. However CUMI does manufacture<br />
the industrial cloth in house. The product mix <strong>of</strong> woven and non-woven is distributed as follows:<br />
Woven is approximately 65% and non-woven is approximately 35%.<br />
Key manufacturer <strong>of</strong> backing cloth or gray cloth is as give below:<br />
1. Madura Textiles<br />
2. Keetex Textile, Kolhapur<br />
Market size <strong>of</strong> coated abrasives in India<br />
The coated abrasive market is approximately Rs.366 crore in India. The leading producers are<br />
Carborundum Universal (CUMI) and Grindwell Norton. CUMI has nearly 40% market share in the<br />
coated abrasive segment. Both CUMI and Grindwell Norton put together account for 80% <strong>of</strong> the<br />
coated abrasive market. The coated abrasive has a diverse user base and overall market is expected to<br />
grow at 10% per annum.<br />
The cloth backing in a coated abrasive is equal to the area <strong>of</strong> the abrasive. The market size <strong>of</strong> coated<br />
abrasives and the cloth are as given below:-
Cloth backing <strong>consumption</strong> norms (coated abrasive industry)<br />
Coated abrasive – approx. (million<br />
square meters)<br />
16.7<br />
Total fabric used (million square meter) 16.7<br />
Woven fabric (million square meter)<br />
approximately<br />
10.9<br />
Non woven (million square meters) 5.8<br />
Total fabric used (M Sq. meters) 16.7<br />
The current and future forecast <strong>of</strong> coated abrasive industry is given below:-<br />
Source:Capitaline, <strong>Industry</strong> survey, IMaCS Analysis<br />
Market size <strong>of</strong> coated abrasives 2007-08 2012-13<br />
Coated abrasive<br />
(in million square meters)<br />
Woven abrasive<br />
(in million square meters)<br />
Non-woven abrasive<br />
(in million meters)<br />
Coated abrasive value<br />
(in Rs. crore)<br />
16.7 26.9<br />
10.9 17.5<br />
5.8 9.4<br />
Rs 366 crore Rs 590 crore<br />
Backing Cloth (in Crore) Rs 89 crore Rs 143 crore<br />
Source: <strong>Industry</strong> survey, IMaCS Analysis<br />
The potential market for coated abrasive industry in 2012-13 is estimated at Rs. 590 crore up from<br />
Rs.366 crore in 2007-08 (E). No inflationary increase has been assumed for the price <strong>of</strong> the material.<br />
In volume terms, the usage <strong>of</strong> backing cloth is expected to grow from 16.7 million square meters in<br />
2007-08 to 26.9 million square meters in 2012-13.<br />
Export and Import <strong>of</strong> abrasive backing cloth<br />
The abrasive backing cloth is traded under the HS code: 55121900. There have been no imports and<br />
exports under this category code.<br />
Raw materials and machinery<br />
The backing cloth is made from polyester, rayon and cotton fibres. The fabrics are generally woven at<br />
90 degrees to each other; another method <strong>of</strong> manufacturing backing cloth is stitching together an
overlay <strong>of</strong> fibre placed 90 degrees to each other. The key machinery used for manufacture <strong>of</strong> backing<br />
cloth is rapier looms.<br />
The non-woven abrasives are manufactured using the needle punching process on needle looms.<br />
Quality Control and Standards – There are no Indian standards. The products manufactured in India<br />
are along the European lines.
Conveyor Belts<br />
Belt Conveyor system is a fastest, environment friendly & economical mode <strong>of</strong> bulk transportation.<br />
The conveyor belt is used to move unit loads individually and bulk loads continuously.<br />
Product description<br />
A Conveyor belt consists <strong>of</strong> three components: Cover, Carcass and Insulation – the bonding medium<br />
for the carcass. Belting fabrics are used for reinforcing these conveyor belts.<br />
The carcass is sandwiched between two covers, the face cover for the carrying side and the back cover<br />
for the pulley side with the face cover being thicker as it is subject to more wear and tear. The quality<br />
<strong>of</strong> cover will depend on the material to be handled, its abrasive quality and lump size and the service<br />
conditions. The carcass provides the strength for transmitting the power to drive the conveyor and to<br />
support the load carried on the belt. The belt strength is determined by the combined strength <strong>of</strong> the<br />
plies (Generally two- or three- ply belting). The insulation medium within the carcass <strong>of</strong> any belt<br />
separates the plies to prevent chafing; permits the belt to flex, imparts good adhesion to bind the<br />
carcass, supports the load; absorbs energy on impact at the loading point and properties for the<br />
application – resistance to heat, oil or fire.<br />
Conveyor belts can be classified as rubber conveyor belts and PVC conveyor belts. Rubber based<br />
belting can be textile reinforced or steel reinforced. Textile reinforced belts are primarily <strong>of</strong> Nylon,<br />
polyester. Most <strong>of</strong> the steel cord belts are used in the mining sector<br />
The belts can be classified based on their application as General Purpose, Heat-resistant, Fire-<br />
resistant, Oil-resistance, Food grade etc.<br />
Market dynamics<br />
Conveyor belts find major application in cement, mining, thermal power plants, paper, glass, fertilizer<br />
and other process industries where there is a requirement for continuous transfer <strong>of</strong> load. The industry<br />
growth is contingent on the new projects or expansion <strong>of</strong> the existing projects in mines, minerals &<br />
metals, cement, paper, glass, fertilizer industries as well as thermal plants, OEM system<br />
manufacturers etc.<br />
Steel reinforced belts have shown a higher growth than Textile reinforced belts due to greater lifespan<br />
<strong>of</strong> the product. The conveyer belts have a lifetime <strong>of</strong> 6 to 12 months based on the nature <strong>of</strong> material<br />
handled and thus have a huge replacement market.<br />
Key manufacturers
Phoenix Yule, MRF, Sempertrans Nirlon are the major manufacturers <strong>of</strong> conveyor belts in India.<br />
Phoenix Yule Ltd is the leader in steel reinforced belts. Key manufacturers <strong>of</strong> belting fabrics are SRF<br />
and Nirlon Limited. Nirlon Limited supplies most <strong>of</strong> its belting fabric to Sempertrans Nirlon ltd,<br />
which is its joint venture with Serriperit A.G., an Austrian industrial rubber product multinational.<br />
(SNL) which was formed in January 2000 is planning to double its capacity.<br />
SRF is the market leader in India with a domestic market share <strong>of</strong> over 50 per cent, and is the third<br />
largest producer <strong>of</strong> belting fabrics in the world. SRF is planning to set up a plant to manufacture<br />
Polyester industrial yarn at Gummidipoondi near Chennai. This plant, in addition to manufacturing<br />
High Modulus Low Shrinkage (HMLS) Polyester yarn, will have the capability to manufacture an<br />
assortment <strong>of</strong> high tenacity and low shrinkage yarns for various end-use applications such as belting,<br />
coated, single cord, etc. The company has a current capacity <strong>of</strong> 7500 tonnes <strong>of</strong> belting fabric per<br />
annum.<br />
Market size<br />
The production numbers <strong>of</strong> rubber conveyor belting in India are given in the following table<br />
Production <strong>of</strong> Conveyor Belting in India(Tonne)<br />
Year 2000-01 2001-02 2002-03 2003-04 2004-05 2005-06 2006-07 2007-08<br />
Apr 1276 1381 1168 1239 1777 2162 2290 1905<br />
May 1273 1384 942 1359 1886 2065 1934 2030<br />
Jun 1198 1402 900 1515 1867 2236 2208 1987<br />
Jul 1206 1287 1049 1651 1980 2179 2130 2040<br />
Aug 1259 1178 1097 1866 2012 2121 2006 2084<br />
Sep 958 1683 1328 1679 1914 1927 1951 1829<br />
Oct 1288 1491 1277 1504 1914 1756 1686 1763<br />
Nov 1105 1617 1197 1638 1969 2035 1982 1684<br />
Dec 1074 1222 1428 1780 1989 2651 1836 1821<br />
Jan 1098 1635 1428 1705 1796 2407 1920 1896<br />
Feb 993 1410 1338 1573 2207 1846 1881 1943<br />
Mar 1063 1308 1351 1916 2236 2455 1903 2196<br />
Annual<br />
Production 13791 16998 14503 19425 23547 25840 23727 23178<br />
The market for reinforcement material is estimated to be 3940 tonnes which amounts to Rs 105 Crore.<br />
The production <strong>of</strong> conveyor belts in the last five years has grown at around 9% annually. The industry<br />
is expected to maintain the same growth rate over the next five years. The market for reinforcement<br />
material is estimated to be 6062 tonnes and worth Rs 162 Crore.<br />
The current and future market size is given below.
Market size<br />
2007-2008 2012-2013<br />
Unit Quantity<br />
Value (Rs<br />
Crore) Quantity<br />
Value (Rs<br />
Crore)<br />
Conveyor belts<br />
production MT 23178 284 35662 557<br />
Reinforcement material<br />
requirement MT 3940 105 6062 162<br />
Source: <strong>Industry</strong> Survey, IMaCS Analysis<br />
Imports and Exports<br />
The import details <strong>of</strong> conveyor belts are given in the following table.<br />
HS Code Description<br />
40101210<br />
40101290<br />
(CNVYR BLT/BLTNG)RENFRCD<br />
WTH TXTL MTRLS WHERE<br />
RUBR COMPD CONTENT LESS<br />
THAN 25% BY WEIGHT<br />
(CNVYR BLT/BLTNG)RENFRCD<br />
WTH TXTL MTRLS WHERE<br />
RUBR COMPD CONTENT MORE<br />
THAN 25% BY WEIGHT<br />
Imports (in Rs<br />
Crore)<br />
2007-<br />
2006-07<br />
08(E)<br />
Imports (Quantity)<br />
Unit 2006-07<br />
2007-<br />
08(E)<br />
1.2 1.8 MT 19.1 46.7<br />
2.8 6.5 MT 150.8 164.4<br />
39269010 PVC BELT CONVEYOR 70.9 92.8 MT 2411.3 1949.3<br />
59100010<br />
COTTON CANVAS PLY<br />
BELTING<br />
0.8 1.2 MT 19.1 23.8<br />
59100020<br />
RUBBERISED COTTON<br />
BELTING<br />
0.0 0.0 MT 3.4 1.0<br />
Total<br />
Imports<br />
76 102 MT 2604 2185<br />
Source: DGCIS, IMaCS Analysis<br />
The imports are mainly from China, Taiwan and Germany. The Export details <strong>of</strong> conveyor belts are<br />
given in the following table.<br />
HS Code Description<br />
40101210<br />
(CNVYR<br />
BLT/BLTNG)RENFRCD WTH<br />
TXTL MTRLS WHERE RUBR<br />
COMPD CONTENT LESS<br />
THAN 25% BY WEIGHT<br />
Exports (in Rs<br />
Crore)<br />
2007-<br />
2006-07<br />
08(E)<br />
Exports (Quantity)<br />
Unit 2006-07<br />
2007-<br />
08(E)<br />
1.1 1.0 MT 101.6 50.6
40101290<br />
(CNVYR<br />
BLT/BLTNG)RENFRCD WTH<br />
TXTL MTRLS WHERE RUBR<br />
COMPD CONTENT MORE<br />
THAN 25% BY WEIGHT<br />
141.9 132.7 MT 11567.7 10592.7<br />
39269010 PVC BELT CONVEYOR 43.8 41.9 MT 3777.0 3630.1<br />
59100010<br />
COTTON CANVAS PLY<br />
BELTING<br />
1.4 3.3 MT 84.1 199.7<br />
59100020<br />
RUBBERISED COTTON<br />
BELTING<br />
0.3 0.0 MT 12.0 0.3<br />
Total<br />
Exports<br />
188 179 MT 15542 14473<br />
Source: DGCIS,IMaCS Analysis<br />
Conveyor belts are majorly exported to U S A, Australia, South Africa, Somalia, Netherland and Italy.<br />
Out <strong>of</strong> the total exports <strong>technical</strong> <strong>textiles</strong> constitutes only about Rs 66 crore. These exports for the<br />
year 2012-13 are estimated to be Rs 106.3 crore.<br />
Key importers & exporters<br />
SRF is the key exporter <strong>of</strong> belting fabric in India and exports account for about 50% <strong>of</strong> the revenue <strong>of</strong><br />
belting fabrics.<br />
Raw materials<br />
The traditional cotton carcass has been replaced by synthetic textile constructions to meet the demand<br />
for long-haul conveyor requiring high tensile strength and adhesion, minimum stretch in service and a<br />
more flexible and thinner belt. The textile reinforced conveyer belts are made with primarily nylon<br />
and polyester. The belting fabric can be made <strong>of</strong> different fibres in the warp and weft direction. The<br />
belting fabrics are made by weaving the relevant fibres.<br />
Quality Control and Standards<br />
The design <strong>of</strong> a conveyor belt is determined by conditions imposed by the particular material to be<br />
carried. A belt should have adequate tensile strength, sufficient width, flexibility, dimensional<br />
stability, good adhesion between components, tear resistance etc. Bureau <strong>of</strong> Indian Standards (BIS)<br />
has developed standards for conveyor belts (IS: 1891).<br />
Drive Belts<br />
A belt drive is a method <strong>of</strong> transferring rotary motion between two shafts. A belt drive includes one<br />
pulley on each shaft and one or more continuous belts over the two pulleys. The motion <strong>of</strong> the<br />
driving pulley is, generally, transferred to the driven pulley via the friction between the belt and the<br />
pulley.<br />
Product description
The transmission belts can be classified as Flat, Vee, Poly-Vee, Timing/synchronous belts etc. Vee<br />
belts (or V Belts) are the most widely used belts. V belt drives replaced flat belt drives for many<br />
applications because higher power could be transmitted with more compact drive arrangements. V<br />
Belt Drives achieve drive efficiencies <strong>of</strong> about 95%.<br />
V belts are used in alternators, air conditioning compressors, power steering pumps and water pumps,<br />
apart from fans in automobiles as well as a number <strong>of</strong> industries. There are different types <strong>of</strong> V-belts;<br />
some <strong>of</strong> them are wedge section V belts; high capacity narrow V-belts; hexagonal V-belts; multi rib<br />
poly V-belts; automotive timing belts; auto wrapped belts in wedge and classical types; and variable<br />
speed drive belts for two wheeler applications. Generally three types <strong>of</strong> V belts are commonly used:<br />
raw –edged, v-ribbed, and wrapped. They come in five standard sizes A, B, C, D and E. The top width<br />
<strong>of</strong> A is 12.7 mm (1/2 in) and that <strong>of</strong> E is mm (1) and the thickness varies between the different sizes.<br />
When power transmitted is heavy multiple belts are used in pulleys having a number <strong>of</strong> grooves as<br />
required.<br />
The selection <strong>of</strong> the type <strong>of</strong> V belt depends on the power capacity <strong>of</strong> the drive and the small pulley's<br />
shaft speed (rev/s), acceptable limits <strong>of</strong> the speed ratio, pitch length <strong>of</strong> the belt(s), and diameters <strong>of</strong> the<br />
two pulleys etc. When correctly specified, V belts can be expected to deliver 25000 hours <strong>of</strong> service<br />
(around 3 years continuous, or 5 years normal use) before belt replacement is required.<br />
Market dynamics<br />
V belts find applications in textile industry (textile machinery, textile spinning, texturing, weaving<br />
units), chemical and fertilizer industry, steel, engineering, railways, pharmaceuticals, cement and<br />
paper industry (printing & packaging, paper conversion) among others. The market for V belts can be<br />
broadly divided into two segments- industrial and automotive. The industrial belts account for 55-60<br />
% <strong>of</strong> the total market.<br />
Key manufacturers<br />
The major manufacturers <strong>of</strong> V belts are Fenner India, Pix transmissions, Nirlon Ltd and L.<br />
G.Balakrishnan & Bros Ltd. The production details are given in the following table.<br />
Market size<br />
Company Volume ( in number <strong>of</strong> pieces) Value (Rs Crore)<br />
Fenner 8047000 79<br />
Pix 8225165 84<br />
Nirlon 485721 4.4<br />
Good Year 253000 3<br />
Source: Capitaline, <strong>Industry</strong> survey
The current and future market size is given below.<br />
Market size<br />
Units 2007-2008 2012-2013<br />
Quantity Value(Crore Rs) Quantity Value(Crore Rs)<br />
Drive belts Nos.(Crore) 5.2 536.7 7.5 770.4<br />
TT component MT 5076 84 7288 121<br />
Source:Capitaline, <strong>Industry</strong> survey, IMaCS Analysis<br />
The market for drive belts is estimated to be 5.21 Crore pieces which amount Rs 535.65 Crore. The<br />
corresponding TT requirement is 5076 tonnes valued at Rs 84.1 Crore. The market is estimated to<br />
have a growth rate <strong>of</strong> 7.5 % per annum. The demand for TT material is estimated to 7288 tonnes<br />
worth Rs 121 Crore.<br />
Imports and Exports<br />
The import details <strong>of</strong> conveyor belts are given in the following table.<br />
HS Code Description<br />
40103110 ENDLESS TRNSMSN BLT/BLTNG OF V-<br />
BLT,V-RIBBDOF CIRCUMFRNS BETWN<br />
180 CM & 240 CM WHERE RUBR<br />
COMPD LESS THAN 25% BY WT.<br />
Imports (in Rs<br />
Crore)<br />
2006-<br />
07<br />
2007-<br />
08(E)<br />
Unit<br />
Imports (Quantity)<br />
2006-07<br />
2007-<br />
08(E)<br />
2.8 2.7 MT 52.6 91.6<br />
40103190 ENDLES TRNSMSN BLT/BLTNG OF V-<br />
BLT/V-RIBBEDOF CIRCUMFRNS<br />
BETWN 180 CM & 240 CM WHERE<br />
RUBR COMPD MORE THAN 25% BY<br />
WT. 24.4 23.0 MT 725.1 903.1<br />
40103210 ENDLESS TRNSMSN BLT/BLTNG OF V-<br />
BLT/OTHER THAN V-RIBBED OF<br />
CIRCUM BETWN 60 CM & 180 CM<br />
WHERE RUBY COMPN LESS THAN 25%<br />
BY WT. 0.1 0.3 MT 4.2 13.1<br />
40103290 ENDLESS TRNSMSN BLT/BLTNG OF V-<br />
BLT/OTHER THAN V-RIBBED OF<br />
CIRCUM BETWN 60 CM & 180 CM<br />
WHERE RUBY COMPD MORE THAN<br />
25% BY WT. 0.2 0.4 MT 6.7 12.3<br />
40103310 ENDLESS TRNSMSN BLT/BLTNG OF V-<br />
BLT/V-RIBBDOF CIRCUM BETWN 60<br />
CM & 180 CM WHERE RUBY COMPN<br />
LESS THAN 25% BY WT. 0.0 0.1 MT 0.1 1.3<br />
40103390 ENDLESS TRNSMSN BLT/BLTNG OF V-<br />
BLT/V-RIBBDOF CIRCUM BETWN 60<br />
CM & 180 CM WHERE RUBY COMPD<br />
MORE THAN 25% BY WT. 0.2 1.2 MT 3.2 39.8
HS Code Description<br />
Imports (in Rs<br />
Crore)<br />
2006-<br />
07<br />
2007-<br />
08(E)<br />
Unit<br />
Imports (Quantity)<br />
2006-07<br />
2007-<br />
08(E)<br />
40103410 ENDLESS TRNSMSN BLT/BLTNG OF V-<br />
BLT/OTHER THAN V-RIBBED OF<br />
CIRCUM BETWN 180 CM & 240CM<br />
WHERE RUBY COMPD LESS THAN 25%<br />
BY WT. 0.0 0.0 MT 0.7 0.9<br />
40103490 ENDLESS TRNSMSN BLT/BLTNGS OF<br />
V-BLT OTHER THAN V-RIBBED OF<br />
CIRCUM BETWN 180 CM & 240CM<br />
WHERE RUBY COMPD MORE THAN<br />
25% BY WT. 0.7 0.8 MT 18.3 15.3<br />
40103510 ENDLESS SYNCHRONOUS BELTS,OF A<br />
CIRCUMFRNCEBETWN 60CM & 150CM<br />
WHERE RUBY COMPD LESS THAN 25%<br />
BY WT. 0.0 1.2 MT 34.46 45.95<br />
40103590 ENDLESS SYNCHRONOUS BELTS,OF A<br />
CIRCUMFRNCE BETWN 60CM &150CM<br />
WHERE RUBY COMPN MORE THAN<br />
25% BY WT.W 0.1 0.1 MT 1.73 2.31<br />
40103610 ENDLESS SYNCHRONOUS BELTS,OF A<br />
CIRCUMFRNCEBTWN 150CM &198CM<br />
WHERE RUBY WHERE RUBY COMPD<br />
LESS THAN 25% BY WT.<br />
0.0 3.9 MT 69.17 92.23<br />
40103690 ENDLESS CYNCHRONOUS BLTS,OF A<br />
CIRCUMFRNCE BTWN 150CM & 198CM<br />
WHERE RUBY COMPD MORE THAN<br />
25% BY WT. 0.5 0.5 MT 14.08 18.77<br />
Total<br />
Imports 29 34 930 1237<br />
Source: DGCIS, IMaCS Analysis<br />
Most <strong>of</strong> the drive belts are imported from China, Thailand, Czech Republic, Italy, Japan and Korea.<br />
HS Code Description<br />
40103110 ENDLESS TRNSMSN BLT/BLTNG OF V-<br />
BLT,V-RIBBDOF CIRCUMFRNS BETWN<br />
180 CM & 240 CM WHERE RUBR COMPD<br />
LESS THAN 25% BY WT.<br />
40103190 ENDLES TRNSMSN BLT/BLTNG OF V-<br />
BLT/V-RIBBEDOF CIRCUMFRNS<br />
BETWN 180 CM & 240 CM WHERE RUBR<br />
COMPD MORE THAN 25% BY WT.<br />
Exports<br />
(in Rs Crore)<br />
Exports (Quantity)<br />
2006-07 2007-08(E) Unit 2006-07 2007-08(E)<br />
1.6 1.2 MT 91.4 122.8<br />
16.3 21.5 MT 1038.2 1174.9<br />
40103210 ENDLESS TRNSMSN BLT/BLTNG OF V-<br />
BLT/OTHER THAN V-RIBBED OF<br />
CIRCUM BETWN 60 CM & 180 CM<br />
WHERE RUBY COMPN LESS THAN 25%<br />
BY WT. 1.2 0.0 MT 113.0 0.8<br />
40103290 ENDLESS TRNSMSN BLT/BLTNG OF V-<br />
BLT/OTHER THAN V-RIBBED OF<br />
CIRCUM BETWN 60 CM & 180 CM<br />
WHERE RUBY COMPD MORE THAN<br />
25% BY WT. 4.9 4.1 MT 245.8 315.7
40103310 ENDLESS TRNSMSN BLT/BLTNG OF V-<br />
BLT/V-RIBBDOF CIRCUM BETWN 60 CM<br />
& 180 CM WHERE RUBY COMPN LESS<br />
THAN 25% BY WT. 1.1 0.0 MT 86.7 0.0<br />
40103390 ENDLESS TRNSMSN BLT/BLTNG OF V-<br />
BLT/V-RIBBDOF CIRCUM BETWN 60 CM<br />
& 180 CM WHERE RUBY COMPD MORE<br />
THAN 25% BY WT. 2.3 2.5 MT 180.5 173.0<br />
40103410 ENDLESS TRNSMSN BLT/BLTNG OF V-<br />
BLT/OTHER THAN V-RIBBED OF<br />
CIRCUM BETWN 180 CM & 240CM<br />
WHERE RUBY COMPD LESS THAN 25%<br />
BY WT. 0.03 0.3 MT 0.8 24.8<br />
40103490 ENDLESS TRNSMSN BLT/BLTNGS OF V-<br />
BLT OTHER THAN V-RIBBED OF<br />
CIRCUM BETWN 180 CM & 240CM<br />
WHERE RUBY COMPD MORE THAN<br />
25% BY WT. 2.5 3.2 MT 156.5 196.4<br />
40103590 ENDLESS SYNCHRONOUS BELTS,OF A<br />
CIRCUMFRNCEBETWN 60CM &150CM<br />
WHERE RUBY COMPN MORE THAN<br />
25% BY WT.W 1.1 2.7 MT 52.3 131.1<br />
40103610 ENDLESS SYNCHRONOUS BELTS,OF A<br />
CIRCUMFRNCEBTWN 150CM &198CM<br />
WHERE RUBY WHERE RUBY COMPD<br />
LESS THAN 25% BY WT. 1.9 0.2 MT 106.4 12.1<br />
40103690 ENDLESS CYNCHRONOUS BLTS,OF A<br />
CIRCUMFRNCE BTWN 150CM & 198CM<br />
WHERE RUBY COMPD MORE THAN<br />
25% BY WT. 1.7 0.6 MT 120.6 26.5<br />
Total<br />
Exports 35 36 2192 2178<br />
Source: DGCIS, IMaCS Analysis<br />
The Export details <strong>of</strong> conveyor belts are given in the table above. The drive belts are exported to<br />
Australia, U S A, Taiwan, Denmark and South Africa. Out <strong>of</strong> the total exports <strong>technical</strong> <strong>textiles</strong><br />
constitutes only about Rs 36 crore. These exports for the year 2012-13 are estimated to be Rs 39.9<br />
crore.<br />
Type <strong>of</strong> Raw materials<br />
V belts are generally manufactured from a core <strong>of</strong> high tensile cord in a synthetic rubber matrix<br />
enclosed in a fabric reinforce rubber lining. Woven fabric or cord that is reinforced as ply in the drive<br />
belt is primarily made <strong>of</strong> polyester, Nylon, and cotton.<br />
Premium industrial belts known as 3V, 5V and 8V belts or wedge type belts have been introduced in<br />
the market over the last few years. In these the ratio <strong>of</strong> depth to the top width is greater than in the<br />
standard sections, giving a more compact drive. These constructions are made possible by the use <strong>of</strong><br />
high tenacity materials such as polyester cord. The <strong>technical</strong> textile requirement is 26 % <strong>of</strong> the value<br />
<strong>of</strong> the belt.
Quality Control and Standards<br />
Raw Material % by weight<br />
Carbon black 29%<br />
Cord 10%<br />
Jacketing fabric 16%<br />
Natural Rubber/ Polychloroprene Rubber 40%<br />
Sulphur 1%<br />
Zinc oxide 2%<br />
Others 2%<br />
The relevant BIS standards are IS 2494: Part 1: 1994, IS 2494: Part 2: 1993.<br />
RDSO has the following standard for V belts used for alternators: RDSO/PE/SPEC/AC/0059 -2004.
Computer Printer Ribbon<br />
The computer printer cartridge <strong>of</strong> a Dot matrix printer (DMP) consists <strong>of</strong> a cassette and inked fabric<br />
called the printer ribbon. The cartridge is replaced when no further prints can be availed, however in<br />
order to save on costs only the ribbon portion is changed which is called the refill.<br />
Product Characteristics<br />
The Nylon 6 yarn is woven into a fabric which is cut to required size for making computer printer<br />
ribbons. The properties essential for this fabric is<br />
1. High tensile strength<br />
2. Good absorption capacity and capillary action<br />
3. Smudge resistance<br />
4. Scratch resistance<br />
5. Good heat resistance<br />
These properties enable the ribbon to carry the ink and undergo stress during printing.<br />
Market dynamics and key growth drivers<br />
The sale <strong>of</strong> dot matrix printers (DMP) is key driver <strong>of</strong> computer ribbon demand. The dot matrix<br />
printing technology is old and has been succeeded by ink-jet and laser printer technology. However,<br />
dot matrix printers continue to thrive and grow largely due to demand from applications that require<br />
large volume printing and where duplicate copies <strong>of</strong> the print need to be generated in an automated<br />
manner. Examples <strong>of</strong> such usage areas include banks, railway booking centres, retail store billing<br />
systems etc.<br />
The growth in sales volume <strong>of</strong> DMP in India over the last 5 years is given below:<br />
'000 units 2002-03 2003-04 2005-06 2006-07 2007-08<br />
Dot Matrix Printer sales 316 346 399 472 441<br />
There also exists a replacement demand for DMPs. Typically, DMPs which are more than six years<br />
old are replaced as the operational performance deteriorates due to wear and tear <strong>of</strong> the printer head.<br />
The leading suppliers <strong>of</strong> DMP systems in India are TVS Electronics, Wipro e-peripherals and Epson.<br />
Key manufacturers <strong>of</strong> computer ribbons<br />
The key manufacturers <strong>of</strong> computer ribbons in India are:<br />
1. Abee-Info Consumables<br />
2. TVS Electronics<br />
3. WeP (formerly Wipro e-Peripherals)<br />
4. Lipi Data Systems
5. Inkwayz – Super Tech Ribbon Pvt. Ltd.<br />
Market size <strong>of</strong> computer ribbon in India<br />
The dimensions <strong>of</strong> the printer ribbon vary based on the area <strong>of</strong> application and type <strong>of</strong> printer.<br />
Computer ribbons for print cartridges are available in different lengths varying from 10 to 50 metres<br />
length. The typical width <strong>of</strong> the ribbon is one centimetre (0.01 metres). Based on the inputs received<br />
from the industry players, the average area <strong>of</strong> inked fabric used in the cartridge is around 0.4 square<br />
metres at per square metre price <strong>of</strong> around Rs.150. Replacement <strong>of</strong> ribbons is dependent on the usage<br />
pattern relating to volume <strong>of</strong> pages printed with the month is usually on a monthly basis. The current<br />
size and the future forecast <strong>of</strong> computer ribbon industry are given below:<br />
DMP ribbon industry 2007-08 2012-13<br />
Printer ribbon market volume<br />
(‘000 units)<br />
Printer ribbon usage (million<br />
square metres)<br />
Printer ribbon market (in<br />
Crore)<br />
27840 39667<br />
12.9 18.4<br />
193.8 290<br />
Source: <strong>Industry</strong> survey, IMaCS Analysis<br />
The market for computer ribbon industry in 2012-13 is expected to be worth Rs.290 Crore, up from an<br />
Rs. 193.8 Crore in 2007-08. An inflationary increase <strong>of</strong> 5% has been assumed for the price <strong>of</strong> the<br />
material as the prices are driven by price <strong>of</strong> Nylon 6. In volume terms, the usage <strong>of</strong> printer ribbon is<br />
expected to grow from 12.9 million square metres in 2007-08 to 18.4 million square metres in 2012-<br />
13. The growth in demand for computer ribbons is assumed to be 9% over the next five years driven<br />
primarily by the increased usage <strong>of</strong> DMPs as bill printing solutions in merchandise retailing. The<br />
assumed growth rate also takes into account the competition from thermal paper printing which<br />
moderates the growth <strong>of</strong> DMP systems.<br />
Abee Info consumables is the leading producer <strong>of</strong> computer printer ribbons in India.<br />
Manufacturer Year Value (Rs. Crore)<br />
Abee Info consumables (Printer ribbon) 2007-08 1.25<br />
TVS – Electronics (Spares and Others) 2007-08 27.9<br />
Wipro e-Peripherals 2007-08 NA
The figures for import <strong>of</strong> computer ribbon over the last three years are given below:<br />
Source: Abee Info,TVSE<br />
HS Code Description Imports (Rs Crore) Imports (Quantity)<br />
96121010 COMPUTERS<br />
PRINTER RIBBON<br />
2005-<br />
06<br />
2006-<br />
07<br />
2007-<br />
08(E)<br />
Unit 2005-<br />
06<br />
2006-<br />
07<br />
2007-<br />
08(E)<br />
15.8 15.8 16.5 NOS 672 471 554<br />
Total 15.8 15.8 16.5 NOS 672 471 554<br />
The export figures for computer ribbon are as given below:<br />
Source: DGCIS, IMaCS Analysis<br />
HS Code Description Exports (Rs Crore) Exports (Quantity)<br />
96121010 COMPUTERS<br />
PRINTER RIBBON<br />
2005-<br />
06<br />
2006-<br />
07<br />
2007-<br />
08(E)<br />
Unit 2005-<br />
06<br />
2006-<br />
07<br />
2007-<br />
08(E)<br />
15.8 9.7 7.1 NOS 784 836 519<br />
Total 15.8 9.7 7.1 NOS 784 836 519<br />
Source: DGCIS, IMaCS Analysis<br />
Computer ribbons are imported mainly from the following countries: Singapore – 23%, USA – 14%,<br />
Germany – 14% and France 11%. The major export market is USA which has a share <strong>of</strong> 64%. These<br />
exports for the year 2012-13 are estimated to be same at Rs 7.1 crore.<br />
Raw-materials<br />
The fabric is prepared from nylon yarn. It is then cut into required dimensions, soaked in ink which is<br />
<strong>of</strong> the consistency <strong>of</strong> wax or crayon, and packed in rolls.<br />
Quality Control and Standards<br />
There are no Indian standards.
Printed Circuit Board<br />
The Printed Circuit Board (PCB) is a mechanical device used to electrically connect and hold<br />
electronic components. The <strong>technical</strong> textile used in the manufacture <strong>of</strong> printed circuit board is the<br />
woven glass fibre fabric which is used as reinforcement along with the epoxy resin. The glass fibre<br />
impregnated resin called ‘prepregs’ is used to bind the copper foils to give copper laminated boards,<br />
called laminates. These laminates are further cut into various sizes based on the requirement.<br />
Product characteristics<br />
The glass fabric used affects the performance <strong>of</strong> final electronic circuitry built on the PCB. The “fibre<br />
weave effect” or FWE is one <strong>of</strong> the central issues associated with the influence <strong>of</strong> the glass<br />
reinforcement fibre on the electrical performance <strong>of</strong> the PCB.<br />
The glass fabric used for PCB is generally Style 1080 however there are various styles specified by<br />
IPC. The standard construction <strong>of</strong> this style <strong>of</strong> fabric involves 60 yarns per inch in the warp or<br />
machine direction and 47 yearns per inch in the weft or cross-machine direction. The thickness <strong>of</strong> the<br />
fabric is typically, 2.1mil (0.053mm).<br />
The desired properties <strong>of</strong> the glass fabric required for PCB applications are as follows:<br />
1. Dimensional stability<br />
2. Surface smoothness<br />
3. Ability to withstand laser and mechanical drilling<br />
4. Superior conductive anodic filament (CAF) resistance<br />
5. Uniform dielectric constant (generally in range <strong>of</strong> 6.6-6.9)<br />
6. Lower dissipation factor (0.006)<br />
7. Reduced signal skew and improved signal integrity<br />
Market dynamics and key growth drivers<br />
The PCB industry and hence the demand <strong>of</strong> glass reinforcement fabric is primarily driven by growth<br />
in the Electronic goods industries which includes computers and allied equipment, consumer<br />
durables, mobile phones, calculators etc. The growth production <strong>of</strong> electronic goods in India (value<br />
terms) as collated by Electronic <strong>Industry</strong> Association <strong>of</strong> India (ELCINA), during the last 5 years has<br />
been 13%, <strong>of</strong> which computer desktops and laptops was at 29% , communication and broadcasting<br />
equipment at 13%, consumer electronics at 8% and industrial and others at 15%.
Most leading mobile brands have invested in handset and related equipment manufacturing in India-<br />
Nokia, Motorola, Samsung, LG, and Ericsson. All leading PC Brands- Lenovo, Acer, and HP have<br />
assembly plants and are aiming at expansion. The booming electronics industry leads to growing<br />
demand for glass reinforcement fabric.<br />
Key manufacturers <strong>of</strong> glass fibre fabric<br />
The key manufacturers <strong>of</strong> glass fibre fabric for PCBs are:<br />
Manufacturer Year Capacity<br />
(MT)<br />
Production<br />
UP Twiga Fibres 2007-08 1200 NA<br />
Montex Fibre Glass 2005-06 NA 2.18 million<br />
meters<br />
Satyaluxmi<br />
International<br />
2007-08 NA NA<br />
SRM International 2007-08 NA NA<br />
Source: Capitaline, IMaCS Analysis<br />
Market size <strong>of</strong> printed circuit board and glass fibre fabric for printed market in India<br />
The Indian PCB industry is small compared to the world market. The Indian market is approximately<br />
2-3% <strong>of</strong> the Chinese PCB market in value terms. The trend in Indian PCB industry is as given below:<br />
Year 2004 2005 2006 2007<br />
PCBs produced<br />
(Million square metre)<br />
15 21 31.5 44.1<br />
Value (US$ million) 168 193 222 288.6<br />
Value (Rs. Crore) @ Rs. 40 per $ 672 772 888 1154<br />
Source: IPCA,Ministry <strong>of</strong> Information and Technology, IMaCS Analysis<br />
The industry has been growing at the rate <strong>of</strong> 40% by volume and 15-20% by value. PCB<br />
manufacturers in India mostly cater to the defence sector since the defence norms require local<br />
sourcing <strong>of</strong> these strategic components. However, the mobile phone, personal computers and<br />
communication technology sectors which are biggest consumers <strong>of</strong> PCBs still rely on imports<br />
however the Indian PCB industry is fast catching on. In India there are around 60 PCB manufacturers<br />
with around 15 large producers. Some <strong>of</strong> the major producers include AT&S, Cipsa, Epitome<br />
Components, Shogini Technoarts and Akasaka Electronics etc.<br />
Consumption norms and the market size<br />
The glass fibre fabric used for reinforcements is E-glass fibre which would be a 100-200 GSM fabric.<br />
The usage <strong>of</strong> the fabric is same as the surface area <strong>of</strong> the PCB.
The potential market for glass fibre fabric reinforcement for PCB industry in 2012-13 is estimated to<br />
be Rs.178 Crore from the current Rs 33 Crore, as shown in the following table:<br />
Printed Circuit Board industry 2007-08 2012-13<br />
PCBs ( in million square metre) 44 237<br />
Glass fibre fabric (in tonnes) 6615 35577<br />
Glass fibre fabric (in Crore) 33 178<br />
Source: <strong>Industry</strong> survey, IMaCS Analysis<br />
An inflationary increase has not been assumed for the price <strong>of</strong> the material as the prices have dropped<br />
over the years. In volume terms, the usage <strong>of</strong> glass fibre fabric is expected to grow from 6615 tonnes<br />
in 2007-08 to 35577 tonnes in 2012-13. The growth in the industry is assumed to be 40% over the<br />
next five years based on the growth <strong>of</strong> the end-user electronics industry in the country.<br />
The production <strong>of</strong> major PCB producers in India (single and double sided PCB) is given as follows:<br />
Manufacturer (Single Sided) Year Quantity (Sq. M)<br />
Epitome Components<br />
2005-06 720000<br />
Akasaka Electronics Ltd. 2005-06 480000<br />
Ascent Circuits Pvt. Ltd. 2005-06 300000<br />
Garg Electronics 2005-06 180000<br />
Genus Electrotech Pvt. Ltd. 2005-06 108000<br />
Shogini Technoarts 2005-06 66000<br />
NSP Electronics 2005-06 60000<br />
Source: IPCA, India<br />
Manufacturer (Multi-sided) Year Quantity (Sq. M)<br />
AT&S 2005-06 225000<br />
Shogini Technoarts 2005-06 180000<br />
Sonic Technology 2005-06 84000<br />
Circuit Systems India Ltd. 2005-06 75660<br />
CIPSA RIC 2005-06 72000<br />
Fineline Circuits, Mumbai 2005-06 56400<br />
Meena Circuits 2005-06 43200<br />
Ascent Circuits Pvt. Ltd. 2005-06 41000
Genus Electrotech Pvt. Ltd. 2005-06 36000<br />
Fineline Circuits, Baroda 2005-06 34800<br />
Source: IPCA, India<br />
The turnover <strong>of</strong> major PCB producers in India (single and double sided PCB) is given as follows:<br />
Manufacturer<br />
Year Turnover<br />
(USD million)<br />
AT&S 2005-06 40<br />
Shogini Technoarts 2005-06 13.3<br />
Sonic Technology 2005-06 9.3<br />
Circuit Systems India<br />
Ltd.<br />
2005-06 12.2<br />
CIPSA RIC 2005-06 8<br />
Fineline Circuits,<br />
Mumbai<br />
2005-06 6.6<br />
Ascent Circuits Pvt.<br />
Ltd.<br />
2005-06 11.55<br />
Genus Electrotech Pvt.<br />
Ltd.<br />
2005-06 4<br />
Hi Q Electronics 2005-06 5.3<br />
Epitome Components<br />
Ltd.<br />
2005-06 11.10<br />
Source: IPCA, India<br />
The import figures for glass fibre fabric for PCB* are as given below:<br />
HS Code Description Imports (in Rs Crore) Imports (Quantity)<br />
70191100<br />
70195100<br />
70195200<br />
CHOPPED STRANDS OF A<br />
LENGTH
Source: DGCIS, IMaCS Analysis<br />
The chopped strands are used for electrical applications other than PCB as well.<br />
The export figures for glass fibre fabric for PCB are as given below:-<br />
HS Code Description Exports (in Rs crore) Exports (Quantity)<br />
70191100<br />
70195200<br />
2005-<br />
06<br />
2006-<br />
07<br />
2007-<br />
08(E)<br />
Unit 2005-<br />
06<br />
2006-<br />
07<br />
2007-<br />
08(E)<br />
CHOPPED STRANDS OF A<br />
LENGTH 30CM PLN WVE,<br />
0.37 1.7 0.07 MT 31 302 3.2<br />
WEING
During the latest Indian Printed Circuit Association (IPCA) seminar the experts were <strong>of</strong> the view that<br />
the tight government regulations, including the zero-discharge norms, make a PCB manufacturer wait<br />
for about three months to one year to get clearance to start a unit in India. This is one reason why<br />
many foreign PCB manufacturers hesitate to start their operations in India. Despite huge demand,<br />
there are still few manufacturers with inadequate supply, thus forcing the electronic goods<br />
manufacturers to import PCBs.<br />
Raw materials and machinery<br />
The raw material used for glass fibre fabric is mon<strong>of</strong>ilament glass fibres. The filaments are further<br />
processed to produce yarn which is used for weaving the reinforcement fabric.<br />
The key machinery used for weaving glass fibre fabric is air-jet weaving machine the major producers<br />
<strong>of</strong> these air jet machines are as given below:<br />
1. Sulzer Textil, Switzerland<br />
2. SMIT SpA, Italy<br />
3. Lindauer Dornier GmbH, Germany<br />
4. Picanol, Belgium<br />
Quality Control and Standards<br />
The standards for manufacturing glass reinforcement fabric are set forth by IPC. The standard<br />
followed for manufacturing glass fibre fabric is IPC-4412.<br />
Paper Making Fabrics<br />
Paper machine clothing consists <strong>of</strong> large continuous belts <strong>of</strong> custom designed and custom<br />
manufactured, engineered fabrics that are installed on paper machines and carry the paper stock<br />
through each stage <strong>of</strong> the paper production process – pulp created and pressed to a mesh, dewatered,<br />
heated, and dried by paper-making machines to make paper web. The types <strong>of</strong> fabrics are as follows:<br />
• Forming fabric - single-layer and double layer fabrics, two-and-half layer designs.<br />
• Press fabrics - comprising single-base and multi base fabrics.<br />
• Dryer fabrics - which consist <strong>of</strong> woven mesh dryers fabrics, needled woven mesh dryers,<br />
spiral link dryer fabrics, and needled spiral link dryer fabrics.
The demand for these fabrics is primarily driven by paper mills. With the advent <strong>of</strong> technology<br />
synthetic material is being used to replace wire fabrics.<br />
Product Characteristics<br />
The paper making fabrics are made from polyester and polyamide wires which are woven to produce<br />
the fabric. Paper making fabric should have the following functionalities:<br />
1. Dewatering ability or good drain ability<br />
2. Transferability <strong>of</strong> wet paper web - transfer wet paper web safely to the next position by<br />
adhering the wet paper web to the felt.<br />
3. Run-ability - avoid undesirable conditions as snaking, deviation, vibration and wrinkling.<br />
4. Wear resistance and resistance to hair shedding<br />
5. Compaction resistance<br />
6. Paper surface smoothness - avoid any felt or roll markings.<br />
7. Uniformity<br />
8. Sustain high speeds <strong>of</strong> movement on paper making machine<br />
These vary according to the grades <strong>of</strong> paper, types <strong>of</strong> paper-making machines and the positions where<br />
the felts are used. In short, each position <strong>of</strong> the paper-making machine requires different felts.<br />
The different types <strong>of</strong> paper making felts are as given below:<br />
1. Flow punch - These are single layer Batt-on-mesh (BOM) type felts with a relatively light weight<br />
base fabric which are woven by mon<strong>of</strong>ilament and/or twisted mon<strong>of</strong>ilament yarns. It is relatively<br />
easy to convert Batt-on-base (BOB) type felts to BOMs. BOM felts are the most widely used.<br />
2. Dual punch - The base fabrics <strong>of</strong> dual-punch felts are woven by mon<strong>of</strong>ilament and/or twisted<br />
mon<strong>of</strong>ilament yarns into double layers to make large voids in felt and to resist against high<br />
pressure loadings. Moreover, dual-punch felts are highly efficient for preventing roll markings, so<br />
the felts are widely applicable for various kinds <strong>of</strong> paper-making machines including ones with<br />
high speed and high pressure loadings.<br />
3. Lamitech punch - Base fabrics <strong>of</strong> Lamitech-punch felts consist <strong>of</strong> top and bottom base layers with<br />
different mesh structures woven by mon<strong>of</strong>ilament and/or twisted mon<strong>of</strong>ilament yarns. The<br />
combinations <strong>of</strong> the top and bottom base layers are quite plentiful to meet customers' various<br />
requirements. Lamitech-punch felts are generally used at those positions which require high<br />
surface smoothness <strong>of</strong> paper, high speed and high pressure loadings and those positions where a<br />
large void volume is required for the felts.<br />
4. Aqua punch - Aqua-punch felts feature no knuckle points <strong>of</strong> warp and weft yarn on the base<br />
fabrics. Therefore, they can maintain quality smoothness under high loadings and are suitable for<br />
positions where a high paper surface finish is required.
5. Open punch - Open-punch felts are on-machine seamed felts which have been developed for<br />
easier felt installation onto paper machines. When the felts are installed onto the machines, loop<br />
holes at both ends <strong>of</strong> the felts are joined with pintle-wire to make them endless.<br />
6. Nip punch - Nip-punch felts are <strong>of</strong> the BOB type developed as the first needled felts, the base<br />
fabrics <strong>of</strong> which are made <strong>of</strong> spun yarn and/or a combination <strong>of</strong> spun and filament yarns.<br />
7. Warp punch - Warp-punch felts are <strong>of</strong> the BOB type which has been developed with the aim <strong>of</strong><br />
minimum contamination in base fabrics, with the characteristic <strong>of</strong> having a very small amount <strong>of</strong><br />
weft yarn if any.<br />
8. Flat punch - Flat-punch felts are <strong>of</strong> the BOB type which have been developed for better<br />
smoothness to the paper surface and have the characteristic <strong>of</strong> light weight base fabric.<br />
Market dynamics and key growth drivers<br />
The Indian paper industry has a total production at eight million tonnes. Per capita paper <strong>consumption</strong><br />
in India is seven kilogram. A modest increase <strong>of</strong> one kilogram per capita translates into 1.15 million<br />
tonnes <strong>of</strong> additional paper demand. Growth <strong>of</strong> domestic paper industry is higher than GDP growth.<br />
With growth in GDP and Purchasing Power, per capita paper <strong>consumption</strong> is bound to increase from<br />
the current low, thus leading to increased <strong>consumption</strong> <strong>of</strong> Fabrics. Some existing papermakers are in<br />
the process <strong>of</strong> expanding their production capacities and some new players have also indicated<br />
intention to set up paper mills in India, which could be a good opportunity for paper making felt<br />
manufacturers.<br />
Key manufacturers <strong>of</strong> paper making fabric<br />
The major producers <strong>of</strong> paper making fabrics in India are as given below:<br />
Manufacturer Year Quantity Value Installed<br />
(Rs. Crore) capacity<br />
Voith Paper<br />
Fabrics Limited<br />
2006-07 234 45.12 310 MT<br />
Wires & Fabriks<br />
Limited<br />
2006-07 102566* 37.93 65105 SqM<br />
Source: Capitaline, IMaCS Analysis<br />
*Wires & Fabriks is operating at 145% capacity utilisation, also surplus stocks from previous yeas<br />
Market size <strong>of</strong> paper making fabrics in India<br />
The demand for paper making fabric in India is partially catered by the two companies- Voith Paper<br />
Fabrics Ltd. and Wires & Fabriks S.A. Limited and rest is sourced through imports. The above<br />
mentioned companies are active in export market as well. The products are woven fabrics made from<br />
synthetic yarns (Nylon, Polyester and Polyamide) and can be classified as 100% <strong>technical</strong> textile. The<br />
synthetic yarns have completely replaced the traditional bronze wire fabrics.
Paper Making Fabric industry 2007-08 2012-13<br />
Paper making fabric (Rs. Crore) 93 119<br />
Source: <strong>Industry</strong> survey, IMaCS Analysis<br />
The potential market for paper making fabric industry is estimated to increase from Rs 93 Crore in<br />
2007-08 to Rs 119 Crore in 2012-13. The industry growth is anticipated to be stagnant over the next<br />
few years (assumed to grow at 5%).<br />
The paper making fabrics are imported from Italy, Germany, Sweden, Switzerland and other<br />
European countries, and lately from China and Korea as well. Owing to technological advances and<br />
availability <strong>of</strong> cheaper raw materials locally, imports from China are approximately 30% cheaper than<br />
Indian products which would affect the market for domestic producers. Estimated import <strong>of</strong> Fabric is<br />
as shown:<br />
HS Code Description Imports Quantity Imports (Rs Crore)<br />
2007-08(E) 2007-08(E)<br />
59112000, 59113210, 59113250,<br />
59113290, 59119010, 59119090,<br />
59113290<br />
Paper Making<br />
fabrics (Felts)<br />
The estimated export figures for paper making fabric are as shown:<br />
1128 Pieces 15.25<br />
Source: IBIS, IMaCS Analysis<br />
HS Code Description Exports Quantity Exports (Rs Crore)<br />
2007-08(E) 2007-08(E)<br />
59112000, 59113210,<br />
59113250, 59113290, 59119010,<br />
59119090, 59113290<br />
Paper Making<br />
fabrics (Felts)<br />
540 pieces<br />
Source: IBIS, IMaCS Analysis<br />
Paper making fabrics are exported to Middle East, Africa, Thailand, Pakistan, Sri Lanka and US.<br />
These exports for the year 2012-13 are estimated to be Rs 10 crore.<br />
Raw materials and machinery<br />
Polyester or polyamide wires are used for making the fabrics. Weaving is carried out on heavy duty<br />
modern wide looms, which are capable <strong>of</strong> producing fabrics <strong>of</strong> desired specifications. Weaving is<br />
followed by fibre-locking process. Fibre-locking process is carried out on automatic machines which<br />
ensure correct locking <strong>of</strong> the fibre layers with the base fabrics to achieve desired characteristics.<br />
7.6
The key machinery used for paper making fabrics is as given below:<br />
• Warp penetration machines<br />
• Weaving machine<br />
• Finishing and head setting machine<br />
The key manufacturer <strong>of</strong> these machines is Emil Jäger GmbH, Germany.<br />
Quality Control and Standards<br />
There are no Indian standards.
Composites<br />
The burgeoning manufacturing and infrastructure sectors are expected to provide an impetus to the<br />
composites industry in India. Production <strong>of</strong> composites involves combining polymer and glass fibre or<br />
carbon fibre in order to produce a material that is lighter yet stronger than steel. The <strong>technical</strong> textile<br />
material in the composites is the fibre glass.<br />
Fibre glass dominates the composites industry as a preferred reinforcement fibre, with a share <strong>of</strong><br />
around 85%-90%. Other reinforcement fibre like carbon fibre is sparingly used in India owing to its<br />
patented technology and high costs.<br />
Fibre glass is made <strong>of</strong> fine solid rods <strong>of</strong> glass each with thickness less than one twentieth the width <strong>of</strong><br />
human hair. Glass fibres are loosely packed together into a mass which can serve as heat insulators.<br />
They are also used like wool or cotton fibres to make glass yarn, tape, cloth and mats. Fibreglass also<br />
has applications in electrical insulation, chemical filtration and fire fighters’ suits. Combined with<br />
plastics, fibreglass is used for airplane wings and bodies, automobile bodies, wind mill blades and<br />
boat hulls.<br />
Product Characteristics<br />
The product characteristics vary based on the type <strong>of</strong> finished glass fibre product and end application:<br />
1. Chopped strands characteristics – High strand integrity, good flow and dispersion, good<br />
impregnation. The strand length varies from 1 mm to 6 mm.<br />
2. Chopped strand mat characteristics – Good surface bonding and integrity, compatibility with<br />
polyester resins etc. The basis weight varies from 225 GSM to 900 GSM, with strand length<br />
usually 50 mm.<br />
3. Assembled roving characteristics – Good resistance to weave distortion, good impregnation,<br />
good abrasion resistance, etc. The linear weight <strong>of</strong> yarn varies based on specification,<br />
however, the linear weight varies from 150 Tex to 4800 Tex<br />
4. Woven roving characteristics – High mechanical strength in directions <strong>of</strong> the weave,<br />
resistance to weave distortion, good impregnation and low resin <strong>consumption</strong>. Weight is<br />
based on specification and is typically 210 GSM to 800 GSM<br />
Market dynamics and key market drivers<br />
The market for fibre glass is driven by the application industries. The glass fibre is used primarily in<br />
the following industries:<br />
1. Wind energy - Wind Mill blades<br />
2. Chemicals industry
3. Piping<br />
4. Cooling towers<br />
5. Automobiles<br />
6. Oil and Gas<br />
7. Building and Construction<br />
8. Marine<br />
Wind Energy – Wind blades<br />
India has made tremendous progress in the wind energy industry where composite <strong>consumption</strong> has<br />
exceeded that <strong>of</strong> other developing and developed economies. India is the fourth largest generator <strong>of</strong><br />
wind power in the world. The Indian firm Suzlon Energy Ltd. has emerged as one <strong>of</strong> the leading<br />
suppliers <strong>of</strong> wind turbines in the global market. The glass fibre is used as reinforcement in wind mill<br />
blades.<br />
Chemical Equipment / Piping / Cooling towers<br />
The major use <strong>of</strong> composites in India began with the chemical industry because <strong>of</strong> excellent corrosion<br />
resistance properties <strong>of</strong> the composites. Applications in this sector include chemical equipment,<br />
piping and fire fighting breathing apparatus. Composite pipes have applications as ducts in sea-water<br />
intakes and effluent discharge in desalination plants, sewer pipelines, etc. Composites are also being<br />
used for fabricating cooling tower units where the composite materials resist the corrosive effects <strong>of</strong><br />
moisture.<br />
Railways<br />
Composites were identified as a potential material for application in the Indian Railways in the early<br />
1980s for many passenger coach components such as louvre and glass shutters, window sills and<br />
frames, trays for battery boxes, ceilings, and flooring. The railways was working towards the<br />
complete elimination <strong>of</strong> timber and plywood in the coaches.<br />
Automotive<br />
The automobile industry is another sector where significant amounts <strong>of</strong> composite materials have<br />
been used in passenger cars, scooters and helmets.<br />
Oil and Gas<br />
There are a vast number <strong>of</strong> potential applications for composites in the oil and gas sector in India in<br />
high-pressure pipes and pipe fittings. Current <strong>of</strong>fshore structural applications <strong>of</strong> composites include<br />
low-pressure pipes, gratings, handrails, equipment covers or enclosures and ladders, because <strong>of</strong> their<br />
low weight, corrosion resistance, improved life-cycle costs and enhanced safety.
Building and Construction<br />
Construction is also a key area for composite usage. The infrastructure business is witnessing<br />
extraordinary growth and with improved / advanced construction techniques, the demand for<br />
composites is set to increase over the years.<br />
Marine<br />
The use <strong>of</strong> composites for boat building applications started in early 1970s for replacing wood<br />
because <strong>of</strong> the advantages <strong>of</strong> corrosion resistance, ease <strong>of</strong> fabrication, improved performance and low<br />
cost.<br />
The overview <strong>of</strong> composite (glass fibres) <strong>consumption</strong> in India is given in the table below:<br />
Area <strong>of</strong> application Usage in 2007 (MT) Usage in 2008 (MT)<br />
Wind Energy 20270 25960<br />
Chemical 12100 13310<br />
Piping 11500 13225<br />
Cooling Towers 5500 6050<br />
Railways 9600 11520<br />
Passenger Cars 7722 8420<br />
Helmets – Two wheelers 8772 10000<br />
Oil and Gas 1600 1700<br />
Building and Construction 39500 44650<br />
Marine 1400 1800<br />
Others 6174 6483<br />
Total (MT) 124138 143118<br />
Source: TIFAC Report ‘Technology-linked Business Opportunities in composites in India<br />
Key manufacturers <strong>of</strong> composites<br />
There are three major producers <strong>of</strong> glass fibre in India - Owens Corning India Limited, Goa Glass<br />
Fibre Limited and UP Twiga Fibres. Total annual capacity is estimated at 82,000 MT per annum, as<br />
shown:<br />
Manufacturer Year<br />
Capacity<br />
(MT)<br />
Production<br />
(MT)<br />
Owens Corning India<br />
Limited<br />
2007-08 51500 50000
Goa Glass Fibre Limited 2007-08 10300 11377<br />
U P Twiga Fibres 2007-08 16800 10119<br />
Others 2007-08 3400 1312<br />
Total 2007-08 82000 72808<br />
Source: Goa Glass Fibre, Capitaline, <strong>Industry</strong> Survey, IMaCS Analysis<br />
Leading multinational companies operating in the segment <strong>of</strong> fibreglass and fibreglass fabric are<br />
Saertex, LM Glass Fibre (turnover <strong>of</strong> Rs. 500 crore in India), Vestas and Dupont.<br />
Amongst the smaller players, Montex Glass Fibre Industries manufactured 21.8 Lakh metres <strong>of</strong> glass<br />
fabric with value <strong>of</strong> Rs 5.72 crore in 2005-06. Harsh Deep Industries manufactured 4 Lakh metres in<br />
2005-06 valuing around Rs 3 crore. Vishnu Fabrics is another niche player manufacturing speciality<br />
coated Glass Fibre <strong>technical</strong> textile mesh fabrics for reinforcing roads, gypsum walls and plaster;<br />
glass mesh for external insulation finishing system, glass geo-<strong>textiles</strong> for preventing soil erosion;<br />
glass mesh jointing self-adhesive tapes for jointing gypsum and calcium silicate boards and Cenfill<br />
Glass Fibres for fibre reinforcement for cement and gypsum. Cenfill exports to UK, South Africa,<br />
Israel, West Asia and USA. The unit had production <strong>of</strong> 25 Lakh Sq. Metres in 2005-06 with a value <strong>of</strong><br />
Rs 5.8 crore.<br />
Market size <strong>of</strong> composites (<strong>technical</strong> <strong>textiles</strong> component) in India<br />
India approximately has an installed production capacity <strong>of</strong> around 82,000 MT per annum <strong>of</strong> glass<br />
fibre. The major producers <strong>of</strong> glass fibre in India are Owens Corning India Limited and Goa Glass<br />
Fibre Limited which account for nearly 70%-75% <strong>of</strong> the total Glass Fibre capacity in India. Imports<br />
also constitute a major share <strong>of</strong> glass fibre <strong>consumption</strong> in India.<br />
Glass Fibre usage is diverse ranging from reinforcement fabric in printed circuit boards to aircraft<br />
wings. The total production in India is approximately 73,000 MT; the imports in 2007-08 were around<br />
60,000 MT (E) and exports in 2007-08 have been around 33,000 MT (E) (the average exports <strong>of</strong> the<br />
Glass Fibre category is around 25,000-30,000 MT per annum and the average imports for the last<br />
three years are around 50,000 MT per annum). The approximate domestic market for glass fibre is<br />
around 100,000 MT per annum.<br />
The glass fibre and composites market is witnessing strong growth stimulus, primarily on account <strong>of</strong><br />
strong focus on infrastructure investments in India. Wind energy and pipeline systems are two<br />
applications where glass fibre reinforcements are finding extensive usage in India. The industry is<br />
expected to grow at 15% y-o-y over the next five years.
The current and future forecast <strong>of</strong> composites (<strong>technical</strong> <strong>textiles</strong> component) industry is given below:<br />
Composites (<strong>technical</strong> <strong>textiles</strong><br />
component)<br />
(<strong>Domestic</strong> <strong>consumption</strong>)<br />
2007-08 2012-13<br />
Volume (in MT) 100,000 MT 175,000 MT<br />
Value (in Rs. Crore) Rs 650 crore Rs 1,400 crore<br />
Source: <strong>Industry</strong> survey, IMaCS Analysis<br />
The potential market for composites (<strong>technical</strong> <strong>textiles</strong> component) in 2012-13 is estimated at Rs.<br />
1,400 crore, up from around Rs. 650 crore in 2007-08 (E). No inflationary increase has been assumed<br />
for the price <strong>of</strong> the material. In volume terms, the domestic usage <strong>of</strong> composites (<strong>technical</strong> <strong>textiles</strong><br />
component) is expected to grow from around 100,000 MT in 2007-08 to around 175,000 MT in 2012-<br />
13.<br />
Imports and Exports <strong>of</strong> Glass fibre fabric and its elements<br />
The import figures for Glass Fibre and made-ups are given below:-<br />
HS Code Description Imports (in Rs Crore) Imports (Quantity)<br />
70191100<br />
CHOPPED STRANDS OF A<br />
LENGTH
HS Code Description Imports (in Rs Crore) Imports (Quantity)<br />
2005- 2006- 2007-<br />
Unit<br />
2005- 2006- 2007-<br />
06 07 08(E)<br />
06 07 08(E)<br />
70199010 GLASS WOOL/GLASS FIBRE 37 64 56 MT 3,169 5,723 4,857<br />
70199090<br />
OTHR MD-UP ARTCLS OF<br />
GLS FBRS (FBR GLS NES<br />
47 53 68 MT 3,033 3,187 3,431<br />
Total 267 461 443 MT 41,351 58,446 59,558<br />
The export figures for Glass fibre are given below:-<br />
Source: DGCIS, IMaCS Analysis<br />
HS Code Description Exports (in Rs Crore) Exports (Quantity)<br />
70191100<br />
CHOPPED STRANDS<br />
OF A LENGTH
The import <strong>of</strong> Glass fibre products into India is dominated by China, Germany, USA, Korea and UK.<br />
These five nations contribute to 75% <strong>of</strong> India’s imports. The glass fibre prices are expected to firm up<br />
going forward. India exports to Middle East countries and European countries (like Belgium) which<br />
account for about 78% <strong>of</strong> total exports from India. These exports for the year 2012-13 are estimated to<br />
be Rs 609 crore.<br />
Key machinery used<br />
The key machinery used in process <strong>of</strong> Glass Fibre strands is given below:<br />
1) Stitching machines<br />
a) LIBA GmbH<br />
b) Malimo<br />
2) Weaving machines<br />
a) Dornier<br />
Quality Control and Standards<br />
The standards generally used are BS3496, BS3691, and BS3749.
Ropes and Cordages<br />
Synthetic ropes and cordages are substitutes to traditional ropes and cordages made from jute and<br />
cotton. The synthetic ropes and cordages are primarily made from polypropylene and polyethylene.<br />
The 3-Strand and 4-Strand ropes required for fisheries, electricity boards, defence, ports and<br />
shipbuilding yards, stevedoring companies, steel pipe industries, sugar factories, engineering and oil<br />
exploration. The company also makes 8-Strand ropes that are ideal for marine applications like<br />
mooring lines, towing lines, messenger lines and on-board oil rigs. These products are manufactured<br />
to desired specifications.<br />
Product characteristics<br />
The ropes are generally available in 3-strand, 4-strand and 8-strand with standard lengths <strong>of</strong> length<br />
110, 220, 330 and 440 metres and other customer specifications. The diametre <strong>of</strong> the ropes varies<br />
from ½ inch to 7 inches. The functional specifications <strong>of</strong> ropes are<br />
• Excellent strength<br />
• Controlled elongation<br />
• Abrasion resistance<br />
• Heat resistance<br />
• Non-corrosive<br />
• Light weight<br />
• High flexibility<br />
• Inert to chemicals<br />
The ropes are made from polypropylene and HDPE polymer fibers.<br />
Key manufacturers<br />
The manufacturers <strong>of</strong> synthetic ropes are given below:<br />
• Garware Wall Ropes – Production – 11674 tonnes/annum;<br />
• Tufropes – Production – 4800 tonnes/annum<br />
• Sona Ropes<br />
• Krishna Filaments – Capacity – 21000 tonnes/annum; Production – Nil<br />
• Axel Polymer Ltd. – Capacity – 3000 tonnes/annum<br />
In addition to the organised there are large numbers <strong>of</strong> producers in the un-organised sector located<br />
mainly in Gujarat, West Bengal, Uttar Pradesh and Delhi.
Market dynamics and key growth drivers<br />
The market <strong>of</strong> ropes and cordages is primarily driven by growth in application areas. The main<br />
application areas <strong>of</strong> synthetic ropes is as given below:<br />
1. Fisheries – The biggest consumers <strong>of</strong> synthetic ropes<br />
The Indian fisheries industry is the biggest consumer <strong>of</strong> synthetic ropes. There are a large<br />
number <strong>of</strong> fishing vessels which carry around 80 kilograms <strong>of</strong> rope per vessel. Total number<br />
<strong>of</strong> fishing vessels in 2008 is estimated to be 264134. The demand for synthetic ropes from<br />
fisheries is estimated to be around 21976 tonnes. The growth in this sector generally tracks<br />
the growth in fisheries which is approximately 3-4% per annum.<br />
2. Shipping<br />
The synthetic ropes required in shipping are primarily for mooring purposes. 8-strand rope is<br />
generally used for this purpose. As <strong>of</strong> January 2008 the Indian fleet has a total <strong>of</strong> 850 vessels<br />
<strong>of</strong> which 573 are coastal ships and 277 overseas. The coastal ships typically require 12 coils<br />
<strong>of</strong> ropes and overseas ships require 22 coils. In tonnage coastal ships typically require 5-6<br />
tonnes <strong>of</strong> rope and overseas ships require 9-10 tonnes <strong>of</strong> synthetic ropes. The total demand<br />
from shipping is approximately around 5512 tonnes per annum. The sector is growing<br />
approximately at around 7% per annum.<br />
3. Marine ports<br />
The marine ports have under development over the recent past and both the traffic and<br />
efficiencies at ports in India has improved. India has around 12 major ports and 187 minor<br />
ports. The minor port approximately require five to six tonnes <strong>of</strong> ropes and major ports<br />
require around 80-100 tonnes <strong>of</strong> rope. The total demand from ports is approximately around<br />
3200 tonnes.<br />
4. Transport – Road trucks, Railways and Airports<br />
The demand for ropes in transport is as given below:<br />
(i) The transportation trucks require ropes which typically ranges around 10 kilograms<br />
per truck. There are around 373907 trucks on road considering 15 years data which<br />
would require around 1500 tonnes <strong>of</strong> synthetic ropes<br />
(ii) Railways requires around 600-700 tonnes <strong>of</strong> ropes annually for cargo transport<br />
(iii) Airport require about 50-60 tonnes <strong>of</strong> ropes annually. Indian has about 81 fully<br />
operational airports which would result in demand <strong>of</strong> around 4000-4800 tonnes<br />
The other major consumers <strong>of</strong> synthetic ropes are given below:<br />
5. Defence – Navy and Army
6. Oil Rigs<br />
7. Electricity boards<br />
8. Sugar Mills<br />
9. Construction Industries<br />
The miscellaneous areas where synthetic ropes find application are slings in bags, household<br />
usage, clothline etc.<br />
Market size <strong>of</strong> ropes and cordages<br />
The demand for ropes and cordages in India is close to ~Rs.634 crore (net <strong>of</strong> imports and exports for<br />
synthetic ropes and cordages). The production <strong>of</strong> ropes and cordages is approximately ~Rs.669 crore.<br />
Garware Wall Ropes Limited is the biggest player in the organised sector with close to 90% market<br />
share. The unorganised sector commands a major share in production. The leading states in cordage<br />
industry are Tamil Nadu, Maharashtra, Punjab, Gujrat and Madhya Pradesh. The cordage industry<br />
tracks the growth in shipping, fishing and other industries mentioned above.<br />
The ropes and cordages are made from Polypropylene, Polyethylene or High density polyethylene<br />
(HDPE). Due to high density <strong>of</strong> HDPE products polypropylene and other polyethylene products are<br />
considered for most industrial applications. Ropes and cordages are 100% <strong>technical</strong> textile product.<br />
The current and future forecast <strong>of</strong> ropes and cordages industry is given below:-<br />
Ropes and Cordage industry 2007-08 2012-13<br />
Ropes and Cordages (in MT) 115371 170066<br />
Ropes and Cordages (in Crore) 669 1037<br />
Source: <strong>Industry</strong> survey, Garware Wall Ropes Ltd. IMaCS Analysis<br />
The potential market for ropes and cordages industry in 2012-13 is estimated at Rs.1037 crore up<br />
from Rs. 669 crore in 2007-08 (E). In volume terms, the usage <strong>of</strong> ropes and cordages in the industry is<br />
expected to grow from 115371 MT in 2007-08 to 170066 in 2012-13. The growth the industry is<br />
assumed to be 14% over the next five years for organised sector and 7% for the unorganised sector.<br />
Imports and Exports<br />
The import figures for synthetic ropes and cordages are as given below:<br />
HS Code Description Imports (in Rs Crore) Imports (Quantity)<br />
2005-<br />
06<br />
2006-<br />
07<br />
2007-<br />
08(E)<br />
Unit 2005-<br />
06<br />
2006-<br />
07<br />
2007-<br />
08(E)
56074900<br />
56079090<br />
56081900<br />
56089090<br />
OTHR CORDGE ETC OF<br />
POLYETHLN/POLYPROPYLN<br />
OTHER TWINE,CORDAGE,ROPE &<br />
CABLES<br />
OTHER KNOTTED NETTING OF<br />
TWINE,CORDAGE OR ROPE OF<br />
MAN-MADE TEXTILE<br />
MATERIALS<br />
OTHER TWINE,CORDAGE/ROPE<br />
47 86 116 MT 28 35 38<br />
11 11 47 MT 470 608 9909<br />
1.5 2 2 MT 82 105 94<br />
0.75 3.2 0.67 MT 64 100 43<br />
Total 60.25 102.2 165.67 MT 644 848 10084<br />
The export figures for synthetic ropes and cordages are as given below:<br />
Source: DGCIS, IMaCS Analysis<br />
HS Code Description Exports (in Rs Crore) Exports (Quantity)<br />
56074900<br />
56079090<br />
56081900<br />
56089090<br />
OTHR CORDGE ETC OF<br />
POLYETHLN/POLYPROPYLN<br />
OTHER TWINE,CORDAGE,ROPE &<br />
CABLES<br />
OTHER KNOTTED NETTING OF<br />
TWINE,CORDAGE OR ROPE OF<br />
MAN-MADE TEXTILE<br />
MATERIALS<br />
OTHER TWINE,CORDAGE/ROPE<br />
2005-<br />
06<br />
2006-<br />
07<br />
2007-<br />
08(E)<br />
Unit 2005-<br />
06<br />
2006-<br />
07<br />
2007-<br />
08(E)<br />
56 90 153 MT 6523 11429 17679<br />
11 19 7 MT 1178 1735 911<br />
21 6 33 MT 2403 281 1839<br />
34 15 7 MT 1345 613 627<br />
Total 122 130 200 MT 11449 14058 21056<br />
Source: DGCIS, IMaCS Analysis<br />
The imports <strong>of</strong> ropes and cordages industry are small compared to the exports. The exports are<br />
distributed amongst 80 countries lead by USA, Norway and Indonesia with 11-13% share each. China<br />
is a major importer with around 23% <strong>of</strong> Indian cordage import; however China also receives around<br />
8% <strong>of</strong> Indian cordage exports. These exports for the year 2012-13 are estimated to be Rs 402.3 crore.<br />
Key machinery suppliers<br />
The key machinery employed in manufacture <strong>of</strong> synthetic ropes is given below:<br />
• Extrusion<br />
o J P Industries<br />
o Lohia Starlinger<br />
o Kabra Machines<br />
• Twisting and Winding
o JMW, Coimbatore<br />
Quality Control and Standards<br />
There are no Indian standards.
Filtration products<br />
Key application areas <strong>of</strong> filtration products<br />
The broad classification based on applications is given below:-<br />
• Industrial filters<br />
Industrial filters include vacuum filters, pressure filters, and dust collection equipment like<br />
bag filters etc used in industries like Cement, Pharma, Fertilizer, Food Processing and other<br />
process industries<br />
• Automotive filters<br />
Automotive filters are primarily <strong>of</strong> three types - Oil filter, Air filter and Fuel filter. The filters<br />
clean the oil, air and fuel by blocking dirt and other unwanted particles from entering the<br />
vehicle system. The <strong>technical</strong> textile used in the filters is cellulose and polyester non-woven<br />
filter paper.<br />
Product characteristics<br />
The filtration products can be classified into two major categories.<br />
• Liquid solid separation<br />
• Air-solid separation.<br />
The filter media used for Air-solid separation is primarily non woven fabric whereas Liquid solid<br />
separation involves woven filter media.<br />
Fabric type<br />
WEIGHT<br />
/ SQ.<br />
MTR.<br />
Woven Filter Media<br />
TENSILE STRENGTH<br />
(KGS.)<br />
AIR<br />
PERMEABILITY<br />
WARP WEFT (CU.FT/SEC)<br />
Polypropylene spun<br />
fabric<br />
Polypropylene<br />
280 - 650 200 - 426 140 - 350 0.97 - 0.20<br />
Multi filament fabric 275 - 450 295 - 500 145 - 400 0.5 - 0.13<br />
Polyester spun fabric 360 - 670 325 - 600 250 - 308 0.20 - 0.109<br />
Nylon filament fabric 330 - 450 310 - 548 275 - 414 0.60 - 0.23<br />
Cotton fabric 400 - 830 135 - 320 110 - 225 0.30 - 0.08
Non Woven Filter<br />
Media<br />
Weight<br />
(GSM)<br />
Thickness<br />
(Mm)<br />
Breaking*<br />
Strength (Kgf)<br />
Bursting<br />
Strength<br />
(Kg/Cm²)<br />
Max.<br />
Temp. (Cº)<br />
Air<br />
Permeability**<br />
Polyester &<br />
Polyester 300 – 550 1.7 - 2.3 30 - 70 15 - 30 150 160 - 750<br />
Polypropylene &<br />
Polypropylene 400 – 700 1.8 - 3.0 70 - 150 30 - 40 90 100 - 200<br />
Polyester - Acrylic<br />
& Polyester 500 202 70 30 120 200<br />
Polyester - Viscose 220 1.8 16 4 130 550<br />
Product characteristics <strong>of</strong> automotive filters<br />
The characteristics <strong>of</strong> the filter are based on the specification <strong>of</strong> the original equipment manufacturers:<br />
permeability, corrugation depth, bursting strength, pore size, volatile content, resin content and width<br />
and height. All the three filters are required for proper functioning <strong>of</strong> internal combustion engine. The<br />
<strong>technical</strong> textile used in the filters is polyester and cellulose non-woven fabric <strong>of</strong> around 120-150<br />
GSM.<br />
Market Dynamics and key growth drivers<br />
The primary growth driver for automobile filters is the automotive industry (including the<br />
replacement market).<br />
The key end users for industrial filters are Cement, Pharmaceuticals, Fertilizer, Food Processing,<br />
Power and Engineering sectors. The demand <strong>of</strong> filter equipments and filter media is driven by the<br />
performance <strong>of</strong> these sectors. The filter media has a higher proportion <strong>of</strong> replacement demand<br />
compared to the filtration equipments. The increasing emphasis on pollution control and occupational<br />
health augur well for the industry.<br />
Key manufacturer <strong>of</strong> automotive filtration medium<br />
There are only few organised big players in the filter fabrics industry. However, there are large<br />
number <strong>of</strong> small companies which manufacture filter fabric from viscose, polypropylene and<br />
polyester. The major players in the automotive filter market are Purolator India Limited, John Fowler<br />
Filters (India) Pvt. Limited and Roots India. Mahle-Purolator Filters is the biggest automobile filter<br />
manufacturer in India. The Filter Paper Impregnation facility, located close to the filter manufacturing<br />
plant at Khandsa, is the largest <strong>of</strong> its kind in India. The unit produces close to 3600 MT <strong>of</strong> filter paper.<br />
The unit was setup primarily to replace imports and promote the indigenous manufacture <strong>of</strong> filter<br />
paper.
Polymer Paper Limited is another filter paper manufacturing company with own base paper and<br />
impregnation plant. The capacity <strong>of</strong> filter paper is around 800 tonnes and production 676 tonnes<br />
(2006). The other filtration media line has capacity <strong>of</strong> 1200 tonnes and production <strong>of</strong> 818 tonnes.<br />
There are not many other organised large players in the automotive filter fabrics industry, however,<br />
there are large number <strong>of</strong> small companies which manufacture filter fabric from viscose,<br />
polypropylene and polyester.<br />
Key manufacturers <strong>of</strong> industrial filter Media<br />
Most <strong>of</strong> the filter fabric manufacturers are SSI units and concentrated in the states <strong>of</strong> Gujarat, Madhya<br />
Pradesh and Maharashtra.<br />
Khosla Pr<strong>of</strong>il is one <strong>of</strong> the key players in this industry manufacturing filter fabrics - Spun, Multi-<br />
Filament & Mon<strong>of</strong>ilament from Polypropylene, Polyester, Nylon, Cotton, Poly/Cotton, Stainless steel,<br />
Carbon etc. with manufacturing widths up to 3.6 mts wide and jointless rolls upto 2000 mtrs. Khosla<br />
Pr<strong>of</strong>il has developed special dust collection non-woven filter bags.<br />
Company Year Units Production Capacity<br />
Shri Dinesh Mills Limited 2005-06 MT 179 -<br />
Biyani Industrial Textiles<br />
Pvt. Ltd. 2007-08 Lakh metres 2.4 -<br />
Travancore Fibres Pvt. Ltd. 2007-08 Lakh metres - 5.4<br />
Jyoti Overseas Ltd 2007-08 Lakh metres - 240<br />
Bimtex Fabrics 2005-06 Lakh metres 1.9 -<br />
Kabeer Cotton Mills (P) Ltd. 2005-06 Lakh metres 0.26 -<br />
Hi-Tech Speciality Fabrics<br />
Pvt. Ltd. 2005-06 Lakh metres 2 -<br />
Ruchi Cottex 2005-06 Lakh metres 1.49 -<br />
Filtech Fabrics 2005-06 Lakh metres 0.97 -<br />
Quality Fabrics 2005-06 Lakh metres 1.24 -<br />
MechTech Industries* 2007-08 MT 42 -<br />
Charminar Non-wovens** 2007-08 Lakh metres 1 -<br />
Muth Texfilters Ltd. 2007-08 Pieces 20000 -<br />
Puromatic Filters Pvt.Ltd 2007-08 Lakhs <strong>of</strong> Pieces 5.5 -<br />
Masterlal Pvt Ltd 2007-08 Lakhs <strong>of</strong> Pieces 0.9 -<br />
Natural Canvas & Co. 2007-08 Lakhs <strong>of</strong> Pieces 0.5 -<br />
Jay Engineering 2007-08 MT 6 -<br />
N.K Fliter Fabric Pvt.Ltd 2007-08 Lakh metres 18 -<br />
Pure Filter System 2007-08 Lakhs <strong>of</strong> Pieces 15 -<br />
Source: <strong>Industry</strong> Survey, IMaCS Analysis<br />
*MechTech Industries are authorized dealers <strong>of</strong> Supreme non-woven Pvt Ltd.<br />
**Includes products other than filtration<br />
Market size and future forecast for filter media
The current and future forecast <strong>of</strong> filter media domestic usage is given below:-<br />
Filter media<br />
<strong>Domestic</strong> usage<br />
2007-08 2012-13<br />
Filter media Value Rs 88 crore Rs 113 crore<br />
Source: <strong>Industry</strong> survey, IMaCS Analysis<br />
The domestic <strong>consumption</strong> <strong>of</strong> filter media is estimated as Rs 88 crore in 2007-08. The demand for<br />
these products is estimated to increase at a CAGR <strong>of</strong> around 5% and the market in 2012-13 is<br />
estimated to be Rs 113 crore.<br />
Market size <strong>of</strong> automotive filter paper in India<br />
The market for automotive filters is driven by growth in automobile production and increase in<br />
vehicles on- road. The replacement frequency for four wheelers is assumed as twice for air filters,<br />
thrice for oil filters and once for fuel filter (all per annum) and once in four years for two-wheelers.<br />
The average usage <strong>of</strong> non-woven fabric in air filter is around ~42.5 grams, ~100 grams in oil filter and<br />
~50 grams in fuel filter.<br />
The current and future forecast <strong>of</strong> automotive filter media domestic usage is given below:-<br />
Automotive Filters<br />
<strong>Domestic</strong> usage<br />
2007-08 2012-13<br />
Quantity 5,300 MT 12,500 MT<br />
Value Rs 54 crore Rs 130 crore<br />
Source: <strong>Industry</strong> survey, IMaCS Analysis<br />
The potential market for automotive filter in 2012-13 is estimated at Rs. 132 crore up from Rs. 54<br />
crore in 2007-08 (E). In volume terms, the usage <strong>of</strong> non-woven filter medium in the industry is<br />
expected to grow from 5,300 MT in 2007-08 to 12,500 in 2012-13.<br />
Imports and Exports <strong>of</strong> filter media<br />
The import details for filter media are given in the following table.<br />
HS Code Description<br />
Value (In<br />
Rs crore)<br />
Imports<br />
(Quantity)
59119090,<br />
59111000,<br />
59112000,<br />
59113190<br />
Filter<br />
Media<br />
2007-08(E) 2007-08(E)<br />
Rs 60 crore<br />
3.5-4 million sq<br />
m<br />
Source: IBIS, IMaCS Analysis<br />
Most <strong>of</strong> the imports <strong>of</strong> Filter media are from Switzerland, Germany, USA and China. Sefar Filtration<br />
(India) Pvt. Ltd is the one <strong>of</strong> the key importers <strong>of</strong> Sefar Brand <strong>of</strong> filter products. The company<br />
is located in Thane (Maharashtra).<br />
The export details for filter media are given in the following table<br />
HS Code Description<br />
59119090,<br />
59111000,<br />
59112000,<br />
59113190<br />
The automotive filter media is primarily exported to UAE.<br />
Key machinery used<br />
Value Exports<br />
(In Rs crore) (Quantity)<br />
2007-08(E) 2007-08(E)<br />
Filter<br />
Around 0.1<br />
Media Rs 4 crore million sq m<br />
Source: IBIS, IMaCS Analysis<br />
The machinery used for processing paper into filter paper is given below:<br />
1. Filter paper impregnation machine<br />
2. Pleating machine – Blade/Rotary type<br />
3. Perforation machine<br />
4. Curing machine<br />
The machinery suppliers in India are:<br />
1. Polymer Papers Limited, New Delhi<br />
2. Dashmaesh International, New Delhi<br />
3. Kanwal Enterprises – GT Element Manufacturing, Gurgaon
Raw materials<br />
The raw material characteristics are given in the following table.<br />
Basic Raw<br />
Material<br />
Recommended<br />
Operational<br />
Temp.(Cº)<br />
Tensile<br />
Properties<br />
Poly-<br />
Propylene<br />
Polyester<br />
Acrylonitrile<br />
(Co-Polymeric &<br />
Homopolymeric)<br />
Ryton(Poly-<br />
Phenylene-<br />
Sulphide)<br />
Nomex<br />
(Poly-Aramid)<br />
80 - 100 120 - 150 100 – 160 170 - 190 190 - 204<br />
Good Good Moderate Good Good<br />
Resistance<br />
Abrasion Excellent Good Moderate Good Good<br />
Acid Excellent Excellent Good Excellent Fair<br />
Alkali Excellent Poor Good Excellent Fair<br />
To Hydrolysis<br />
[Presence Of<br />
Strong Acid, Sox,<br />
Alkali &<br />
Oxidizing Agent]<br />
Applications<br />
With<br />
Moisture<br />
Liquid<br />
Filtrations<br />
Moderately<br />
With<br />
Moisture At<br />
High<br />
Temperature.<br />
Cement,<br />
Coal Mills,<br />
Fertilizer,<br />
Asbestos,<br />
Etc<br />
Industries.<br />
With Moisture &<br />
Temperature.<br />
Cement, Coal<br />
Mills, Fertilizer,<br />
Asbestos, Etc<br />
Industries.<br />
Unaffected<br />
Even With<br />
Moisture &<br />
Temperature<br />
Kilns, Boilers<br />
Of Different<br />
Industries.<br />
The filtration media manufactured in India is predominantly manufactured in the woven form. The<br />
non woven filtration media is manufactured by needle punching process.<br />
Quality Control and standards in India<br />
The relevant BIS standards are given below.<br />
BIS Standard Description<br />
IS 1178 : 1986 Cotton filter cloth<br />
IS 5036 : 1969<br />
Specification for Filter Presses, Recessed Plate<br />
Type, and Plate and Frame Type<br />
IS 5675 : 1987 Specification for Rotary-disc Vacuum Filters<br />
IS 8577 : 1977 Purchaser's data sheet for rotary vacuum filters<br />
IS 9540 : 1980 Purchaser's data sheet for plate and frame filters<br />
IS 11492 : 1985<br />
Specification for Rotary Vacuum Filter Screens<br />
for Sugar <strong>Industry</strong><br />
With<br />
Substantial<br />
Moisture &<br />
Typical<br />
Temperature<br />
Critical & Fine<br />
Gas Filtration,<br />
Kilns, Boilers<br />
Of Different<br />
Industries
BIS Standard Description<br />
IS 11574 : 1986 Specification for Polyamide Filter Cloth<br />
IS 11575 : 1986 Specification for Polyester Filter Cloth<br />
IS 12020 : Part 1 :<br />
1987<br />
Specification for Polypropylene Filter Cloth -<br />
Part 1 : Filter Cloth from Spun Polypropylene<br />
Yarn