No 3 - Polish Journal of Microbiology
No 3 - Polish Journal of Microbiology
No 3 - Polish Journal of Microbiology

Create successful ePaper yourself
Turn your PDF publications into a flip-book with our unique Google optimized e-Paper software.
218<br />
Run<br />
predicted response <strong>of</strong> L-asparaginase production G, J,<br />
F and L are the coded values <strong>of</strong> asparagine, tryptone,<br />
dextrose and NaCl respectively. For the production <strong>of</strong><br />
this L-asparaginase enzyme there is the need for the<br />
presence <strong>of</strong> carbon source, nitrogen source and also<br />
small amount <strong>of</strong> mineral nutrients for the remarkable<br />
production <strong>of</strong> the enzyme particularly on the large scale<br />
production.<br />
The analysis <strong>of</strong> variance <strong>of</strong> the quadratic regression<br />
model suggested that the model is very significant as<br />
was evident from the Fisher’s F-test (Table IV). The<br />
model’s goodness to fit was checked by determination<br />
coefficient (R 2 ). In the case, the value <strong>of</strong> R 2 (0.84) closer<br />
to 1 denotes better correlation between the observed<br />
Usha R. et al. 3<br />
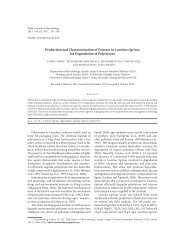
Table IV<br />
Experimental plan for optimization <strong>of</strong> L-asparaginase production using central composite design<br />
A: Asparagine<br />
%<br />
B: Tryptone<br />
%<br />
C: Dextrose<br />
%<br />
D: NaCl<br />
%<br />
L-asparaginase U/mL<br />
Experimental Predicted<br />
1 0.03 1.25 3 0.525 55 53<br />
2 0.03 1.25 –1 0.525 21 22<br />
3 0.03 –0.25 3 0.525 37 37<br />
4 0.05 0.5 5 0.05 135 132<br />
5 0.05 2 1 0.05 38 37<br />
6 0.03 2.75 3 0.525 48 44<br />
7 0.05 0.5 5 1 121 119<br />
8 0.01 2 1 1 21 19<br />
9 0.05 2 1 1 87 89<br />
10 0.05 2 5 1 54 52<br />
11 0.01 0.5 1 0.05 34 33<br />
12 –0.01 1.25 3 0.525 12 10<br />
13 0.05 0.5 1 0.05 67 67<br />
14 0.07 1.25 3 0.525 59 54<br />
15 0.05 0.5 1 1 54 54<br />
16 0.03 1.25 3 –0.425 65 67<br />
17 0.01 0.5 5 0.05 32 31<br />
18 0.03 1.25 3 0.525 129 130<br />
19 0.03 1.25 3 0.525 124 125<br />
20 0.03 1.25 3 0.525 130 128<br />
21 0.03 1.25 3 1.475 87 86<br />
22 0.01 2 5 1 22 21<br />
23 0.03 1.25 7 0.525 89 88<br />
24 0.01 2 1 0.05 37 35<br />
25 0.01 2 5 0.05 42 40<br />
26 0.01 0.5 1 1 36 35<br />
27 0.03 1.25 3 0.525 125 121<br />
28 0.03 1.25 3 0.525 131 134<br />
29 0.05 2 5 0.05 75 74<br />
30 0.01 0.5 5 1 41 43<br />
and predicted responses. The coefficient <strong>of</strong> variation<br />
(CV) indicates the degree <strong>of</strong> precision with which the<br />
experiments are compared. The lower reliability <strong>of</strong> the<br />
experiment is usually indicated by high value <strong>of</strong> CV<br />
(4.06) denotes that the experiments performed are<br />
highly reliable. The p value denotes the significance<br />
<strong>of</strong> the coefficient and also important in understanding<br />
the pattern <strong>of</strong> the mutual interactions between the<br />
variables.<br />
The fitted responses for the above regression model<br />
were plotted in Figure 3. 3D graphs were generated for<br />
the pair wise combination <strong>of</strong> four factors for L-asparaginase<br />
production. Graphs highlight the roles played<br />
by various factors affecting L-asparaginase production.