No 3 - Polish Journal of Microbiology
No 3 - Polish Journal of Microbiology
No 3 - Polish Journal of Microbiology

Create successful ePaper yourself
Turn your PDF publications into a flip-book with our unique Google optimized e-Paper software.
POLSKIE TOWARZYSTWO MIKROBIOLOGÓW<br />
POLISH SOCIETY OF MICROBIOLOGISTS<br />
<strong>Polish</strong> <strong>Journal</strong> <strong>of</strong> <strong>Microbiology</strong><br />
I am pleased to inform you that <strong>Polish</strong> <strong>Journal</strong> <strong>of</strong> <strong>Microbiology</strong> has been selected<br />
for coverage in Thomson Scientific products and customers information services.<br />
Beginning with <strong>No</strong> 1, Vol. 57, 2008 information on the contents <strong>of</strong> the PJM is<br />
included in: Science Citation Index Expanded (ISI) and <strong>Journal</strong> Citation Reports<br />
(JCR)/Science Edition.<br />
Stanisława Tylewska-Wierzbanowska<br />
Editor in Chief<br />
2011
<strong>Polish</strong> <strong>Journal</strong> <strong>of</strong> <strong>Microbiology</strong><br />
formely Acta Microbiologica Polonica<br />
2011, Vol. 60, <strong>No</strong> 3<br />
MINIREWIEV<br />
CONTENTS<br />
An update on some structural aspects <strong>of</strong> the mighty miniwall<br />
MARKIEWICZ Z., POPOWSKA M. ......................................................................................... 181<br />
ORIGINAL PAPERS<br />
A new rapid and cost-effective method for detection <strong>of</strong> phages, ICEs and virulence factors encoded by Streptococcus pyogenes<br />
BOREK A.L.,WILEMSKA J., IZdEBSKI R., HRYNIEWICZ W., SITKIEWICZ I. ......... ....................................... 187<br />
Expression <strong>of</strong> Helicobacter pylori ggt gene in baculovirus expression system and activity analysis <strong>of</strong> its products<br />
MEI KONG, MING xU, YA-LONG HE, YOU-LI ZHANG ..................................................................... 203<br />
Extracellular xylanase production by Fusarium species in solid state fermentation<br />
ARABI M.I.E., BAKRI Y., JAWHAR M. ...................................................................................... 209<br />
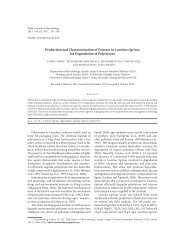
Screening <strong>of</strong> Actinomycetes from mangrove ecosystem for L-asparaginase activity<br />
and optimization by response surface methodology<br />
USHA R., MALA K.K., VENIL C.K., PALANISWAMY M. ..................................................................... 213<br />
Chitin-glucan complex production by Schizophyllum commune submerged cultivation<br />
SMIRNOU d., KRCMAR M., PROCHAZKOVA E. ........................................................................... 223<br />
Inhibition <strong>of</strong> lactophage activity by quinolinilporphyrin and its zinc complex<br />
VOdZINSKA N., GALKIN B., ISHKOV Y., KIRICHENKO A., KONdRATYUK A., FILIPOVA T. ................................ 229<br />
A two-step strategy for molecular typing <strong>of</strong> multidrug-resistant Mycobacterium tuberculosis clinical isolates from Poland<br />
JAGIELSKI T., AUGUSTYNOWICZ-KOPEć E., PAWLIK K., dZIAdEK J., ZWOLSKA Z., BIELECKI J. .......................... 233<br />
A comparative study on the activity and antigenicity <strong>of</strong> truncated and full-length forms <strong>of</strong> streptokinase<br />
ARABI R., ROOHVANd F., NOROUZIAN d., SARdARI S., AGHASAdEGHI M.R., KHANAHMAd H.,<br />
MEMARNEJAdIAN A., MONTEVALLI F. ................................................................................... 243<br />
Infections caused by RSV among children and adults during two epidemic seasons<br />
PANCER K., CIąćKA A., GUT W., LIPKA B., MIERZEJEWSKA J., MILEWSKA-BOBULA B., SMORCZEWSKA-KILJAN A.,<br />
JAHNZ-RÓżYK K., dZIERżANOWSKA d., MAdALIńSKI K., LITWIńSKA B. ................................................ 253<br />
detection <strong>of</strong> Giardia intestinalis assemblages A, B and d in domestic cats from Warsaw, Poland<br />
JAROS d., ZYGNER W., JAROS S., WędRYCHOWICZ H. .................................................................... 259<br />
SHORT COMMUNICATIONS<br />
Evaluation <strong>of</strong> a rapid culture-based screening test for detection <strong>of</strong> methicillin resistant Staphylococcus aureus<br />
FWITY B., LOBMANN R., AMBROSCH A. .................................................................................. 265<br />
Inhibition <strong>of</strong> fibroblast apoptosis by Borrrelia afzelii, Coxiella burnetii and Bartonella henselae<br />
CHMIELEWSKI T., TYLEWSKA-WIERZBANOWSKA S. ............................................................................ 269<br />
LETTER TO THE EdITOR ......................................................................................................... 273<br />
INSTRUCTIONS TO AUTHORS ANd FULL TExT ARTICLES (IN PdF FORM) AVAILABLE AT:<br />
www.microbiology.pl/pjm
<strong>Polish</strong> <strong>Journal</strong> <strong>of</strong> <strong>Microbiology</strong><br />
2011, Vol. 60, <strong>No</strong> 3, 181–186<br />
MINIREVIEW<br />
An Update on Some Structural Aspects <strong>of</strong> the Mighty Miniwall<br />
In 1884 Christian Gram devised a staining procedure<br />
that allowed classifying almost all bacteria to one<br />
<strong>of</strong> two groups, the Gram-positive and Gram-negative<br />
bacteria. The simple staining procedure is still widely<br />
used almost 130 years later, with practically all bacteria<br />
being classified to one group or the other. However, it<br />
was not until many years after Gram’s invention that<br />
light was shed on the complexity <strong>of</strong> bacterial cell envelopes<br />
and the structures forming them. Studies <strong>of</strong> bacterial<br />
cell surfaces began in earnest in the 1950s and<br />
1960s, following the isolation by Park and Johnston<br />
(1949) <strong>of</strong> what were later found to be cell wall PG precursors<br />
and the purification <strong>of</strong> bacterial cell walls by e.g.<br />
Salton (1952, 1957) and Work (1957). The term “microdermatology”<br />
was coined. It was found that all bacteria,<br />
except for some notable exceptions, i.e. mycoplasmas,<br />
Planctomyces and Orientia tsutsugamushi contain<br />
peptidoglycan (PG, syn. murein). PG has never been<br />
found in chlamydia either, although the bacteria have<br />
a functional pathway for meso-diaminopimelate, one <strong>of</strong><br />
the unique structural building bricks <strong>of</strong> the macromolecule<br />
(Pavelka, 2007). More recently, an interesting new<br />
phylum <strong>of</strong> PG-free bacteria, the Verrucomicrobia, has<br />
been established (Yoon et al., 2010).<br />
There has been a resurgence in studies on PG in the<br />
past few years fired, amongst others, by the increased<br />
prevalence <strong>of</strong> antibiotic resistance among bacteria<br />
that cause life-threatening infections and the need to<br />
find new agents that inhibit bacterial cell-wall biosynthesis<br />
(Bugg et al., 2011); the interaction <strong>of</strong> PG with<br />
innate immunity proteins (PG Recognition Proteins,<br />
ZdZISŁAW MARKIEWICZ* and MAGdALENA POPOWSKA<br />
department <strong>of</strong> Applied <strong>Microbiology</strong>, Institute <strong>of</strong> <strong>Microbiology</strong>, Poland<br />
Received 15 July 2011, accepted 30 July 2011<br />
Abstract<br />
Peptidoglycan (PG), the mighty miniwall, is the main structural component <strong>of</strong> practically all bacterial cell envelopes and has been the<br />
subject <strong>of</strong> a wealth <strong>of</strong> research over the past 60 years, if only because its biosynthesis is the target <strong>of</strong> many antibiotics that have successfully<br />
been used in the treatment <strong>of</strong> bacterial infections. This review is mainly focused on the most recent achievements in research on the<br />
modification <strong>of</strong> PG glycan strands, which contribute to the resistance <strong>of</strong> bacteria to the host immune response to infection and to their<br />
own lytic enzymes, and on studies on the spatial organization <strong>of</strong> the macromolecule.<br />
K e y w o r d s: glycan strands, N-acetylglucosamine (GlcNAc) and N-acetylmuramic acid (MurNAc) modifications,<br />
peptidoglycan (PG), spatial organization<br />
* Corresponding author: Z. Markiewicz; e-mail: markiez@biol.uw.edu.pl<br />
PGRPs or PGLYRPs) that are conserved from insects<br />
to animals and the mechanisms that lead to bacterial<br />
cell death (dziarski and Gupta, 2010; Kietzman and<br />
Tuomanen, 2011); last but not least, the role <strong>of</strong> d-amino<br />
acids, which are a universal component <strong>of</strong> PG, in nature<br />
(Cava et al., 2011).<br />
The main structure <strong>of</strong> PG involves linear glycan<br />
strands cross-linked by short peptides. “<strong>No</strong>rmal”, that<br />
is unaltered, glycan chains, have universally been found<br />
to be composed <strong>of</strong> alternating N-acetylglucosamine<br />
(GlcNAc) and N-acetylmuramic acid (MurNAc) residues<br />
linked by β-1 → 4 bonds. The d-lactoyl group <strong>of</strong><br />
each MurNAc residue is substituted by a peptide stem<br />
whose composition is most <strong>of</strong>ten L-Ala-γ-d-Glu-meso-<br />
A2pm (or L-Lys)-d-Ala-d-Ala in nascent PG, the last<br />
d-Ala residue being lost in the mature macromolecule.<br />
Cross-linking <strong>of</strong> the glycan strands generally occurs<br />
between the carboxyl group <strong>of</strong> d-Ala at position 4 and<br />
the amino group <strong>of</strong> the diamino acid at position 3,<br />
either directly or through a short peptide bridge. The<br />
unique chemical traits <strong>of</strong> PG thus include the presence<br />
<strong>of</strong> N-acetylmuramic acid, γ-bonded d-Glu, L-d<br />
(and even d-d) bonds and non-protein amino acids,<br />
e.g. 2,6-diaminopimelic acid (A2pm) (e.g. Cummins,<br />
1956; Work, 1957, 1961, 1969; Rogers, 1974; Glauner,<br />
1988; Höltje and Glauner, 1990; Markiewicz et al., 1983;<br />
Markiewicz, 1993; Vollmer et al., 2011). These structural<br />
features are basically retained in all bacteria, though<br />
many differences in the glycan strands, composition<br />
<strong>of</strong> the stem peptide and/or interpeptide bridge are<br />
known and are taken into account in the tri-digital
182<br />
PG classification system established by Schleifer and<br />
Kandler (1972). In some cases the differences may<br />
be quite extreme like, for example, the occurrence <strong>of</strong><br />
mostly (75%) A2pm → A2pm (i.e. 3 → 3) crosslinks in<br />
Clostridium difficile PG (Peltier et al., 2011)<br />
Variations in the structure <strong>of</strong> the glycan strands <strong>of</strong><br />
PG have recently been elegantly reviewed by Vollmer<br />
(2008). A review by davis and Weiser (2011) focuses<br />
specifically on the role <strong>of</strong> peptidoglycan modifications<br />
and their effects on the host immune response to infection.<br />
A unique modification <strong>of</strong> glycan strands is the<br />
presence <strong>of</strong> muramic δ-lactam, which occurs e.g. in<br />
the thick PG <strong>of</strong> Bacillus sp. and Clostridium sporogenes<br />
endospores. In Bacillus subtilis approximately every<br />
second MurNAc residue along the glycan strands is<br />
modified to muramic δ-lactam. The modification<br />
<strong>of</strong> MurNAc involves the action <strong>of</strong> two enzymes, the<br />
MurNAc deacetylase PdaA and the amidase Cwld.<br />
Studies with mutants lacking these enzymes have shown<br />
that intact endospores are formed but that the spores<br />
are not able to germinate since unmodified spore PG<br />
is not recognized by germination-specific hydrolases<br />
(Popham et al., 1996, Atrih and Foster, 2001; Gilmore<br />
et al., 2004). More recently, it has been demonstrated<br />
that in Bacillus anthracis germination is mediated<br />
by the action <strong>of</strong> germination-specific lytic enzymes<br />
(GSLEs), one <strong>of</strong> which is SleB. SleB functions independently<br />
as a lytic transglycosylase on both intact and<br />
fragmented cortex. Most <strong>of</strong> the muropeptide products<br />
that SleB generates are large and are potential substrates<br />
for other GSLEs present in the spore, such as a glucosaminidase<br />
that cleaves between N-acetylglucosamine<br />
and muramic-δ-lactam. SleB has two domains, the<br />
N-terminal domain is required for stable PG binding,<br />
while the C-terminal domain is the region <strong>of</strong> PG hydrolytic<br />
activity, which is dependent on cortex containing<br />
muramic-δ-lactam in order to carry out hydrolysis<br />
(dowd et al., 2008; Heffron et al., 2011).<br />
PdaA, mentioned above, is an example <strong>of</strong> several<br />
N-deacetylases found in different Gram-positive bacteria,<br />
which carry out the N-deacetylation <strong>of</strong> MurNAc or<br />
GlcNAc (or both) in polymerized PG. N-deacetylation<br />
<strong>of</strong> MurNAc was found to protect bacterial cell walls from<br />
degradation by lysozyme, an important factor <strong>of</strong> the<br />
innate immune system (Araki et al., 1971). These enzy-<br />
mes, which have a predicted extracytoplasmic location<br />
in the cell, have been thoroughly reviewed by Vollmer<br />
(2008). The N-deacetylase <strong>of</strong> Streptococcus pneumoniae<br />
(PgdA) has been shown to be a putative virulence factor<br />
(Vollmer and Tomasz, 2002). deacetylation <strong>of</strong> PG<br />
increases the positive charge <strong>of</strong> the cell wall, possibly<br />
contributing to protection <strong>of</strong> the pathogens against the<br />
binding <strong>of</strong> cationic antimicrobial peptides <strong>of</strong> the host<br />
organism. Similar observations were made more recently<br />
by Popowska et al. (2009) who found that a pgdA mutant<br />
Markiewicz Z. and Popowska M. 3<br />
<strong>of</strong> Listeria monocytogenes was more prone to autolysis<br />
and was more susceptible to cationic antimicrobial pep-<br />
tides, and by Meyrand et al. (2007) for Lactococcus lactis.<br />
In other studies, a mutant strain <strong>of</strong> L. monocytogenes<br />
lacking PdaA activity induced a massive IFN-beta response<br />
in a TLR2 and <strong>No</strong>d1-dependent manner and was<br />
rapidly destroyed within macrophage vacuoles (Boneca<br />
et al., 2007; Corr and O’Neill, 2009) and in bone-marrow<br />
derived macro phages, pgdA mutants <strong>of</strong> L. mono cytogenes<br />
demonstrated intracellular growth defects and<br />
increased induction <strong>of</strong> cytokine transcriptional respon-<br />
ses that emanated from a phagosome and the cytosol<br />
(Rae et al., 2011). In Streptococcus suis expression <strong>of</strong><br />
the pgdA gene was increased upon interaction <strong>of</strong> the<br />
bacterium with neutrophils in vitro as well as in vivo in<br />
experimentally inoculated mice, suggesting that S. suis<br />
may enhance PG N-deacetylation under these conditions.<br />
Evaluation <strong>of</strong> the pgdA mutant in both the Cd1<br />
murine and the porcine models <strong>of</strong> infection revealed<br />
a significant contribution <strong>of</strong> the pgdA gene to the<br />
virulence traits <strong>of</strong> S. suis (Fittipaldi et al., 2008). In an<br />
interesting study, it was found that neither PgdA inactivation<br />
nor PgdA overexpression in Lactobacillus lactis<br />
leading to different levels <strong>of</strong> PG deacetylation confers<br />
any advantage in the persistence <strong>of</strong> this bacterium in<br />
the gastrointestinal tract and its ability to enhance host<br />
immune responses (Watterlot et al., 2010). Bacterial<br />
N-deacetylases have been considered to be exported<br />
enzymes but it has recently been reported that some <strong>of</strong><br />
these enzymes may also be cytoplasmic, with a potential<br />
role in PG turnover and recycling (Popowska et al.,<br />
2011, for a very good review on turnover and recycling,<br />
see Reith and Mayer, 2011). A similar N-deacetylase<br />
lacking a signal peptide for secretion into the periplasmic<br />
space has been found in Helicobacter pylori (Shaik<br />
et al., 2011). The enzyme showed no in vitro activity on<br />
the typical polysaccharide substrates <strong>of</strong> peptidoglycan<br />
and results from crystallization and structure studies<br />
suggest that it binds a small molecule at the active site,<br />
even though the peptidoglycan <strong>of</strong> a HP0310 (syn. HpPgdA)<br />
knock-out mutant was characterized by higher<br />
degree <strong>of</strong> acetylation compared to the wild-type, along<br />
with increased susceptibility to lysozyme degradation.<br />
O-acetylation <strong>of</strong> MurNAc, similarly to N-deacetylation,<br />
is typically associated with bacterial resistance<br />
to lysozyme PG from degradation by lysozyme as well<br />
as by endogenous autolytic enzymes, e.g. the lytic transglycosylases.<br />
As a protective modification it is more<br />
ubiquitous than N-deacetylation and has been found to<br />
occur in many different bacterial species, both Grampositive<br />
and Gram-negative (Vollmer, 2008). An additional<br />
acetyl group is linked to the C6-OH <strong>of</strong> MurNAc<br />
to form a 2,6-N,O-diacetylo muramic acid residue. The<br />
ester bond <strong>of</strong> O-linked acetate is significantly weaker<br />
than the amide bond <strong>of</strong> N-linked acetate.
3 Structural aspects <strong>of</strong> the mighty miniwall<br />
183<br />
Two types <strong>of</strong> unrelated O-acetyltransferases have<br />
been described, corresponding to different mechanisms<br />
<strong>of</strong> peptidoglycan O-acetylation (Clarke et al., 2000; Bera<br />
et al., 2005, Crisostomo et al., 2006). The first mechanism<br />
involves a single protein (an OatA-type enzyme)<br />
which performs both the transport <strong>of</strong> acetate across the<br />
membrane and its transfer onto the peptidoglycan. The<br />
second mechanism involves two proteins, one for acetate<br />
transport across the membrane and the other for<br />
catalyzing its transfer to MurNAc. The acetate transport<br />
genes <strong>of</strong> this system are unknown. There are several<br />
candidate genes for these O-acetyltransferases (named<br />
Pat). A new peptidoglycan O-acetyltransferase has been<br />
found in E. coli. The enzyme, named PatB, O-acetylates<br />
peptidoglycan within the periplasm. This activity was<br />
found to be dependent upon a second protein, PatA,<br />
which functions to translocate acetate from the cytoplasm<br />
to the periplasm, demonstrating that the O-acetylation<br />
<strong>of</strong> peptidoglycan in Neisseria gonorrhoeae, and<br />
other Gram-negative bacteria, requires a two component<br />
system (Moynihan and Clarke, 2010).<br />
The O-acetyltransferase reaction is reversed by<br />
peptidoglycan O-acetyl esterase activity (Weadge et al.,<br />
2005; Vollmer, 2008). In Bacillus anthracis, in contrast<br />
to other bacteria, O-acetylation <strong>of</strong> peptidoglycan is<br />
combined with N-deacetylation to confer resistance<br />
<strong>of</strong> cells to lysozyme and is conferred by two unrelated<br />
O-acetyltransferases. Activity <strong>of</strong> the Pat O-acetyl-transferases<br />
is also required for the separation <strong>of</strong> the daughter<br />
cells following bacterial division and for anchoring <strong>of</strong><br />
one <strong>of</strong> the major S-layer proteins (Laaberki et al., 2011).<br />
Until very recently it was thought that only the<br />
MurNAc residues in the PG polymer can be O-acetyl ated.<br />
However, the presence <strong>of</strong> O-acetylation on N-acetyl-<br />
glucosamine (GlcNAc) in Lactobacillus plantarum PG<br />
has just been reported (Bernard et al., 2011). detailed<br />
structural characterization <strong>of</strong> acetylated muropeptides<br />
released from L. plantarum PG revealed that both<br />
MurNAc and GlcNAc are O-acetylated in this species.<br />
These two PG modifications are carried out by two<br />
dedicated O-acetyltransferases, OatA and OatB, respectively.<br />
Analysis <strong>of</strong> the resistance <strong>of</strong> mutant strains to cell<br />
wall hydrolysis demonstrated that GlcNAc O-acetylation<br />
inhibits the activity <strong>of</strong> the major L. plantarum<br />
autolysin, N-acetylglucosaminidase Acm2. In this bac-<br />
terial species, inactivation <strong>of</strong> oatA, encoding MurNAc<br />
O-acetyltransferase, resulted in marked sensitivity<br />
to lysozyme. Moreover, MurNAc over-O-acetylation<br />
was shown to activate autolysis through the putative<br />
N-acetylmuramoyl-l-alanine amidase LytH enzyme. In<br />
L. plantarum, two different O-acetyltransferases seem<br />
to play original and antagonistic roles in modulating<br />
the activity <strong>of</strong> endogenous autolysins.<br />
Another kind <strong>of</strong> modification <strong>of</strong> muramic acid<br />
occurs in the PG <strong>of</strong> most genera <strong>of</strong> the order Actinomy-<br />
cetales that contain mycolic acids, e.g. Mycobacterium<br />
sp. In these bacteria muramic acid is N-glycolylated<br />
and not N-acetylated, and this modification is introduced<br />
during the synthesis <strong>of</strong> UdP-linked PG precursors,<br />
specifically into the last cytoplasmic precursor,<br />
UdP-MurNAc-pentapeptide. The N-glycolylated form<br />
arises through the action <strong>of</strong> an N-acetyl muramic acid<br />
hydroxylase (NamH) (Raymond et al., 2005) present<br />
only in the Actinomycetales. The importance <strong>of</strong> glycolylation<br />
has been elusive, with a hypothesis proposed<br />
based on studies with M. smegmatis namH mutants that<br />
it may protect PG from the action <strong>of</strong> lysozyme. However,<br />
recent findings (Coulombe et al., 2009) identify<br />
N-glycolyl MdP (Peptidoglycan-derived Muramyl<br />
dipeptide) as more stimulatory than N-acetyl MdP<br />
at eliciting NOd2-mediated immune responses in the<br />
context <strong>of</strong> both an intact bacterium and as a pure compound,<br />
consistent with early observations attributing<br />
exceptional immunogenic activity to the mycobacterial<br />
cell wall. disruption <strong>of</strong> namH in M. smegmatis<br />
nulled NOd2-mediated TNF secretion, which could<br />
be restored upon gene complementation. In mouse<br />
macrophages, N-glycolyl MdP was more potent than<br />
N-acetyl MdP at activating RIP2, nuclear factor kappaB<br />
and proinflammatory cytokine secretion. Finally,<br />
N-glycolyl MdP was found to be more efficacious than<br />
N-acetyl MdP at inducing ovalbumin-specific T cell<br />
immunity in a model <strong>of</strong> adjuvancy (Coulombe et al.,<br />
2009; davis and Weiser, 2011).<br />
A different modification <strong>of</strong> the glycan strands that<br />
can be found in the PG <strong>of</strong> many Gram-negative bacteria,<br />
but also in some Gram-positive ones is the presence<br />
<strong>of</strong> a 1,6-anhydroMurNAc residue at the end <strong>of</strong> the<br />
chain. These are formed by the action <strong>of</strong> lytic transglycosylases<br />
(LTs), that have the same bond specificity<br />
as lysozyme (Höltje et al., 1975). These ubiquitous<br />
enzymes are classified to one <strong>of</strong> four distinct families,<br />
based on sequence similarities and identified consensus<br />
motifs (Blackburn and Clarke, 2001). The importance<br />
<strong>of</strong> these enzymes is reflected in the fact that the bacterium<br />
Escherichia coli has six <strong>of</strong> them, representing<br />
different families and subfamilies. LTs can be viewed as<br />
space-making enzymes. They cleave glycosydic bonds<br />
within the PG sacculus to allow for a number <strong>of</strong> different<br />
processes to occur. They play an important a critical<br />
role in the expansion <strong>of</strong> the sacculus and consequent<br />
cell growth by creating sites for the insertion <strong>of</strong> PG<br />
precursors (Höltje, 1998). They are also required for<br />
PG turnover and recycling. In concert with amidases<br />
LTs function to split the septum, thereby permitting the<br />
separation <strong>of</strong> dividing cells (Heidrich et al., 2002). LTs<br />
have also been suggested to contribute to pathogenesis<br />
(reviewed in Cloud-Hansen et al., 2006). An important<br />
question has always been how large structures, e.g. protein<br />
complexes, penetrate the PG layer (Scheurwater
184<br />
and Clarke, 2008). LTs have always been implicated in<br />
these processes. This topic has been very well reviewed<br />
by Scheurwater and Burrows (2011).<br />
Glycan strands <strong>of</strong> PG are also modified via the<br />
attachment <strong>of</strong> many different types <strong>of</strong> compounds and<br />
polymers to muramic acid, usually via a phosphodiester<br />
bond. The most notable <strong>of</strong> these are the teichoic and<br />
teichuronic acids as well as the arabinogalactans. Very<br />
rarely, structures are attached to GlcNAc, as in Streptococcus<br />
agalactiae. This topic is vast and well beyond the<br />
scope <strong>of</strong> this review.<br />
Even though the structure <strong>of</strong> PG and the various<br />
species-specific and function-determined modifications<br />
<strong>of</strong> its structural elements have been thoroughly<br />
investigated, there are still numerous unresolved fundamental<br />
questions regarding the architecture <strong>of</strong> the<br />
peptidoglycan, i.e. the orientation <strong>of</strong> the glycan strands<br />
and stem peptides in relation to the surface and axes <strong>of</strong><br />
a cell (Vollmer and Seligman, 2010). Various models<br />
for the spatial organization <strong>of</strong> peptidoglycan have been<br />
proposed over the years and currently two opposing<br />
models are considered: a model in which the glycan<br />
strands run parallel to the cytoplasmic membrane (the<br />
“classical” or “classical” model, e.g. Höltje, 1998; Pink<br />
et al., 2000) recently supported by experimental data<br />
by Gan et al. (2008) and Hayhurst et al. (2008) and<br />
the opposing “scaffold” model in which the glycan<br />
strands are oriented perpendicularly to the membrane<br />
(dmitriev et al., 2003, 2004, 2005; Meroueh et al., 2006).<br />
Unraveling the architectural issues is compounded<br />
by the differences <strong>of</strong> the thickness <strong>of</strong> PG in Gramnegative<br />
versus Gram-positive cells, which is approximately<br />
5–10 times thicker in the latter compared to<br />
the former and the fact that structure may be affected<br />
by i.e. growth conditions, gene activity (e.g. Höltje and<br />
Glauner, 1990; Vollmer et al., 2008; Korsak et al., 2005,<br />
2010; Cava et al., 2011), antibiotic production or resistance<br />
(Sieradzki and Markiewicz, 2004; Schaberle et al.,<br />
2011) and many other factors. Moreover, recent studies<br />
using cryo-transmission electron microscopy (cryo-EM)<br />
have conclusively demonstrated the existence <strong>of</strong> the<br />
equivalent <strong>of</strong> the Gram-negative periplasmic space in<br />
at least B. subtilis and Staphylococcus aureus (Matias and<br />
Beveridge, 2005; 2006), which also complicates interpretation<br />
in spatial structure studies. The technique<br />
reveals in Gram-positive bacteria two different cell<br />
wall layers: an inner wall zone (IWZ) <strong>of</strong> low-electron<br />
density, whose main component is lipoteichoic acid<br />
(Matias and Beveridge, 2008), and a high-electron<br />
density outer wall zone (OWZ). In the “layered” model<br />
the glycan strands are believed to run parallel to the<br />
plasma membrane, arranged as hoops or helices around<br />
the short axis <strong>of</strong> the cell, resulting in a woven fabriclike<br />
structure (Verwer et al., 1978; Vollmer and Höltje,<br />
2004; Vollmer et al., 2008). A recent study by Gan et al.<br />
(2008), in which frozen-hydrated sacculi from E. coli<br />
Markiewicz Z. and Popowska M. 3<br />
and Caulobacter crescentus were examined by electron<br />
cryotomography, confirmed the layered model, showing<br />
that in the Gram-negative PG sacculus a single layer<br />
<strong>of</strong> glycan strands lie parallel to the cell surface, roughly<br />
perpendicular to the long axis <strong>of</strong> the cell, encircling the<br />
cell in a disorganized hoop-like fashion. Their data also<br />
precluded the scaffold model. However, assuming that<br />
Gram-negative bacteria do have a single layer <strong>of</strong> PG, then<br />
how can one explain the difference in the thickness <strong>of</strong><br />
E. coli PG versus Pseudomonas aeruginosa PG (approximately<br />
2 : 1, respectively, for either dry or hydrated<br />
isolated sacculi (Vollmer and Seligman, 2010)? The<br />
organization <strong>of</strong> PG in ovococcoidal mutant Lactobacillus<br />
lactis cells lacking cell wall exopolysaccharides was<br />
studied using AFM (Atomic Force Microscopy) topographic<br />
and recognition imaging. Topographic images<br />
showed periodic ridges on the mutant surface that<br />
always ran parallel to the short cell axis. Recognition<br />
imaging demonstrated that these ridges consisted <strong>of</strong><br />
peptidoglycan. The results are consistent with a PG<br />
organization in the plane perpendicular to the long<br />
axis <strong>of</strong> the cell (Andre et al., 2010). It would thus seem<br />
that the 3-d architecture <strong>of</strong> PG in both Gram-negative<br />
and Gram-positive cells is <strong>of</strong> the layered type. However,<br />
observations <strong>of</strong> isolated Bacillus subtilis PG using AFM<br />
show that, at least in this species, spatial organization<br />
is more complex (Hayhurst et al., 2008). This may be<br />
related to the existence <strong>of</strong> the IWZ in B. subtilis (Matias<br />
and Beveridge, 2005; Zuber et al., 2006) and the finding<br />
that the glycan strands <strong>of</strong> the bacterium are longer<br />
50 times longer than previously calculated. The model<br />
<strong>of</strong> Hayhurst et al. (2008) proposes that during biosynthesis<br />
small numbers <strong>of</strong> glycan strands are polymerized<br />
and cross-linked to build a peptidoglycan “rope”, which<br />
is coiled into a helix to form inner surface cable structures.<br />
The nascent helix (cable) is inserted into the cell<br />
wall by cross-links between two existing cables and the<br />
overlying cable interface cleaved by autolysins known<br />
to be essential for cell growth. As part <strong>of</strong> cable maturation,<br />
the structure may become stabilized by inter/intra<br />
glycan strand cross-links. The model also predicts that<br />
the cell wall is likely only one intact cable thick with<br />
partially hydrolyzed cables also present externally. Solid-<br />
state NMR data obtained for Staphylococcus aureus PG,<br />
which contains an interpeptide pentaglycyl bridge, show<br />
that the spatial arrangement <strong>of</strong> the polymer in staphylococci<br />
may be even more complex. Partial charac-<br />
terization <strong>of</strong> the structure was achieved by measuring<br />
spin diffusion from (13) C labels in pentaglycyl crosslinking<br />
segments to natural-abundance (13) C in the<br />
surrounding intact cell walls. The measurements were<br />
performed using a version <strong>of</strong> Centerband-Only detection<br />
<strong>of</strong> Exchange (COdEx). The COdEx spin diffusion<br />
rates established that the pentaglycyl bridge <strong>of</strong> one<br />
peptidoglycan repeat unit <strong>of</strong> S. aureus is within 5 angstroms<br />
<strong>of</strong> the glycan chain <strong>of</strong> another repeat unit, which
3 Structural aspects <strong>of</strong> the mighty miniwall<br />
185<br />
shows surprising proximity compared to earlier theoretical<br />
considerations and was interpreted in terms <strong>of</strong><br />
a model for the peptidoglycan lattice in which all peptide<br />
stems in a plane perpendicular to the glycan main<br />
chain are parallel to one another (Sharif et al., 2009).<br />
This minireview reflects the most recent achievements<br />
in research on peptidoglycan, with focus on<br />
modifications <strong>of</strong> the glycan chains and the spatial organization<br />
<strong>of</strong> the polymer.<br />
Literature<br />
Andre G., S. Kulakauskas, M.P. Chapot-Chartier, B. Navet,<br />
M. Deghorain, E. Bernard, P. Hols and Y.F. Dufrêne. 2010. Imaging<br />
the nanoscale organization <strong>of</strong> peptidoglycan in living Lactococcus<br />
lactis cells. Nat. Commun. 1: 1–8.<br />
Araki Y., S. Fukuoka, S. Oba and E. Ito. 1971. Enzymatic deacetylation<br />
<strong>of</strong> N-acetylglucosamine residues in peptidoglycan from Bacillus<br />
cereus cell walls. Biochem. Biophys. Res. Commun. 45: 751–758.<br />
Atrih A. and S.J. Foster. 2001. In vivo roles <strong>of</strong> the germination-<br />
spe cific lytic enzymes <strong>of</strong> Bacillus subtilis 168. <strong>Microbiology</strong> 147:<br />
2925–2932.<br />
Bera A., S. Herbert, A. Jakob, W. Vollmer and F. Gotz. 2005. Why<br />
are pathogenic staphylococci so lysozyme resistant? The peptidoglycan<br />
O-acetyltransferase OatA is the major determinant for lysozyme<br />
resistance <strong>of</strong> Staphylococcus aureus. Mol. Microbiol. 55: 778–787.<br />
Bernard E., T. Rolain, P. Courtin, A. Guillot, P. Langella, P. Hols<br />
and M.P. Chapot-Chartier. 2011 Characterization <strong>of</strong> O-Acetylation<br />
<strong>of</strong> N-Acetylglucosamine: A <strong>No</strong>vel structural variation <strong>of</strong> bacterial<br />
peptidoglycan. J. Biol. Chem. 286: 23950–23958.<br />
Blackburn N.T. and A.J. Clarke. 2001. Identification <strong>of</strong> four families<br />
<strong>of</strong> peptidoglycan lytic transglycosylases. J. Mol. Evol. 52: 78–84.<br />
Beveridge T.J. 1995. The periplasm space and the periplasm in<br />
gram-positive and gram-negative bacteria. ASM News. 61: 125–130.<br />
Boneca I.G., O. Dussurget, D. Cabanes, M.A. Nahori , S. Sousa<br />
et al. 2007. A critical role for peptidoglycan N-deacetylation in Listeria<br />
evasion from the host innate immune system. Proc. Natl. Acad.<br />
Sci. USA. 104: 997–1002.<br />
Bugg T.D.H., D. Braddick, C.G. Dowson and D. I. Roper. 2011.<br />
Bacterial cell wall assembly: still an attractive antibacterial target.<br />
Trends Biotech. 29: 167–173.<br />
Cava F., M.A. de Pedro, H. Lam, B.M. Davis and M.K. Waldor.<br />
2011. distinct pathways for modification <strong>of</strong> the bacterial cell wall<br />
by non-canonical d-amino acids. EMBO J. 30: 3442–3453.<br />
Cloud-Hansen K.A., S.B. Peterson, E.V. Stabb, W.E. Goldman,<br />
M.J. McFall-Ngai and J. Handelsman. 2006. Breaching the great<br />
wall: peptidoglycan and microbial interactions. Nat. Rev. Microbiol.<br />
9: 710–716.<br />
Corr S.C. and L.A. O’Neill. 2009. Listeria monocytogenes infection<br />
in the face <strong>of</strong> innate immunity. Cell. Microbiol. 11: 703–709.<br />
Coulombe F., M. Divangahi, F. Veyrier, L. de Léséleuc, J.L. Gleason<br />
et al. 2009. Increased NOd2-mediated recognition <strong>of</strong> N-glycolyl<br />
muramyl dipeptide. J. Exp. Med. 206: 1709–1716.<br />
Crisostomo M.I., W. Vollmer, A.S. Kharat, S. Inhulsen, F. Gehre,<br />
S. Buckenmaier and A. Tomasz. 2006. Attenuation <strong>of</strong> penicillin<br />
resistance in a peptidoglycan O-acetyl transferase mutant <strong>of</strong> Streptococcus<br />
pneumoniae. Mol. Microbiol. 61: 1497–1509.<br />
Cummins C.S. and H. Harris. 1956. The chemical composition <strong>of</strong><br />
the cell wall in some gram-positive bacteria and its possible value as<br />
a taxonomic character. J. Gen. Microbiol. 14: 583–600.<br />
Davis K. M. and J.N. Weiser. 2011 Modifications to the peptidoglycan<br />
backbone help bacteria to establish infection. Infect. Immun.<br />
79: 562–570.<br />
Dmitriev B.A., F.V. Toukach, K.J. Schaper, O. Holst, E.T. Rietschel<br />
and S. Ehlers. 2003. Tertiary structure <strong>of</strong> bacterial murein: the scaffold<br />
model. J. Bacteriol. 185: 3458–3468.<br />
Dmitriev B.A., F.V. Toukach, O. Holst, E.T. Rietschel and S. Ehlers.<br />
2004. Tertiary structure <strong>of</strong> Staphylococcus aureus cell wall murein.<br />
J. Bacteriol. 186: 7141–7148.<br />
Dmitriev B.A., F. Toukach and S. Ehlers. 2005. Towards a comprehensive<br />
view <strong>of</strong> the bacterial cell wall. Trends Microbiol. 13: 569–754.<br />
Dowd M.M., B. Orsburn and D.L. Popham. 2008. Cortex peptidoglycan<br />
lytic activity in germinating Bacillus anthracis spores.<br />
J. Bacteriol. 190: 4541–4548.<br />
Dziarski R. and D. Gupta. 2010. Review: Mammalian peptidoglycan<br />
recognition proteins (PGRPs) in innate immunity. Innate<br />
Immun. 16: 168–174.<br />
Fittipaldi N., T. Sekizaki, D. Takamatsu, D.-P. M. de la Cruz,<br />
J. Harel, N.K. Bui, W. Vollmer and M. Gottschalk. 2008 Significant<br />
contribution <strong>of</strong> the pgdA gene to the virulence <strong>of</strong> Streptococcus suis.<br />
Mol. Microbiol. 70(5):1120–1135.<br />
Gan L., S. Chen and G. L. Jensen. 2008. Molecular organization<br />
<strong>of</strong> Gram-negative peptidoglycan. Proc. Natl Acad. Sci. USA 105:<br />
18953–18957.<br />
Gilmore M.E., D. Bandyopadhyay, A.M. Dean, S.D. Linnstaedt<br />
and D.L. Popham. 2004. Production <strong>of</strong> muramic delta-lactam in<br />
Bacillus subtilis spore peptidoglycan. J. Bacteriol. 186: 80–89.<br />
Glauner B. 1988 Separation and quantification <strong>of</strong> muropeptides<br />
with high-performance liquid chromatography. Anal. Biochem. 172:<br />
451–464.<br />
Graham L.L., T.J. Beveridge and N. Nanninga. 1991. Periplasmic<br />
space and the concept <strong>of</strong> periplasm. Trends. Biochem. Sci. 16:<br />
328–329.<br />
Gram H.C. 1884. Uber die isolierte Farbung der Schizomyceten in<br />
Schnitt- and Trockenpraparaten. Fortschritte der Medizin 2: 185–189.<br />
Hayhurst E. J., L. Kailas, J. K. Hobbs and S. J. Foster. 2008. Cell<br />
wall peptidoglycan architecture in Bacillus subtilis. Proc. Natl. Acad.<br />
Sci. USA 105: 14603–14608.<br />
Heffron J.D., N. Sherry and D.L. Popham. 2011. In vitro studies<br />
<strong>of</strong> peptidoglycan binding and hydrolysis by the Bacillus anthracis<br />
germination-specific lytic enzyme SleB. J. Bacteriol. 193: 125–131.<br />
Heidrich C., A. Ursinus, J. Berger, H. Schwarz and J.V. Höltje.<br />
2002. Effects <strong>of</strong> multiple deletions <strong>of</strong> murein hydrolases on viability,<br />
septum cleavage, and sensitivity to large toxic molecules in Escherichia<br />
coli. J. Bacteriol. 184: 6093–6099.<br />
Höltje J.V., D. Mirelman, D. Sharon and U. Schwarz. 1975. <strong>No</strong>vel<br />
type <strong>of</strong> murein transglycosylase in Escherichia coli. J. Bacteriol. 124:<br />
1067–1076.<br />
Höltje J.V. 1998 Growth <strong>of</strong> the stress-bearing and shape-maintaining<br />
murein sacculus <strong>of</strong> Escherichia coli. Microbiol. Mol. Biol. Rev.<br />
62: 181–203.<br />
Höltje JV and Glauner B. 1990. Structure and metabolism <strong>of</strong> the<br />
murein sacculus. Res. Microbiol. 141: 75–89.<br />
Kietzman C. and E. Tuomanen. 2011. PGRPs kill with an ancient<br />
weapon. Nat. Med. 17: 665–666.<br />
Korsak D., W. Vollmer and Z. Markiewicz. 2005. Listeria monocytogenes<br />
EGd lacking penicillin-binding protein 5 (PBP5) produces<br />
a thicker cell wall. FEMS Microbiol. Lett. 251: 281–288.<br />
Korsak D., Z. Markiewicz, G.O. Gutkind and J.A. Ayala. 2010.<br />
Identification <strong>of</strong> the full set <strong>of</strong> Listeria monocytogenes penicillinbinding<br />
proteins and characterization <strong>of</strong> PBPd2 (Lmo2812). BMC<br />
Microbiol. 10: 239.<br />
Laaberki M.H., J. Pfeffer, A.J. Clarke and J. Dworkin. 2011.<br />
O-Acetylation <strong>of</strong> peptidoglycan is required for proper cell separation<br />
and S-layer anchoring in Bacillus anthracis. J. Biol. Chem. 286:<br />
5278–5288.<br />
Markiewicz Z., B. Glauner and U.Schwarz. 1983. Murein structure<br />
and lack <strong>of</strong> dd- and Ld-carboxypeptidase activities in Caulobacter<br />
crescentus. J. Bacteriol. 156: 649–655.
186<br />
Markiewicz Z. 1993. The Structure and Functions <strong>of</strong> the Cell Envelope<br />
(in <strong>Polish</strong>). <strong>Polish</strong> Scientific Publishers PWN, Warsaw.<br />
Matias V.R. and T.J. Beveridge. 2005. Cryo-electron microscopy<br />
reveals native polymeric cell wall structure in Bacillus subtilis<br />
168 and the existence <strong>of</strong> a periplasmic space. Mol. Microbiol.<br />
56: 240–251.<br />
Matias V.R. and T.J. Beveridge. 2006. Native cell wall organization<br />
shown by cryo-electron microscopy confirms the existence <strong>of</strong> a periplasmic<br />
space in Staphylococcus aureus. J. Bacteriol. 188: 1011–1021.<br />
Matias V.R. and T.J. Beveridge. 2008. Lipoteichoic acid is a major<br />
component <strong>of</strong> the Bacillus subtilis periplasm. J. Bacteriol. 190:<br />
7414–7418.<br />
Merchante R., H.M. Pooley and D. Karamata. 1995. A periplasm<br />
in Bacillus subtilis. J. Bacteriol. 177: 6176–6183.<br />
Meroueh S.O., K.Z. Bencze, D. Hesek, M. Lee, J.F. Fisher,<br />
T.L. Stemmler and S. Mobashery. 2006 Three-dimensional structure<br />
<strong>of</strong> the bacterial cell wall peptidoglycan. Proc. Natl. Acad. Sci.<br />
USA 103: 4404–4409.<br />
Meyrand M., A. Boughammoura, P. Courtin, C. Mezange,<br />
A. Guillot and M-P. Chapot-Chartier. 2007. Peptidoglycan<br />
N-acetylglucosamine deacetylation decreases autolysis in Lactococcus<br />
lactis. <strong>Microbiology</strong> 153: 3275–3285.<br />
Moynihan P.J. and A.J. Clarke. 2010. O-acetylation <strong>of</strong> peptidoglycan<br />
in gram-negative bacteria: identification and characterization <strong>of</strong><br />
peptidoglycan O-acetyltransferase in Neisseria gonorrhoeae. J. Biol.<br />
Chem. 285: 13264–13273.<br />
Park, J.T. and M.J. Johnson. 1949. Accumulation <strong>of</strong> labile phosphorus<br />
in Staphylococcus aureus grown in the presence <strong>of</strong> penicillin.<br />
J. Biol. Chem. 179:585–592.<br />
Pavelka M.S. Jr. 2007. Another brick in the wall. Trends Microbiol.<br />
15: 147–149.<br />
Peltier J., P. Courtin, I. El Meouche, L. Lemee, M.P. Chapot-Chartier<br />
and J.L. Pons. 2011. Clostridium difficile has an original peptidoglycan<br />
structure with high level <strong>of</strong> N-acetylglucosamine deacetylation<br />
and mainly 3–3 cross-links. J. Biol. Chem. 286: 20953–20962.<br />
Pink D., J. Moeller, B. Quinn, M. Jericho and T. Beveridge. 2000.<br />
On the architecture <strong>of</strong> the gram-negative bacterial murein sacculus.<br />
J. Bacteriol. 182: 5925–5930.<br />
Popham D.L., J. Helin, C.E. Costello and P. Setlow. 1996. Analysis<br />
<strong>of</strong> the peptidoglycan structure <strong>of</strong> Bacillus subtilis endospores. J. Bacteriol.<br />
178: 6451–6458.<br />
Popowska M., M. Kusio, P. Szymanska and Z. Markiewicz. 2009.<br />
Inactivation <strong>of</strong> the wall-associated de-N-acetylase (PgdA) <strong>of</strong> Listeria<br />
monocytogenes results in greater susceptibility <strong>of</strong> the cells to induced<br />
autolysis. J. Microbiol. Biotechnol. 9: 932–945.<br />
Popowska M., M. Osinska and M. Rzeczkowska. 2011. N-acetylglucosamine-6-phosphate<br />
deacetylase (NagA) <strong>of</strong> Listeria monocytogenes<br />
EGd, an essential enzyme for the metabolism and recycling<br />
<strong>of</strong> amino sugars. Arch. Microbiol. Accepted Aug. 27 dOI: 10.1007/<br />
s00 203-011-0752-3.<br />
Rae C.S., A. Geissler, P.C. Adamson and D.A. Portnoy. 2011.<br />
Mutations <strong>of</strong> the Listeria monocytogenes peptidoglycan N-deacetylase<br />
and O-acetylase result in enhanced lysozyme sensitivity, bacteriolysis<br />
and hyper-induction <strong>of</strong> innate immune pathways. Infect.<br />
Immun. 79: 3596–3608.<br />
Raymond J.B., S. Mahapatra, D.C. and M.S. Jr. Pavelka. 2005.<br />
Identification <strong>of</strong> the namH gene, encoding the hydroxylase responsible<br />
for the N-glycolylation <strong>of</strong> the mycobacterial peptidoglycan.<br />
J. Biol. Chem. 280: 326–333.<br />
Reith J. and C. Mayer C. 2011. Peptidoglycan turnover and recycling<br />
in Gram-positive bacteria Appl. Microbiol. Biotechnol. Jul 28.<br />
[Epub ahead <strong>of</strong> print]<br />
Rogers H.J. 1974. Peptidoglycans (mucopeptides): structure, function,<br />
and variations. Ann. N. Y. Acad. Sci. 35: 29–51.<br />
Salton M. R.J. 1952. Cell Wall <strong>of</strong> Micrococcus Lysodeikticus as the<br />
substrate <strong>of</strong> lysozyme. Nature 170: 746–748.<br />
Markiewicz Z. and Popowska M. 3<br />
Salton M.R. and R.W. Horne. 1951 Studies <strong>of</strong> the bacterial cell<br />
wall. II. Methods <strong>of</strong> preparation and some properties <strong>of</strong> cell walls.<br />
Biochim. Biophys. Acta 7: 177–197.<br />
Salton M.R. 1957. Cell-wall amino-acids and amino-sugars. Nature<br />
180: 338–339.<br />
Schäberle T.F., W. Vollmer, H.J. Frasch, S. Hüttel, A. Kulik,<br />
M. Röttgen, A.K. von Thaler, W. Wohlleben and E. Stegmann.<br />
2011. Self-resistance and cell wall composition in the glycopeptide<br />
producer Amycolatopsis balhimycina. Antimicrob. Agents Chemother.<br />
55: 4283–4289.<br />
Scheurwater E.M. and Clarke A.J. 2008. The C-terminal domain<br />
<strong>of</strong> Escherichia coli Yfhd functions as a lytic transglycosylase. J. Biol.<br />
Chem. 283: 8363–8373.<br />
Scheurwater E.M. and L.L Burrows. 2011. Maintaining network<br />
security: how macromolecular structures cross the peptidoglycan<br />
layer. FEMS Microbiol. Lett. 318: 1–9.<br />
Schleifer K.H. and O. Kandler. 1972. Peptidoglycan types <strong>of</strong> bacterial<br />
cell walls and their taxonomic implications. Bacteriol. Rev. 36:<br />
407–477.<br />
Shaik M.M., L. Cendron, R. Percudani and G. Zanotti. 2011. The<br />
structure <strong>of</strong> Helicobacter pylori HP0310 reveals an atypical peptidoglycan<br />
deacetylase. PLoS One. 6: e19207.<br />
Sharif S., M. Singh, S.J. Kim and J. Schaefer. 2009. Staphylococcus<br />
aureus peptidoglycan tertiary structure from carbon-13 spin diffusion.<br />
J. Am. Chem. Soc. 131(20):7023–7030.<br />
Sharif S, Singh M., Kim S. J. and J Schaefer. 2009. Staphylococcus<br />
aureus peptidoglycan tertiary structure from carbon-13 spin diffusion.<br />
J. Am .Chem. Soc. 131: 7023–7030.<br />
Verwer R.W., N. Nanninga, W. Keck and U. Schwarz. 1978.<br />
Arrangement <strong>of</strong> glycan chains in the sacculus <strong>of</strong> Escherichia coli.<br />
J. Bacteriol. 136:723–729.<br />
Vollmer W., D. Blanot and M.A. de Pedro. 2008. Peptidoglycan<br />
structure and architecture. FEMS Microbiol. Rev. 322: 149–167.<br />
Vollmer W. and A. Tomasz. 2002. Peptidoglycan N-acetylglucosamine<br />
deacetylase, a putative virulence factor in Streptococcus pneumoniae.<br />
Infect. Immun. 70: 7176–7178.<br />
Vollmer W. and J.V. Höltje. 2004. The architecture <strong>of</strong> the murein<br />
(peptidoglycan) in gram-negative bacteria: vertical scaffold or horizontal<br />
layer(s)? J. Bacteriol. 186: 5978–5987.<br />
Vollmer W. and S.K.J. Seligman. 2010 Architecture <strong>of</strong> peptidoglycan:<br />
more data and more models. Trends Microbiol. 18: 59–66.<br />
Watterlot L., M. Meyrand, N. Gaide, P. Kharrat, S. Blugeon,<br />
J.J. Gratadoux, M.J. Flores, P. Langella, M.P. Chapot-Chartier<br />
and L.G. Bermúdez-Humarán. 2010. Variations <strong>of</strong> N-acetylation<br />
level <strong>of</strong> peptidoglycan do not influence persistence <strong>of</strong> Lactococcus<br />
lactis in the gastrointestinal tract. Int. J. Food Microbiol. 144: 29–34.<br />
Weadge J.T., J.M. Pfeffer and A.J. Clarke. 2005. Identification<br />
<strong>of</strong> a new family <strong>of</strong> enzymes with potential N-acetylpeptidoglycan<br />
esterase activity in both Gram-positive and Gram-negative bacteria.<br />
BMC Microbiol. 5: 49.<br />
Work E. 1957. Biochemistry <strong>of</strong> the bacterial cell wall. Nature 179:<br />
841–847.<br />
Work E. 1961. The mucopeptides <strong>of</strong> bacterial cell walls. A review.<br />
J. Gen. Microbiol. 25:169–189.<br />
Work E. 1969. Biochemistry <strong>of</strong> bacterial cell walls. Lab. Pract. 18:<br />
831–838.<br />
Yoon J, Y. Matsuo, S. Matsuda, H. Kasai and A. Yokota. 2010.<br />
Cerasicoccus maritimus sp. nov. and Cerasicoccus frondis sp. nov.,<br />
two peptidoglycan-less marine verrucomicrobial species, and<br />
description <strong>of</strong> Verrucomicrobia phyl. nov., nom. rev. J. Gen. Appl.<br />
Microbiol. 56: 213–222.<br />
Zuber B., M. Haenni, T. Ribeiro, K. Minnig, F. Lopes, P. Moreillon<br />
and J. Dubochet. 2006. Granular layer in the periplasmic space <strong>of</strong><br />
gram-positive bacteria and fine structures <strong>of</strong> Enterococcus gallinarum<br />
and Streptococcus gordonii septa revealed by cryo-electron<br />
microscopy <strong>of</strong> vitreous sections. J. Bacteriol. 188: 6652–6660.
<strong>Polish</strong> <strong>Journal</strong> <strong>of</strong> <strong>Microbiology</strong><br />
2011, Vol. 60, <strong>No</strong> 3, 187–201<br />
ORIGINAL PAPER<br />
A New Rapid and Cost-Effective Method for Detection <strong>of</strong> Phages, ICEs<br />
and Virulence Factors Encoded by Streptococcus pyogenes<br />
ANNA L. BOREK1 , JOANNA WILEMSKA1,3 , RAdOSŁAW IZdEBSKI2 , WALERIA HRYNIEWICZ1 and IZABELA SITKIEWICZ1 *<br />
1 department <strong>of</strong> Epidemiology and Clinical <strong>Microbiology</strong>, National Medicines Institute, Warsaw, Poland<br />
2 department <strong>of</strong> Molecular <strong>Microbiology</strong>, National Medicines Institute, Warsaw, Poland<br />
3 Current address: department <strong>of</strong> Clinical Cytology, The Medical Centre <strong>of</strong> Postgraduate Education, Warsaw, Poland<br />
Received 27 June 2011, revised 12 July 2011, accepted 14 July 2011<br />
Introduction<br />
Streptococcus pyogenes (group A Streptococcus, GAS)<br />
is an important human pathogen that causes a broad<br />
spectrum <strong>of</strong> skin and mucosal surface infections.<br />
GAS diseases range from mild, such as streptococcal<br />
pharyngitis or impetigo, to severe toxin-mediated,<br />
among which are necrotizing fasciitis or toxic shock<br />
syndrome and postinfectious diseases (Cunningham,<br />
2000). GAS is responsible for over 600 millions <strong>of</strong> new<br />
infections every year and causes half a million deaths<br />
as a result <strong>of</strong> infections and post-infectional sequelae<br />
(Carapetis et al., 2005).<br />
The success <strong>of</strong> GAS as a pathogen relies on the production<br />
<strong>of</strong> multiple virulence factors involved in various<br />
aspects <strong>of</strong> host-pathogen interactions (Tart et al.,<br />
2007). Initial contact between bacteria and the host is<br />
achieved by the activity <strong>of</strong> multiple adhesins produced<br />
by GAS which bind host proteins and extracellular<br />
matrix proteins such as plasminogen, collagen, keratin<br />
(for a review see Courtney et al., 2002; Cunningham,<br />
2000; Oehmcke et al., 2010; Smeesters et al., 2010).<br />
Abstract<br />
Streptococcus pyogenes (group A Streptococcus, GAS) is a human pathogen that causes diseases <strong>of</strong> various intensity, from mild strep throat<br />
to life threatening invasive infections and postinfectional sequelae. S. pyogenes encodes multiple, <strong>of</strong>ten phage encoded, virulence factors<br />
and their presence is related to severity <strong>of</strong> the disease. Acquisition <strong>of</strong> mobile genetic elements, carrying virulence factors, as phages or ICEs<br />
(integrative and cojugative elements) has been shown previously to promote selection <strong>of</strong> virulent clones. We designed the system <strong>of</strong> eight<br />
low volume multi- and one singleplex PCR reactions to detect genes encoding twenty virulence factors (spd3, sdc, sdaB, sdaD, speB, spyCEP,<br />
scpA, mac, sic, speL, K, M, C, I, A, H, G, J, smeZ and ssa) and twenty one phage and ICE integration sites described so far for S. pyogenes.<br />
Classification <strong>of</strong> strains based on the phage and virulence factors absence or presence, correlates with PFGE MLST and emm typing results.<br />
We developed a novel, fast and cost effective system that can be used to detect GAS virulence factors. Moreover, this system may become<br />
an alternative and effective system to differentiate between GAS strains.<br />
K e y w o r d s: Streptococcus pyogenes, GAS, superantigens, virulence factors, typing, phage<br />
After initial contact, bacteria invade host tissues and<br />
<strong>of</strong>ten disseminate causing systemic reaction (Tart et al.,<br />
2007). Multiple classes <strong>of</strong> GAS virulence factors such as<br />
proteases, dNases and pyrogenic toxins (superantigens)<br />
are involved in interaction between bacteria and the<br />
host in post attachment phase.<br />
Major surface adhesin – M protein, is involved in<br />
tissue invasion and interaction with human immune<br />
system (Perez-Caballero et al., 2004). Other elements<br />
<strong>of</strong> the human immune system are inactivated by set<br />
<strong>of</strong> specialized proteases. ScpA a highly specific peptidase<br />
encoded by scpA gene degrades C5a factor <strong>of</strong><br />
the complement (Cleary et al., 1992). SpeB is a cysteine<br />
protease that can inactivate C3b factor <strong>of</strong> the complement<br />
(Terao et al., 2008) and multiple other host factors<br />
involved in immune response such as interleukin-1b<br />
precursor and immunoglobulins (Chiang-Ni and<br />
Wu, 2008). In addition SpeB is involved in tissue<br />
destruction by activation <strong>of</strong> pro-matrix metallo-proteases<br />
and degradation <strong>of</strong> fibronectin, vitronectin, plasminogen<br />
and kininogen (Chiang-Ni and Wu, 2008).<br />
The protease MAC/IdeS cleaves specifically human IgG<br />
* Corresponding author: I. Sitkiewicz, department <strong>of</strong> Epidemiology and Clinical <strong>Microbiology</strong>, National Medicines Institute,<br />
Chełmska 30/34, 00-725 Warszawa, Poland; phone (+48 22) 841 12 22; fax (+48 22) 841 29 41; e-mail: isitkiewicz@cls.edu.pl
188<br />
(von Pawel-Rammingen et al., 2002). Recently discovered<br />
protease SpyCEP is involved in degradation <strong>of</strong><br />
chemokines and chemotactic factors as interleukin-8,<br />
granulocyte chemotactic protein-2, growth related<br />
oncogene α and β and macrophage inflammatory protein<br />
2-α (Edwards et al., 2005; Kurupati et al., 2010;<br />
Sumby et al., 2008; Zinkernagel et al., 2008).<br />
dNases produced by GAS are involved in dissemination<br />
<strong>of</strong> bacteria and escape from neutrophil extracellular<br />
traps (Sumby et al., 2005; Walker et al., 2007). And<br />
finally, large group <strong>of</strong> toxins encoded by GAS genes<br />
(speL, speK, speM, speC, speI, speA, speH, speG, speJ,<br />
smeZ and ssa) is involved in systemic toxicity.<br />
Some <strong>of</strong> the GAS virulence factors, e.g. SpeB, ScpA,<br />
SpyCEP, Mac, SdaB and SpeG, are chromosomally<br />
encoded, however, large fraction <strong>of</strong> virulence factors<br />
such as majority <strong>of</strong> dNAses and superantigens e.g.<br />
SpeA, SpeC , SpeH and SSA are encoded by mobile<br />
genetic elements – phages and conjugative mobile elements<br />
integrated into the chromosome (ICEs – integrative<br />
and cojugative elements) (Beres and Musser,<br />
2007). Based on the comparison <strong>of</strong> genome sequences<br />
<strong>of</strong> multiple GAS strains, metagenome <strong>of</strong> GAS contains<br />
on average about 10% <strong>of</strong> exogenous elements (Beres<br />
and Musser, 2007; Ferretti et al., 2001). So far, 67 mobile<br />
elements (55 prophages and 12 ICE elements) integrated<br />
at 21 distinct loci <strong>of</strong> the core chromosome in<br />
the 12 GAS genomes have been identified (Beres and<br />
Musser, 2007) (Table I).<br />
Over the years, multiple serological, restriction fragment<br />
based and PCR based methods <strong>of</strong> GAS typing<br />
and virulence factors detection were used (Cleary et al.,<br />
1988; Commons et al., 2008; Hartas et al., 1998; Koller<br />
et al., 2010; Lintges et al., 2007; Matsumoto et al., 2003;<br />
Maxted et al., 1973; Moody et al., 1965; Nandi et al.,<br />
2008; Schmitz et al., 2003; Seppala et al., 1994; Swift<br />
et al., 1943). Each <strong>of</strong> the methods presents various<br />
advantages and disadvantages. Serological assays are<br />
usually less precise than molecular methods. Methods<br />
based on the analysis <strong>of</strong> restriction patterns, and methods<br />
based on random amplification, are <strong>of</strong>ten difficult<br />
for analysis and comparison. Multiple PCR assays utilizing<br />
specific targets were developed before the era <strong>of</strong><br />
massive genome sequencing that allows including the<br />
knowledge <strong>of</strong> allelic variations between strains <strong>of</strong> various<br />
serotypes in the design <strong>of</strong> more specific systems.<br />
Also, multiple PCR based systems were designed mostly<br />
as singleplex reactions what increases screening costs in<br />
case <strong>of</strong> detection <strong>of</strong> multiple virulence factors.<br />
Currently, to determine the relationships between<br />
GAS isolates and strains, three major methods are<br />
typically used. The first method, which is regarded as<br />
a golden standard by many laboratories, is pulsed field<br />
gel electrophoresis (PFGE) typing (Bert et al., 1997).<br />
PFGE is <strong>of</strong>ten recommended as a reference method<br />
Borek A.L. et al. 3<br />
in outbreak investigations, especially for food borne<br />
diseases (http://www.cdc.gov/pulsenet/, http://www.<br />
medvetnet.org/cms/). PFGE is a method based on<br />
restriction fragment size polymorphism. Chromosomal<br />
dNA is released from bacteria and digested with<br />
rare cutting restriction enzyme directly in agarose gel<br />
and fragments are separated using alternating voltage<br />
gradient (for a review see (Herschleb et al., 2007;<br />
Slater, 2009)). PFGE typing detects rather large and<br />
recent evolutionary changes in bacterial dNA such as<br />
insertion or excision <strong>of</strong> a phage, large insertions and<br />
deletions and mutations resulting in a loss or appearance<br />
<strong>of</strong> a new restriction site (Tenover et al., 1995). Two<br />
strains are related to each other when the number <strong>of</strong><br />
differences in restriction patterns is below 7 (Tenover<br />
et al., 1995). PFGE is a technique with high discriminatory<br />
power, but it is time consuming and available<br />
protocols require from minimum two days to over one<br />
week to determine PFGE type <strong>of</strong> the strain (Herschleb<br />
et al., 2007). What’s equally important, the technique<br />
requires relatively expensive equipment, skilled labor<br />
and the results <strong>of</strong> PFGE are <strong>of</strong>ten difficult to compare<br />
between laboratories.<br />
The second method used routinely in GAS epidemiology<br />
is emm typing. Emm typing, is a molecular<br />
equivalent <strong>of</strong> serotyping and allows grouping <strong>of</strong> GAS<br />
strains into serotypes/genotypes based on the type <strong>of</strong><br />
the surface M protein (Facklam et al., 1999; Hoe et al.,<br />
1999). It is an easy and straightforward method that<br />
utilizes sequencing <strong>of</strong> a portion <strong>of</strong> the emm gene,<br />
which encodes hypervariable region <strong>of</strong> the M protein.<br />
The major advantage <strong>of</strong> molecular emm typing is rapid<br />
identification <strong>of</strong> novel variants <strong>of</strong> M protein responsible<br />
for new serotypes. The emm typing requires PCR<br />
amplification, purification <strong>of</strong> the amplicon and single<br />
sequencing reaction as a next step (Beall et al., 2000).<br />
The third method, multi-locus sequence typing<br />
(MLST), is based on sequencing <strong>of</strong> seven housekeeping<br />
loci to detect allelic changes. differences in allelic<br />
pr<strong>of</strong>iles in isolates are assigned to known or new<br />
sequence types (STs) (Enright et al., 2001). Similarly<br />
to emm typing the method requires PCR amplification,<br />
purification <strong>of</strong> the product and sequencing. The<br />
method is relatively fast and reliable but in case <strong>of</strong> GAS,<br />
requires 14 sequencing reactions per isolate, which significantly<br />
increases the costs <strong>of</strong> typing. Because <strong>of</strong> the<br />
cost <strong>of</strong> MLST, alternative approaches to detect allelic<br />
changes in genes included in MLST scheme are developed,<br />
such as PCR assays with high resolution melting<br />
curves named Mini-MLST (Richardson et al., 2010).<br />
In this report, we present a rapid and cost effective<br />
method to detect virulence factors encoded by GAS<br />
and phages/ICE elements integrated into genome<br />
using set <strong>of</strong> multiplex PCR reactions. described system<br />
allows easy, simultaneous detection <strong>of</strong> 20 GAS virulence
3 Phages, ICEs, virulence factors in S. pyogenes<br />
189<br />
Table I<br />
Integration sites <strong>of</strong> phages and ICE elements in sequenced S. pyogenes genomes (Modified after Beres and Musser, 2007)<br />
Integration<br />
site<br />
Strain Exogenous<br />
Element<br />
Virulence<br />
Gene(s)<br />
CdS Start <strong>of</strong> the<br />
integrated element<br />
CdS Stop <strong>of</strong> the<br />
integrated element<br />
A MGAS10394 10394.1 sdn 0020 0068<br />
B MGAS8232 8232.1 speA1 0336 0394<br />
C SF370 370.1 speC-spd1 0655 0712<br />
C MGAS10270 10270.1 speC-spd1 0536 0598<br />
C MGAS10750 10750.1 speC-spd1 0560 0622<br />
C Manfredo man.4 speC-spd1 1263 1322<br />
C MGAS2096 2096.1 speC-spd1 0553 0602<br />
C MGAS9429 9429.1 speC-spd1 0532 0594<br />
C MGAS8232 8232.2 speC-spd1 0716 0779<br />
d MGAS10394 10394.2 speA4 0733 0741<br />
E SF370 370.2 speH-speI 0937 1008<br />
E MGAS10270 10270.2 spd3 0796 0853<br />
E MGAS10750 10750.2 spd3 0831 0889<br />
E Manfredo man.3 speH-speI 1021 1070<br />
E MGAS9429 9429.2 speH-speI 0795 0851<br />
F MGAS315 315.1 none 0681 0736<br />
F SSI SPsP5 none 0877 0937<br />
G SF370 370-Rd.1 srtA 1075 1088<br />
G MGAS5005 5005-Rd.1 srtA 0797 0816<br />
G MGAS10270 10270-Rd.1 srtA 0910 0932<br />
G MGAS10750 10750-Rd.1 srtA 0945 0967<br />
G MGAS2096 2096-Rd.1 srtA 0869 0890<br />
G MGAS9429 9429-Rd.1 srtA 0911 0934<br />
G MGAS6180 6180-Rd.0 srtA 0771 0793<br />
H MGAS5005 5005.1 speA2 0995 1052<br />
H MGAS315 315.2 ssa 0919 0978<br />
H SSI SPsP6 ssa 1118 1172<br />
H MGAS10394 10394. 3 speK-sla 0982 1026<br />
H MGAS8232 8232.3 speL-speM 1238 1309<br />
H MGAS6180 6180.1 speC-spd1 0967 1033<br />
I MGAS2096 2096-Rd.2 tet (O) 1103 1159<br />
I MGAS6180 6180-Rd.1 none 1079 1089<br />
J MGAS10394 10394.4 mef(A), R6 1123 1173<br />
K SF370 370.3 spd3 1436 1488<br />
K MGAS5005 5005.2 spd3 1168 1222<br />
K MGAS315 315.3 spd4 1094 1145<br />
K SSI SpsP4 spd4 0717 0771<br />
K MGAS10750 10750.3 ssa 1276 1328<br />
K Manfredo man.2 spd4 0631 0692<br />
K MGAS10394 10394.5 speC-spd1 1194 1242<br />
K MGAS8232 8232.4 spd3 1444 1506<br />
L MGAS10270 10270.3 speK-sla 1297 1361<br />
L MGAS315 315.4 speK-sla 1203 1266<br />
L SSI SPsP3 speK-sla 0597 0659<br />
L MGAS6180 6180.2 speK-sla 1220 1285<br />
M MGAS10270 10270-Rd.2 R28 1378 1411
190<br />
Integration<br />
site<br />
Strain Exogenous<br />
Element<br />
factors (VF) and screening <strong>of</strong> 21 phage and ICE integration<br />
sites. The described PCR based method combined<br />
with emm typing can be effectively used to differentiate<br />
between GAS strains.<br />
Experimental<br />
Materials and Methods<br />
Bacterial isolates. Over 650 highly diverse GAS<br />
isolates analyzed in the study were sent to KORLd<br />
(National Reference Center for Antibiotic Resistance)<br />
and KOROUN (National Reference Center for Infections<br />
<strong>of</strong> Central Nervous System) as a part <strong>of</strong> routine<br />
reference activity and as a part <strong>of</strong> BiNet network for<br />
monitoring invasive infections (http://www.koroun.<br />
edu.pl/binet_info01.php). Bacterial strains were sent<br />
from over 60 laboratories located in multiple geographical<br />
areas <strong>of</strong> Poland and were isolated from various<br />
forms <strong>of</strong> the GAS diseases (throat, skin and invasive<br />
infections). Emm types <strong>of</strong> the strains were determined<br />
as routine part <strong>of</strong> diagnostic work according to (Beall<br />
et al., 1996) and CdC’s recommendations. In addition,<br />
we used highly clonal population <strong>of</strong> strains which PFGE<br />
patterns, emm and ST types were previously determined<br />
(Szczypa et al., 2004).<br />
Borek A.L. et al. 3<br />
Virulence<br />
Gene(s)<br />
CdS Start <strong>of</strong> the<br />
integrated element<br />
Table I continued<br />
CdS Stop <strong>of</strong> the<br />
integrated element<br />
M MGAS6180 6180-Rd.2 R28 1302 1337<br />
N MGAS315 315.5 speA3 1300 1354<br />
N SSI SPsP2 speA3 0507 0561<br />
N Manfredo man.1 spd3 0471 0535<br />
N MGAS10394 10394.6 sda 1338 1366<br />
O MGAS315 315.6 sdn 1408 1458<br />
O SSI-1 SPsP1 sdn 0408 0456<br />
P MGAS5005 5005.3 sda 1414 1467<br />
P MGAS2096 2096.2 sda 1440 1492<br />
P MGAS9429 9429.3 sda 1415 1468<br />
P MGAS8232 8232.5 sda 1745 1808<br />
R MGAS10394 10394.7 spd3 1540 1562<br />
S MGAS10750 10750-Rd.2 erm(A) 1679 1719<br />
T SF370 370.4 none 2122 2147<br />
T MGAS10270 10270.4 none 1874 1896<br />
T MGAS10750 10750.4 none 1897 1921<br />
T Manfredo man.5 none 1764 1779<br />
T MGAS10394 10394.8 none 1804 1824<br />
T MGAS6180 6180.3 none 1789 1813<br />
U MGAS10270 10270.5 none 1917 1951<br />
U MGAS6180 6180.4 none 1840 1864<br />
PFGE. PFGE analysis was performed according to<br />
modified method by Stanley and co-workers (Stanley<br />
et al., 1995). Briefly, agarose plugs containing bacteria<br />
were incubated for 4 h at 37°C in lysis buffer with lysozyme<br />
(100 µg/ml, Sigma) and mutanolysin (40 µg/ml,<br />
Sigma), followed by overnight treatment with proteinase<br />
K (1 mg/ml). dNA embedded in plugs was digested<br />
with SmaI (Fermentas) for 4h, and separated at 14°C<br />
for 22 h in CHEF-dR III system (Bio-Rad) in 0.5x TBE<br />
buffer, with 6V/cm, initial pulse 1 s., final pulse 30 s.<br />
Isolation <strong>of</strong> chromosomal DNA. Chromosomal<br />
dNA was isolated from cells grown overnight on<br />
Columbia agar plates supplemented with 5% sheep<br />
blood (BioRad, BioMerieux) using the Genomic<br />
Mini Ax BACTERIA kit (A&A Biotechnology) or the<br />
Genomic Mini kit (A&A Biotechnology) according to<br />
the manufacturer’s protocol, with additional initial cell<br />
wall digestion with lysozyme (1 mg/ml, Sigma) and<br />
mutanolysin (500 U/ml, Sigma) for 30 min at 37°C, in<br />
the presence <strong>of</strong> RNAse. Chromosomal dNA used as<br />
a template for PCR reactions was diluted 10-fold.<br />
Primer design and specificity tests. Primer pairs<br />
were designed using the modified Primer3 s<strong>of</strong>tware,<br />
available as the Primer-BLAST tool at NCBI (http://<br />
www.ncbi.nlm.nih.gov/tools/primer-blast/). Primers<br />
were designed to conserved regions <strong>of</strong> detected genes<br />
(in case <strong>of</strong> virulence factors) or conserved regions
3 Phages, ICEs, virulence factors in S. pyogenes<br />
191<br />
Name Sequence<br />
Table II<br />
Primers used in this study<br />
Toxins MIx I<br />
SpeL F CCTGAGCCGTGAAATTCCCA<br />
657<br />
1041734–1041753<br />
SpeL R ACACCAGAATTGTCGTTTGGT 1042370– 1042390<br />
SpeK F CCTTGTGTGTGTATCGCTTGC<br />
39278 – 39298<br />
568<br />
SpeK R TTGCTGTCCCCCATCAAACT 39825 – 39844<br />
SpeM F ATCGCTCATCAAACTTTTCCT<br />
496<br />
1042875–1042895<br />
SpeM R CCTTGTGTGTGTATCGCTTGC 1043350–1043370<br />
SpeC F GCCAATTTCGATTCTGCCGC<br />
405<br />
617333–617352<br />
SpeC R TGCAGGGTAAATTTTTCAACGACA 617715–617737<br />
SmeZ F TTTCTCGTCCTGTGTTTGGA<br />
246<br />
1662332–1662351<br />
SmeZ R TTCCAATCAAATGGGACGGAGAACA 1662554 – 1662578<br />
SpeI F TTCATAGACGGCGTTCAACAA<br />
176<br />
819507–819527<br />
SpeI R TGAAATCTAGAGGAGCGGCCA 819662–819682<br />
Toxins MIx II<br />
ssa F AAGAATACTCGTTGTAGCATGTGT<br />
678<br />
39833–39856<br />
ssa R AATATTGCTCCAGGTGCGGG 40491–40510<br />
SpeA F AGGTAGACTTCAATTTGGCTTGTGT<br />
576<br />
331570–331594<br />
SpeA R GGGTGACCCTGTTACTCACGA 332125–332145<br />
SpeH F TGAGATATAATTGTCGCTACTCACAT<br />
480<br />
786364–786389<br />
SpeH R CCTGAGCGGTTACTTTCGGT 786824–786843<br />
SpeG F TGGAAGTCAATTAGCTTATGCAG<br />
183579 – 183601<br />
384<br />
SpeG R GCGAACAACCTCAGAGGGCAAA 183942 – 183962<br />
SpeJ F TCCTTGTACTAGATGAGGTTGCAT<br />
364343 – 364366<br />
286<br />
SpeJ R GGTGGGGTTACACCATCAGT 364609 – 364628<br />
dNases<br />
spd3 F ATCGTCGTACTTGGCAAGGTT<br />
784<br />
1146098–1146118<br />
spd3 R GCCGCTTCTTCAAACTCTTCG 1146861–1146881<br />
sdc F AAGCTTAGAAACTCTCTCGCCA<br />
600<br />
49–70<br />
sdc R AGTTCCAGTAATAGCGTTTTTCCGT 624–648<br />
sdaB F TATAGCGCATGCCGCCTTTT<br />
440<br />
1700383–1700402<br />
sdaB R TGATGGCGCAAGCAAGTACC 1700803–1700822<br />
sdad F TTTACGCTGAATCGGGCACT<br />
295<br />
1385864–1385883<br />
sdad R GGCTCTGGTTTGCTTTCCCA 1386139–1386158<br />
Proteases/inhibitors<br />
speB_F AGACGGAAGAAGCCGTCAGA<br />
1698752– 1698771<br />
952<br />
speB_R TCAAAGCAGGTGCACGAAGC 1699684–1699703<br />
spyCEP F GATCCGGCCCATCAAAGCAT<br />
786<br />
344582–344601<br />
spyCEP R AGCTGCCACTGATGTTGGTG 345348–345367<br />
scpA F GCTCGGTTACCTCACTTGTCC<br />
1669854 – 1669874<br />
622<br />
scpA R CAATAGCAGCAAACAAGTCACC 1670453–1670477<br />
Mac F TCTTGCCCTGTTGAAAGTGT<br />
389<br />
681947–681966<br />
Mac R CGAGGTGGTATTTTTGACGCC 682315–682335<br />
sic F TTACGTTGCTGATGGTGTATATGGT<br />
150<br />
1682672–1682696<br />
sic R TTTGATAGAGGGTTTTCAGCTGGC 1682798–1682821<br />
Phages MIx 1<br />
Size<br />
(bp)<br />
Position in reference<br />
sequence<br />
phageA_F AGCTTCGTCAGTTCATTGATGAGT<br />
343<br />
34380–34403<br />
phageA_R GGAGTTAATCTTTGTCTGATCACCGT 34723–34698<br />
Ref. sequence<br />
NC_003485<br />
NC_004587<br />
NC_003485<br />
NC_003485<br />
NC_007297<br />
NC_002737<br />
NC_004585<br />
NC_003485<br />
NC_011375<br />
NC_004070<br />
NC_007296<br />
NC_007297<br />
AF410852<br />
NC_007297<br />
NC_007297<br />
NC_002737<br />
AE004092<br />
NC_009332<br />
NC_011375<br />
NC_002737<br />
NC_007297
192<br />
Name Sequence<br />
Borek A.L. et al. 3<br />
phageG_F ACTTGAAGAAGCTGGAGCAACA<br />
477<br />
809606–809627<br />
phageG_R AGGCAATAGCATCTGGCGTC 810052–810033<br />
phageB_F ATCAGTCGCGCCTACCGTAT<br />
636<br />
301872–301891<br />
phageB_R TTACTAGAAGGGGCCTGCCG 302508–302489<br />
phageE_F TGAGACATGGTGGAAAGCAGA<br />
1022<br />
739495–739515<br />
phageE_R TGGTCGAAATAACCAAGGGCA 740517–740497<br />
phaged_F ACGCTTGACTGACTTCGGTG<br />
1168<br />
720561–720580<br />
phaged_R TGGGACTTATCCGTTGTCACG 721729–721709<br />
Phages MIx2<br />
phageK_F TGGTCTGCCATCCATTGTCT<br />
425<br />
1195963–1195982<br />
phageK_R AGCCTTCAAAGCTGGTAAAGCT 1196377–1196356<br />
NC_004070<br />
NC_007297<br />
NC_007297<br />
NC_007297<br />
NC_008022<br />
phageJ_F TGATCCATGGTGACCTGCTT 563 1123319–1123338 NC_007297<br />
phageJ_R TCGACATTGGCCAGGGAGAT 1123881–1123862<br />
phageC_F ATTGCAACAGGTAGCCCAGC<br />
670<br />
531240–531259<br />
phageC_R CTTCACGCGCAGAACGGATA 531910–531891<br />
phageH_F AGGCTTTTGAATTACGTTTTGTC<br />
870<br />
1058226–1058248<br />
phageH_R TGAATCAGACGGTTGAGGCT 1059095–1059076<br />
phageM_F CCACAGCTGTTTCAACACTTTCA<br />
1143<br />
1252437–1252459<br />
phageM_R AATTGGCGCTCGGACATGAT 1253579–1253560<br />
Phages MIx3<br />
phageN_F TCACCGTTAATTCCCATTCGCT<br />
349<br />
1282773–1282794<br />
phageN_R CCGTAGGACAGTTGGGCAAA 1283121–1283102<br />
phageO_F TCACAAAAGCCAGTTGGTCGAT<br />
452<br />
1341889–1341910<br />
phageO_R TATCGTCGTGACTACCGGCT 1342340–1342321<br />
phageP_F CTAAGGATGTAGTCACTACCCATTTTGTC<br />
544<br />
1493473–1493501<br />
phageP_R TCTGGCTTGACTTACACGCT 1494016–1493997<br />
phageI_F GGTGCCACGTAATGATAACTTGTTC<br />
666<br />
1069901–1069925<br />
phageI_R GTAGACCCGCCACGAAAAGG 1070566–1070547<br />
phageL_F GCCAACTGGCCATTTTCTGC<br />
899<br />
1236869–1236888<br />
phageL_R AAGCAAGGAAATGATCGCGG 1237767–1237748<br />
Phages MIx4<br />
phageQ_F CCAGCCATAATCTCAGTTGAGACAGTTG<br />
364<br />
1434160–1434187<br />
phageQ_R GGTTCCATCCAAATCAATGGCAATC 1434523–1434499<br />
phageR_F AACGACGTTGCCCTTCCGCA<br />
432<br />
1512239–1512258<br />
phageR_R TCCAAGCTCCTGGCTCGAATGT 1512670–1512649<br />
phageT_F CGCTGGCCTTTCTACAACTTCACCA<br />
555<br />
1772901–1772925<br />
phageT_R AGCAACGCTTGAAAAAGATGGCGAT 1773455–1773431<br />
phageU_F CTCTTCCCTTTTGTCTGCTAACGGT<br />
671<br />
1796895–1796919<br />
phageU_R CCACGGTCACATCCTTGTTGACGG 1797565–1797542<br />
phageS_F ACACTGACCTTTGAAAAACTCATCCA<br />
917<br />
1586507–1586532<br />
phageS_R ATGATAATAGTCGTAGGGATGCTTGTATTATAAAA 1587423–1587389<br />
PhageF_F<br />
Size<br />
(bp)<br />
Primers to detect integration into F site<br />
NC_007297<br />
NC_008022<br />
NC_007297<br />
NC_007297<br />
NC_007297<br />
NC_004070<br />
NC_007297<br />
NC_007297<br />
NC_007297<br />
NC_007297<br />
NC_007297<br />
NC_007297<br />
NC_007297<br />
CCCGAAGTGAAATCGATGATTGACA ~1000 – 778913–778937 NC_007297<br />
TCCCACGCTCACGCTCCAAA ~3000 780465–780446 NC_007297<br />
Control primers for phage detection<br />
Position in reference<br />
sequence<br />
dnaA_F TGCCGAAGCTATTCGCGCCA<br />
240<br />
1227–1246<br />
dnaA_R ACTGTTGAATGGTCTCTGCCACCA 1466–1443<br />
Table II continued<br />
Ref. sequence<br />
NC_007297
3 Phages, ICEs, virulence factors in S. pyogenes<br />
193<br />
Reagent Toxins MIx I<br />
Toxins MIx II<br />
and proteases<br />
dNAses<br />
Phages MIx 1,2<br />
and 4<br />
Phages<br />
MIx 3<br />
Phage F<br />
100 µM or 10 µM primers mix 0.6 µl 0.5 µl 0.4 µl 0.6 µl 0.7 µl 0.2 µl<br />
10x Taq polymerase buffer<br />
with (NH ) SO (Fermentas)<br />
4 2 4<br />
0.5 µl 0.5 µl 0.5 µl 0.5 µl 0.5 µl 0.5 µl<br />
25 mM MgCl2 0.5 µl 0.5 µl 0.5 µl 0.5 µl 0.5 µl 0.5 µl<br />
1 mM dNTP 0.5 µl 0.5 µl 0.5 µl 0.5 µl 0.5 µl 0.5 µl<br />
water – – – – – – – – – – – – – – – 2.15 µl<br />
10x diluted chromosomal<br />
dNA template<br />
2.8 µl 2.9µl 3.0 µl 2.8 µl 2.7 µl 1 µl<br />
Taq polymerase (Fermentas) 0.1 µl (0.5 U) 0.1 µl (0.5 U) 0.1 µl (0.5 U) 0.1 µl (0.5 U) 0.1 µl (0.5 U) 0.1 5µl (0.75 U)<br />
<strong>of</strong> genes surrounding phage integration site. Primer<br />
sequences, their chromosomal location and accession<br />
number <strong>of</strong> reference sequence are listed in Table II.<br />
Composition <strong>of</strong> the reaction and PCR conditions.<br />
To detect 20 virulence factors, four multiplex<br />
reactions were designed. To detect 21 mobile genetic<br />
element integration sites, four multiplex and one singleplex<br />
reaction were designed. Composition <strong>of</strong> all<br />
primer mixes and size <strong>of</strong> the amplicons generated in<br />
multiplex reactions are listed in Table II. For the ease<br />
<strong>of</strong> use, equal volumes <strong>of</strong> 100 µM primer stocks were<br />
mixed into appropriate mixes, namely: “Toxins MIx I”,<br />
“Toxins MIx II”, “proteases”, “dNAses”. For the case <strong>of</strong><br />
use, equal volumes <strong>of</strong> 10 µM stocks were mixed into:<br />
“Phages MIx 1”, “Phages MIx 2”, “Phages MIx 3” and<br />
“Phages MIx 4”. To avoid degradation, primers premixes<br />
were aliquoted, so the single portion was sufficient<br />
to run the whole 96 well PCR plate without<br />
multiple freezing-thawing cycles. Final composition<br />
<strong>of</strong> each PCR reaction is presented in Table III. All PCR<br />
reactions were carried out in a total volume <strong>of</strong> 5 µl in<br />
a Veriti thermocycler (Applied Biosystems); conditions<br />
<strong>of</strong> PCR reaction are presented in Table IV.<br />
Statistical Analysis. Simpson’s Index <strong>of</strong> diversity,<br />
and the Wallace Coefficient were calculated using<br />
online tool http://darwin.phyloviz.net/ (Carrico et al.,<br />
2006; Pinto et al., 2008). Analysis <strong>of</strong> strains was performed<br />
with Bionumerics package (Applied Maths).<br />
Table IV<br />
PCR reaction conditions used to amplify products<br />
in multiplex reactions<br />
denaturation 95°C 0:15 95°C 0:15 95o Toxins MIx I<br />
and II dnases<br />
Proteases mix<br />
Phages 1–4<br />
and phage F<br />
T t T t T t<br />
C 0:15<br />
Annealing 60°C 0:20 52.5°C 0:45 64°C 0:30<br />
Elongation 72°C 2:00 72°C 3:00 72°C 3:30<br />
All reactions were amplified for 40 cycles with initial denaturation was<br />
carried out for 3 min at 95°C, and final elongation for 7 min at 72°C<br />
T – temperature; t – time<br />
Table III<br />
PCR composition <strong>of</strong> the multiplex reactions<br />
Results and Discussion<br />
Detection <strong>of</strong> phages. Phages/ICEs <strong>of</strong> group A Streptococcus<br />
are major sources <strong>of</strong> genetic diversity in this<br />
group <strong>of</strong> organisms, carriers <strong>of</strong> antibiotic resistance<br />
genes and multiple proven and putative virulence factors<br />
(Beres and Musser, 2007). detection <strong>of</strong> integrated<br />
mobile elements can distinguish between GAS strains<br />
with closely related genetic backgrounds and with addition<br />
<strong>of</strong> other typing methods can be used in detailed<br />
epidemiological investigations (Beres et al., 2010; Beres<br />
et al., 2004).<br />
Comparison <strong>of</strong> multiple GAS genomic sequences<br />
revealed 21 potential integration sites for phages and<br />
ICE elements (Beres and Musser, 2007) and Table I. To<br />
screen all 21 integration sites (named from A through<br />
U as in (Beres and Musser, 2007)), we designed set <strong>of</strong><br />
four multiplex PCR reactions that are able to amplify<br />
products only when no element is integrated between<br />
open reading frames flanking integration site. detection<br />
<strong>of</strong> the integrated phages and ICE elements is based<br />
on the assumption that in the standard PCR reaction,<br />
large (above 10 kb) element integrated into the chromosome<br />
cannot be efficiently amplified and furthermore<br />
detected. The designed primer pairs within single multiplex<br />
reaction had equal annealing temperatures and<br />
100 bp or more size difference between products for<br />
easy product tracing. Primers were tested individually<br />
using an annealing gradient <strong>of</strong> temperatures from 55<br />
to 72°C to select the optimal annealing temperature<br />
for multiplex PCR. Only primers that generated single<br />
amplicons were selected for composition <strong>of</strong> multiplex<br />
reactions (data not shown).<br />
Because the lack <strong>of</strong> the PCR product denotes positive<br />
detection <strong>of</strong> large integrated element into particular<br />
integration site, to avoid PCR errors resulting from negative<br />
PCR amplification, in all multiplex reactions positive<br />
control <strong>of</strong> amplification (240 bp fragment <strong>of</strong> dnaA<br />
gene) is included. Examples <strong>of</strong> phage pr<strong>of</strong>ile (PP) typing<br />
<strong>of</strong> randomly chosen strains from our GAS collection are
194<br />
presented in Figure 1. To test primer specificity, we preformed<br />
PP typing using two reference strains <strong>of</strong> known<br />
genomic sequence: MGAS6180 (NC_007296.1 (Green<br />
et al., 2005)) and MGAS10270 (NC_008022 (Beres and<br />
Musser, 2007)). Based on the genomic sequence , strain<br />
MGAS6180 carries 7 elements integrated into sites G,<br />
H, I, L, M, T, U and MGAS10270 carries 7 elements<br />
integrated into sites C, E, G, L, M, T, U (Table I) ( Beres<br />
and Musser, 2007). In concordance with the predicted<br />
product presence and size, we were able to detect fragments<br />
that denote putative integration sites without<br />
inserted element, and we were not able to detect products<br />
that amplified large integrated element (Fig. 2). In<br />
some cases, such as for site G in strain MGAS10270<br />
and site L in strain MGAS6180, very weak bands are<br />
observed and are probably a signal derived from a dNA<br />
isolated from fraction <strong>of</strong> GAS cells where the element<br />
was excised from the chromosome.<br />
Two mobile elements 315.1 and SPsP5 are integrated<br />
into integration site “F” in M3 strain MGAS315<br />
(between ORFs SpyM3_0680 and SpyM3_0737) and<br />
SSI-1 (between ORFs SPs0876 and SPs0938), respectively<br />
(Beres and Musser, 2007). However, based on<br />
the BLAST searches in all sequenced GAS genomes,<br />
the region encompassed by ORFs flanking prophage<br />
integration site varies in length and gene content in different<br />
strains. Therefore, primers detecting integrated<br />
Borek A.L. et al. 3<br />
Table V<br />
Simpson’s Index <strong>of</strong> diversity (SdI) and Wallace’s coefficient (WC), calculated for strains analyzed by phage<br />
pr<strong>of</strong>iling (PP) and virulence factor pr<strong>of</strong>iling (VF)<br />
A.<br />
Typing Method # partitions Simpson’s Id C.I. (95%)<br />
Phage pr<strong>of</strong>ile (PP) 185 0.965 (0.960–0.971)<br />
Virulence factor pr<strong>of</strong>ile (VF) 95 0.943 (0.936–0.951)<br />
Virulence factor pr<strong>of</strong>ile (VF) without “proteases mix” 94 0.944 (0.936–0.952)<br />
emm type 40 0.908 (0.899–0.917)<br />
B.<br />
PFGE ST emm VF PP<br />
PFGE 1.000 1.000 0.990 0.986<br />
(1.000–1.000) (1.000–1.000) (0.979–1.000) (0.974–0.997)<br />
ST 0.564 1.000 0.899 0.648<br />
(0.379–0.749) (1.000–1.000) (0.768–1.000) (0.472–0.824)<br />
emm 0.564 1.000 0.899 0.648<br />
(0.379–0.749) (1.000–1.000) (0.768–1.000) (0.472–0.824)<br />
VF 0.622 1.000 1.000 0.721<br />
(0.430–0.813) (1.000–1.000) (1.000–1.000) (0.556–0.886)<br />
PP 0.858 1.000 1.000 1.000<br />
(0.703–1.000) (1.000–1.000) (1.000–1.000) (1.000–1.000)<br />
Information about absence (0)/presence (1) <strong>of</strong> particular virulence factor or integrated element was concatenated into<br />
binary sequence <strong>of</strong> 20 or 21 digits and used for calculations with http://darwin.phyloviz.net/ComparingPartitions/.<br />
A SdI calculated for group <strong>of</strong> 656 divergent strains; B. WC calculated for group <strong>of</strong> highly clonal strains (PFGE pattern A<br />
from Szczypa, et al., 2004)<br />
element F amplify fragment <strong>of</strong> varying size, from about<br />
1 kb to over 3 kb in the absence <strong>of</strong> integrated prophage.<br />
We decided to exclude primers detecting integration in<br />
the F site from multiplex reaction to increase PCR specificity<br />
and efficiency and run the reaction separately<br />
(Fig. 1E). With additional optimization <strong>of</strong> the reaction,<br />
primers detecting F integration site can be included in<br />
“phage mix 3”, however detected bands are <strong>of</strong>ten weaker<br />
and gels more difficult for interpretation (Fig. 2).<br />
To determine resolution <strong>of</strong> the phage pr<strong>of</strong>ile detection<br />
as a typing method, we calculated Simpson’s Index<br />
<strong>of</strong> diversity (SId) based on analysis <strong>of</strong> highly diverse<br />
656 GAS strains (Table VA). Among 40 emm types, we<br />
detected 185 distinct phage pr<strong>of</strong>iles with Simpson’s<br />
Index <strong>of</strong> diversity <strong>of</strong> 0.965 (CI 95% 0.960–0.971).<br />
Phage pr<strong>of</strong>ile is also good predictor <strong>of</strong> emm type,<br />
with PP→emm Wallace’s coefficient (WC) equal 0.953<br />
(CI 95% 0.926–0.980).<br />
Insertion or excision <strong>of</strong> large dNA fragments such<br />
as phages/ICEs from the chromosome usually is reflected<br />
in PFGE analysis. To test if the presence <strong>of</strong> integrated<br />
elements correlates with PFGE pattern, we analyzed<br />
homogenous population <strong>of</strong> strains previously<br />
described by Szczypa and co-workers (Szczypa et al.,<br />
2004). Performed PP analysis showed that detection <strong>of</strong><br />
elements inserted into putative integration sites correlates<br />
with PFGE patterns, emm type and ST (Fig. 3AB).
3 Phages, ICEs, virulence factors in S. pyogenes<br />
195<br />
Fig. 1. detection <strong>of</strong> twenty one GAS phage and ICE integration sites in randomly chosen GAS strains.<br />
Each panel represents multiplex PCR reaction: A: Phage MIx1, B: Phage MIx2, C: Phage MIx3, d: Phage MIx4, E. Phage F Amplification <strong>of</strong> a product<br />
denotes lack <strong>of</strong> integrated element at the chromosomal location. Arrows denote expected product size based on the GAS genomic sequences, letters<br />
in parentheses denote the mobile element integration sites after (Beres and Musser, 2007) and Table I, 1.5% agarose/TBE, marker: GeneRuler 100 bp<br />
Plus dNA Ladder (Fermentas).<br />
Fig. 2. detection <strong>of</strong> integrated mobile genetic elements in reference strains MGAS6180 and MGAS10270.<br />
Capital letters denote the mobile element integration sites (after (Beres and Musser, 2007) and Table I) detected by each multiplex reaction and<br />
“+” denotes positive control – amplification <strong>of</strong> dnaA fragment. Amplification <strong>of</strong> a product denotes lack <strong>of</strong> integrated element at the chromosomal<br />
location. Black boxes denote locations without integrated element and white boxes denote chromosomal locations with integrated mobile elements as<br />
annotated for the genomic sequences <strong>of</strong> MGAS6180 (sites G, H, I, L, M, T, U) (Green, et al., 2005) and MGAS10270 (sites C, E, G, L, M, T, U). 1.5%<br />
agarose in TBE buffer, marker: GeneRuler 100 bp Plus dNA Ladder (Fermentas).
196<br />
We detected differences in phage content within single<br />
emm/ST groups that was reflected in described previously<br />
subtype <strong>of</strong> PFGE (Fig. 3). Although PFGE subtyping<br />
is the best predictor <strong>of</strong> phage content (WC PFGE→PP =<br />
0.986; CI 95% 0.974–0.997), conversely, PP typing can<br />
detect variants that reflect PFGE subtypes with over<br />
85% probablity (WC PP→PFGE =0.858; CI 95% 0.703–1.000)<br />
(Table VB).<br />
Detection <strong>of</strong> virulence factors. Multiple virulence<br />
factors produced by GAS such as superantigens, proteases<br />
and dNAses are linked to disease severity and<br />
clinical manifestations <strong>of</strong> infection (Bernal et al., 1999;<br />
Borek A.L. et al. 3<br />
Fig. 3A.<br />
Fraser et al., 2000; Pr<strong>of</strong>t et al., 2000). In particular, presence<br />
<strong>of</strong> speA gene is associated with streptococcal toxic<br />
like shock syndrome and scarlet fever (Hauser et al.,<br />
1991; Musser et al., 1991; Stevens et al., 1989; Yu and<br />
Ferretti, 1989) and smeZ participates in repression <strong>of</strong><br />
cognate anti-streptococcal responses (Unnikrishnan<br />
et al., 2002). Therefore, the detection <strong>of</strong> virulence factors<br />
can be used as a predictor <strong>of</strong> disease severity and<br />
as a diagnostic marker.<br />
We designed set <strong>of</strong> four, low volume, multiplex<br />
reac tions that allow simultaneous detection <strong>of</strong> 20 GAS<br />
virulence factors. Two multiplex reactions detect genes
3 Phages, ICEs, virulence factors in S. pyogenes<br />
197<br />
Fig. 3. Correlation between detected phage/ICE integration sites and virulence factors with M type (emm), sequence type (ST) and<br />
PFGE pattern (after (Szczypa et al., 2004)).<br />
A. A through K designations (with subtypes marked with arabic numerals) denote PFGE patterns detected by (Szczypa et al., 2004). Clusters and relationship<br />
between them are based on detected phages and ICE elements and were determined using Minimum Spanning Tree method <strong>of</strong> BioNumerics<br />
package by Applied Maths. Circle size indicates number <strong>of</strong> isolates in each PFGE group. B. Black rectangles denote phages/ICEs and virulence factors<br />
detected in analyzed strains. Strips <strong>of</strong> PFGE gels represent detected patterns and sub-patterns.<br />
encoding 11 superantigens: speL, speK, speM, speC,<br />
smeZ, speI and ssa, speA, speH, speG, speJ; one multiplex<br />
PCR detects dNases: chromosomal sdaB (named also<br />
streptodornase B, speF, MF, designated M5005_1738<br />
in strain MGAS5005) and phage encoded spd3<br />
(M5005_Spy1169), sdc, (sdalpha, SpyM3_1409), sdaD<br />
(M5005_1415); fourth multiplex reaction detects genes<br />
encoding proteases scpA, speB, mac, spyCEP and strepto-<br />
coccal inhibitor <strong>of</strong> complement sic. An example <strong>of</strong> the<br />
PCR products separation after detection <strong>of</strong> virulence fac-<br />
tors in four multiplex reactions is presented in Fig. 4 A-d.<br />
To assure that the possible negative result <strong>of</strong> amplification<br />
<strong>of</strong> multiplex reactions “Toxins MIx I” and<br />
“Toxins MIx II” was not caused by poor quality <strong>of</strong><br />
dNA, results <strong>of</strong> the reactions were always cross-checked<br />
with the results <strong>of</strong> other reactions and the detection <strong>of</strong><br />
chromosomally located genes served as positive control<br />
<strong>of</strong> dNA amplification.<br />
distribution <strong>of</strong> phage encoded virulence factors<br />
could be in majority <strong>of</strong> cases attributed to the detected<br />
integrated elements known to encode particular virulence<br />
factor (Beres and Musser, 2007). Therefore,<br />
detection <strong>of</strong> particular superantigens was routinely<br />
compared with detected phage pr<strong>of</strong>iles. Example <strong>of</strong><br />
such comparison can be seen in Fig. 5. Lack <strong>of</strong> detected<br />
products in multiplex reaction “Toxins MIx I” correlates<br />
with detection <strong>of</strong> elements integrated into sites F,<br />
G and T that do not encode superantigens. In case <strong>of</strong><br />
the same strain, detection spd3 gene correlates with the<br />
detection <strong>of</strong> the mobile element integrated into R site<br />
that can carry this type <strong>of</strong> dNAse. detection <strong>of</strong> virulence<br />
factors was validated using reference strains <strong>of</strong>
198<br />
Borek A.L. et al. 3<br />
Fig. 4. detection <strong>of</strong> twenty GAS virulence factors in randomly chosen strains.<br />
Each panel represents multiplex PCR reactions: A: dNAses, B: toxins I, C: proteases and sic, d: toxins II. 1.5% agarose/TBE, marker: GeneRuler<br />
100 bp Plus dNA Ladder (Fermentas).<br />
Fig. 5. Analysis <strong>of</strong> phage and virulence factors presence in a single M81 strain.<br />
Analysis <strong>of</strong> phage integration sites detected elements integrated into F, G, T and R chromosomal locations. Based on the genome sequences, the integration<br />
sites correspond with the elements not carrying any virulence factors (sites F, G and T) and encoding Spd3 dNase (site R) (Beres and Musser,<br />
2007). during the analysis <strong>of</strong> virulence factors, phage encoded spd3 dNAse was detected, as well as chromosomally encoded speG, speB, spyCEP, scpA,<br />
mac and sdaB.Marker: GeneRuler 100 bp Plus dNA Ladder (Fermentas).
3 Phages, ICEs, virulence factors in S. pyogenes<br />
199<br />
Fig. 6. detection <strong>of</strong> toxins and dNAses in sequenced reference GAS strains MGAS5005 (NC_007297.1), MGAS315 (NC_004070.1),<br />
MGAS10270 (NC_008022.1) and MGAS6180 (NC_007296.1).<br />
Each panel represents multiplex PCR reaction: A: toxins I , B:, toxins II C: dNAses. Chromosomally located speB, mac, spyCEP were detected in all<br />
cases sic gene was detected in MGAS5005 (data not shown). 1.5% agarose/TBE, marker: GeneRuler 100 bp Plus dNA Ladder (Fermentas).<br />
known genomic sequence and virulence factor pr<strong>of</strong>iles;<br />
the detected pr<strong>of</strong>ile matched predicted pr<strong>of</strong>iles (Fig. 6).<br />
Analysis <strong>of</strong> 656 diverse GAS strains detected<br />
95 virulence factor pr<strong>of</strong>iles among 40 emm types and<br />
185 phage pr<strong>of</strong>iles (SId = 0.943; CI 95% 0.936–0.951).<br />
The number <strong>of</strong> detected VF pr<strong>of</strong>iles is lower than phage<br />
pr<strong>of</strong>iles because phages encoding certain virulence factors,<br />
such as SpeC or SpeK can be carried by phages<br />
integrated in various sites (Beres and Musser, 2007),<br />
so single virulence factor pr<strong>of</strong>iles can mach different<br />
phage pr<strong>of</strong>iles.<br />
Based on SId calculations (Table V) and the fact<br />
that chromosomally encoded proteases SpeB, SpyCEP,<br />
ScpA and Mac are detected in virtually all strains, the<br />
detection <strong>of</strong> virulence factors can be simplified. Abbreviated<br />
method (without “proteases mix”) has identical<br />
resolution as not abbreviated method (Table V). The<br />
mix, however, can be used for the analysis <strong>of</strong> emm type<br />
1 strains to detect variants <strong>of</strong> sic gene. As an alternative<br />
approach, primers detecting sic gene can be added to<br />
mixes “toxins II” or “dNases”.<br />
The group <strong>of</strong> strains chosen to further test the<br />
method <strong>of</strong> virulence factor detection, was highly clonal<br />
based on previous analyses (Szczypa et al., 2004) and<br />
this work). Analysis <strong>of</strong> genes encoding virulence factors<br />
shows that these strains have potential to produce<br />
almost identical virulence factors within each PFGE<br />
group. In addition particular virulence factors within<br />
each group seem to be encoded by the same phage and<br />
differences in virulence factor pr<strong>of</strong>iles are reflected by<br />
subgroups <strong>of</strong> PFGE patterns (Fig. 3B).<br />
In a conclusion, we developed two inexpensive<br />
methods that allow easy differentiation between S. pyogenes<br />
strains. In addition, detection <strong>of</strong> superantigens<br />
and other virulence factors in clinical strains can provide<br />
invaluable information for further epidemiological<br />
investigations. Comparing with PFGE and MLST,<br />
the method is fast (2–3 h <strong>of</strong> PCR amplification with<br />
additional time for electrophoresis) and cost <strong>of</strong> multiplex<br />
PCR reactions is much lower than sequencing.<br />
The discriminatory power <strong>of</strong> the system used as typing<br />
method is comparable with PFGE, and it can be used<br />
when rapid strain comparison is required.<br />
Acknowledgments<br />
We are thankful to members <strong>of</strong> KORLd and KOROUN for<br />
strain collection and to Katarzyna Szczypa for critical reading <strong>of</strong><br />
the manuscript.<br />
The work was supported by: grant N N401 536140 from<br />
National Center for Science to W.H.; internal funding (dS.5.82<br />
and dS 5.67) to I.S.; National Program <strong>of</strong> Antibiotics Protection<br />
(NPOA-Moduł 1), unrestricted grant from GlaxoSmithKline Poland<br />
and <strong>Polish</strong> Ministry <strong>of</strong> Science grant for bacterial collection maintenance<br />
– Mikrobank.<br />
Literature<br />
Beall B., R. Facklam and T. Thompson. 1996. Sequencing emmspecific<br />
PCR products for routine and accurate typing <strong>of</strong> group A<br />
streptococci. J. Clin. Microbiol. 34: 953–958.<br />
Beall B., G. Gherardi, M. Lovgren, R.R. Facklam, B.A. Forwick<br />
and G.J. Tyrrell. 2000. emm and s<strong>of</strong> gene sequence variation in relation<br />
to serological typing <strong>of</strong> opacity-factor-positive group A streptococci.<br />
<strong>Microbiology</strong> 146: 1195–1209.<br />
Beres S.B., R.K. Carroll, P.R. Shea, I. Sitkiewicz, J.C. Martinez-<br />
Gutierrez, D.E. Low, A. McGeer, B.M. Willey, K. Green, G.J. Tyrrell,<br />
et al. 2010. Molecular complexity <strong>of</strong> successive bacterial epidemics<br />
deconvoluted by comparative pathogenomics. Proc. Natl. Acad. Sci.<br />
USA 107: 4371–4376.<br />
Beres S.B. and J.M. Musser. 2007. Contribution <strong>of</strong> exogenous<br />
genetic elements to the group A Streptococcus metagenome. PLoS<br />
One. 2: e800.
200<br />
Beres S.B., G.L. Sylva, D.E. Sturdevant, C.N. Granville, M. Liu,<br />
S.M. Ricklefs, A.R. Whitney, L.D. Parkins, N.P. Hoe, G.J. Adams,<br />
et al. 2004. Genome-wide molecular dissection <strong>of</strong> serotype M3<br />
group A Streptococcus strains causing two epidemics <strong>of</strong> invasive<br />
infections. Proc. Natl. Acad. Sci. USA. 101: 11833–11838.<br />
Bernal A., T. Pr<strong>of</strong>t, J.D. Fraser and D.N. Posnett. 1999. Superantigens<br />
in human disease. J. Clin. Immunol. 19: 149–157.<br />
Bert F., C. Branger and N. Lambert-Zechovsky. 1997. Pulsed-field<br />
gel electrophoresis is more discriminating than multilocus enzyme<br />
electrophoresis and random amplified polymorphic dNA analysis<br />
for typing pyogenic streptococci. Curr. Microbiol. 34: 226–229.<br />
Carapetis J.R., A.C. Steer, E.K. Mulholland and M. Weber. 2005.<br />
The global burden <strong>of</strong> group A streptococcal diseases. Lancet. Infect.<br />
Dis. 5: 685–694.<br />
Carrico J.A., C. Silva-Costa, J. Melo-Cristino, F.R. Pinto,<br />
H. de Lencastre, J.S. Almeida and M. Ramirez. 2006. Illustration<br />
<strong>of</strong> a common framework for relating multiple typing methods by<br />
application to macrolide-resistant Streptococcus pyogenes. J. Clin.<br />
Microbiol. 44: 2524–2532.<br />
Chiang-Ni C. and J.J. Wu. 2008. Effects <strong>of</strong> streptococcal pyrogenic<br />
exotoxin B on pathogenesis <strong>of</strong> Streptococcus pyogenes. J. Formos.<br />
Med. Assoc. 107: 677–685.<br />
Cleary P.P., E.L. Kaplan, C. Livdahl and S. Skjold. 1988. dNA<br />
fingerprints <strong>of</strong> Streptococcus pyogenes are M type specific. J. Infect.<br />
Dis. 158: 1317–1323.<br />
Cleary P.P., U. Prahbu, J.B. Dale, D.E. Wexler and J. Handley.<br />
1992. Streptococcal C5a peptidase is a highly specific endopeptidase.<br />
Infect. Immun. 60: 5219–5223.<br />
Commons R., S. Rogers, T. Gooding, M. Danchin, J. Carapetis,<br />
R. Robins-Browne and N. Curtis. 2008. Superantigen genes in<br />
group A streptococcal isolates and their relationship with emm<br />
types. J. Med. Microbiol. 57: 1238–1246.<br />
Courtney H.S., D.L. Hasty and J.B. Dale. 2002. Molecular mechanisms<br />
<strong>of</strong> adhesion, colonization, and invasion <strong>of</strong> group A streptococci.<br />
Ann. Med. 34: 77–87.<br />
Cunningham M.W. 2000. Pathogenesis <strong>of</strong> group A streptococcal<br />
infections. Clin. Microbiol. Rev. 13: 470–511.<br />
Edwards R.J., G.W. Taylor, M. Ferguson, S. Murray, N. Rendell,<br />
A. Wrigley, Z. Bai, J. Boyle, S.J. Finney, A. Jones, et al. 2005.<br />
Specific C-terminal cleavage and inactivation <strong>of</strong> interleukin-8 by<br />
invasive disease isolates <strong>of</strong> Streptococcus pyogenes. J. Infect. Dis. 192:<br />
783–790.<br />
Enright M.C., B.G. Spratt, A. Kalia., J.H. Cross and D.E. Bessen.<br />
2001. Multilocus sequence typing <strong>of</strong> Streptococcus pyogenes and<br />
the relationships between emm type and clone. Infect. Immun. 69:<br />
2416–2427.<br />
Facklam R., B. Beall, A. Efstratiou, V. Fischetti, D. Johnson,<br />
E. Kaplan, P. Kriz, M. Lovgren, D. Martin, B. Schwartz, et al.<br />
1999. Emm typing and validation <strong>of</strong> provisional M types for group<br />
A streptococci. Emerg. Infect. Dis. 5: 247–253.<br />
Ferretti J.J., W.M. McShan, D. Ajdic, D.J. Savic, G. Savic, K. Lyon,<br />
C. Primeaux, S. Sezate, A.N. Suvorov, S. Kenton, et al. 2001. Complete<br />
genome sequence <strong>of</strong> an M1 strain <strong>of</strong> Streptococcus pyogenes.<br />
Proc. Natl. Acad. Sci. USA 98: 4658–4663.<br />
Fraser J., V. Arcus, P. Kong, E. Baker and T. Pr<strong>of</strong>t. 2000. Superantigens<br />
– powerful modifiers <strong>of</strong> the immune system. Mol. Med.<br />
Today 6: 125–132.<br />
Green N.M., S. Zhang, S.F. Porcella, M.J. Nagiec, K.D. Barbian,<br />
S.B. Beres, R.B. LeFebvre and J.M. Musser. 2005. Genome<br />
sequence <strong>of</strong> a serotype M28 strain <strong>of</strong> group a streptococcus: potential<br />
new insights into puerperal sepsis and bacterial disease specificity.<br />
J. Infect. Dis. 192: 760–770.<br />
Hartas J., M. Hibble and K.S. Sriprakash. 1998. Simplification <strong>of</strong><br />
a locus-specific dNA typing method (Vir typing) for Streptococcus<br />
pyogenes. J. Clin. Microbiol. 36: 1428–1429.<br />
Borek A.L. et al. 3<br />
Hauser A.R., D.L. Stevens, E.L. Kaplan and P.M. Schlievert.<br />
1991. Molecular analysis <strong>of</strong> pyrogenic exotoxins from Streptococcus<br />
pyogenes isolates associated with toxic shock-like syndrome. J. Clin.<br />
Microbiol. 29: 1562–1567.<br />
Herschleb J., G. Ananiev and D.C. Schwartz. 2007. Pulsed-field<br />
gel electrophoresis. Nat. Protoc. 2: 677–684.<br />
Hoe N., K. Nakashima, D. Grigsby, X. Pan, S.J. Dou, S. Naidich,<br />
M. Garcia, E. Kahn, D. Bergmire-Sweat and J.M. Musser. 1999.<br />
Rapid molecular genetic subtyping <strong>of</strong> serotype M1 group A Streptococcus<br />
strains. Emerg. Infect. Dis. 5: 254–263.<br />
Koller T., A.G. Manetti, B. Kreikemeyer, C. Lembke, I. Margarit,<br />
G. Grandi and A. Podbielski. 2010. Typing <strong>of</strong> the pilus-proteinencoding<br />
FCT region and bi<strong>of</strong>ilm formation as novel parameters<br />
in epidemiological investigations <strong>of</strong> Streptococcus pyogenes isolates<br />
from various infection sites. J. Med. Microbiol. 59: 442–452.<br />
Kurupati P., C.E. Turner, I. Tziona, R.A. Lawrenson, F.M. Alam,<br />
M. <strong>No</strong>hadani, G.W. Stamp, A.S. Zinkernagel, V. Nizet, R.J. Edward,<br />
et al. 2010. Chemokine-cleaving Streptococcus pyogenes protease<br />
SpyCEP is necessary and sufficient for bacterial dissemination<br />
within s<strong>of</strong>t tissues and the respiratory tract. Mol. Microbiol. 76:<br />
1387–1397.<br />
Lintges M., S. Arlt, P. Uciechowski, B. Plumakers, R.R. Reinert,<br />
A. Al-Lahham, R. Lutticken and L. Rink. 2007. A new closed-tube<br />
multiplex real-time PCR to detect eleven superantigens <strong>of</strong> Streptococcus<br />
pyogenes identifies a strain without superantigen activity. Int.<br />
J. Med. Microbiol. 297: 471–478.<br />
Matsumoto M., N.P. Hoe, M. Liu, S.B. Beres, G.L. Sylva,<br />
C.M. Brandt, G. Haase and J.M. Musser. 2003. Intrahost sequence<br />
variation in the streptococcal inhibitor <strong>of</strong> complement gene in<br />
patients with human pharyngitis. J. Infect. Dis. 187: 604–612.<br />
Maxted W.R., J.P. Widdowson, C.A. Fraser, L.C. Ball and<br />
D.C. Bassett. 1973. The use <strong>of</strong> the serum opacity reaction in the<br />
typing <strong>of</strong> group-A streptococci. J. Med. Microbiol. 6: 83–90.<br />
Moody M.D., J. Padula, D. Lizana and C.T. Hall. 1965. Epidemiologic<br />
Characterization <strong>of</strong> Group A streptococci by T-Agglutination<br />
and M-Precipitation Tests in the Public Health Laboratory. Health.<br />
Lab. Sci. 2: 149–162.<br />
Musser J.M., A.R. Hauser, M.H. Kim, P.M. Schlievert, K. Nelson<br />
and R.K. Selander. 1991. Streptococcus pyogenes causing toxicshock-like<br />
syndrome and other invasive diseases: clonal diversity<br />
and pyrogenic exotoxin expression. Proc. Natl. Acad. Sci. USA 88:<br />
2668–2672.<br />
Nandi S., N.K. Ganguly, R. Kumar, D.K. Bakshi, V.S. Vivek Sagar<br />
and A. Chakraborti. 2008. Genotyping <strong>of</strong> group A Streptococcus by<br />
various molecular methods. Indian. J. Med. Res. 127: 71–77.<br />
Oehmcke S., O. Shannon, M. Morgelin and H. Herwald. 2010.<br />
Streptococcal M proteins and their role as virulence determinants.<br />
Clin. Chim. Acta 411: 1172–1180.<br />
Perez-Caballero D., I. Garcia-Laorden, G. Cortes, M.R. Wessels,<br />
S.R. de Cordoba and S. Alberti. 2004. Interaction between complement<br />
regulators and Streptococcus pyogenes: binding <strong>of</strong> C4b-binding<br />
protein and factor H/factor H-like protein 1 to M18 strains involves<br />
two different cell surface molecules. J. Immunol. 173: 6899–6904<br />
Pinto F.R., J. Melo-Cristino and M. Ramirez. 2008. A confidence<br />
interval for the wallace coefficient <strong>of</strong> concordance and its application<br />
to microbial typing methods. PLoS One. 3: e3696.<br />
Pr<strong>of</strong>t T., S.L. M<strong>of</strong>fatt, K.D. Weller, A. Paterson, D. Martin and<br />
J.D. Fraser. 2000. The streptococcal superantigen SMEZ exhibits<br />
wide allelic variation, mosaic structure, and significant antigenic<br />
variation. J. Exp. Med. 191: 1765–1776.<br />
Richardson L.J., S.Y. Tong, R.J. Towers, F. Huygens, K. McGregor,<br />
P.K. Fagan, B.J. Currie, J.R. Carapetis and P.M. Giffard. 2010.<br />
Preliminary validation <strong>of</strong> a novel high resolution melt-based typing<br />
method based on the multilocus sequence typing scheme <strong>of</strong><br />
Streptococcus pyogenes. Clin. Microbiol. Infect. in press.
3 Phages, ICEs, virulence factors in S. pyogenes<br />
201<br />
Schmitz F.J., A. Beyer, E. Charpentier, B.H. <strong>No</strong>rmark, M. Schade,<br />
A.C. Fluit, D. Hafner and R. <strong>No</strong>vak. 2003. Toxin-gene pr<strong>of</strong>ile<br />
hetero geneity among endemic invasive European group A streptococcal<br />
isolates. J. Infect. Dis. 188: 1578–1586.<br />
Seppala H., J. Vuopio-Varkila, M. Osterblad, M. Jahkola,<br />
M. Rummukainen, S.E. Holm and P. Huovinen. 1994. Evaluation<br />
<strong>of</strong> methods for epidemiologic typing <strong>of</strong> group A streptococci.<br />
J. Infect. Dis. 169: 519–525.<br />
Slater G.W. 2009. dNA gel electrophoresis: the reptation model(s).<br />
Electrophoresis 30 Suppl. 1: S181–187.<br />
Smeesters P. R., D.J. McMillan and K.S. Sriprakash. 2010. The<br />
streptococcal M protein: a highly versatile molecule. Trends. Microbiol.<br />
18: 275–282.<br />
Stanley J., D. Linton, M. Desai, A. Efstratiou and R. George. 1995.<br />
Molecular subtyping <strong>of</strong> prevalent M serotypes <strong>of</strong> Streptococcus pyogenes<br />
causing invasive disease. J. Clin. Microbiol. 33: 2850–2855.<br />
Stevens D.L., M.H. Tanner, J. Winship, R. Swarts, K.M. Ries,<br />
P.M. Schlievert and E. Kaplan. 1989. Severe group A streptococcal<br />
infections associated with a toxic shock-like syndrome and scarlet<br />
fever toxin A. N. Engl. J. Med. 321: 1–7<br />
Sumby P., K.D. Barbian, D.J. Gardner, A.R. Whitney, D.M. Welty,<br />
R.D. Long, J.R. Bailey, M.J. Parnell, N.P. Hoe, G.G. Adams, et al.<br />
2005. Extracellular deoxyribonuclease made by group A Streptococcus<br />
assists pathogenesis by enhancing evasion <strong>of</strong> the innate immune<br />
response. Proc. Natl. Acad. Sci. USA 102: 1679–1684.<br />
Sumby P., S. Zhang, A.R. Whitney, F. Falugi, G. Grandi,<br />
E.A. Graviss, F.R. Deleo and J.M. Musser. 2008. A chemokinedegrading<br />
extracellular protease made by group A Streptococcus<br />
alters pathogenesis by enhancing evasion <strong>of</strong> the innate immune<br />
response. Infect. Immun. 76: 978–985.<br />
Swift H.F., A.T. Wilson and R.C. Lancefield. 1943. Typing Group A<br />
Hemolytic streptococci by M precipitin reactions in capillary<br />
pipettes. J. Exp. Med. 78: 127–133.<br />
Szczypa K., E. Sadowy, R. Izdebski and W. Hryniewicz. 2004.<br />
A rapid increase in macrolide resistance in Streptococcus pyogenes<br />
isolated in Poland during 1996–2002. J. Antimicrob. Chemother. 54:<br />
828–831.<br />
Tart A.H., M.J. Walker and J.M. Musser. 2007. New understanding<br />
<strong>of</strong> the group A Streptococcus pathogenesis cycle. Trends. Microbiol.<br />
15: 318–325.<br />
Tenover F.C., R.D. Arbeit, R.V. Goering, P.A. Mickelsen,<br />
B.E. Murray, D.H. Persing and B. Swaminathan. 1995. Interpreting<br />
chromosomal dNA restriction patterns produced by pulsedfield<br />
gel electrophoresis: criteria for bacterial strain typing. J. Clin.<br />
Microbiol. 33: 2233–2239.<br />
Terao Y., Y. Mori, M. Yamaguchi, Y. Shimizu, K. Ooe, S. Hamada<br />
and S. Kawabata. 2008. Group A streptococcal cysteine protease<br />
degrades C3 (C3b) and contributes to evasion <strong>of</strong> innate immunity.<br />
J. Biol. Chem. 283: 6253–6260.<br />
Unnikrishnan M., D.M. Altmann, T. Pr<strong>of</strong>t, F. Wahid, J. Cohen,<br />
J.D. Fraser and S. Sriskandan. 2002. The bacterial superantigen<br />
streptococcal mitogenic exotoxin Z is the major immunoactive agent<br />
<strong>of</strong> Streptococcus pyogenes. J. Immunol. 169: 2561–2569.<br />
von U. Pawel-Rammingen, B.P. Johansson and L. Bjorck. 2002.<br />
IdeS, a novel streptococcal cysteine proteinase with unique specificity<br />
for immunoglobulin G. Embo. J. 21: 1607–1615.<br />
Walker M.J., A. Hollands, M.L. Sanderson-Smith, J.N. Cole,<br />
J.K. Kirk, A. Henningham, J.D. McArthur, K. Dinkla, R.K. Aziz,<br />
R.G. Kansal, et al. 2007. dNase Sda1 provides selection pressure<br />
for a switch to invasive group A streptococcal infection. Nat. Med.<br />
13: 981–985.<br />
C.E. Yu and J.J. Ferretti. 1989. Molecular epidemiologic analysis<br />
<strong>of</strong> the type A streptococcal exotoxin (erythrogenic toxin) gene<br />
(speA) in clinical Streptococcus pyogenes strains. Infect. Immun. 57:<br />
3715–3719.<br />
Zinkernagel A.S., A.M. Timmer, M.A. Pence, J.B. Locke,<br />
J.T. Buchanan, C.E. Turner, I. Mishalian, S. Sriskandan, E. Hanski,<br />
and V. Nizet. 2008. The IL-8 protease SpyCEP/ScpC <strong>of</strong> group A<br />
Streptococcus promotes resistance to neutrophil killing. Cell. Host.<br />
Microbe. 4: 170–178.
<strong>Polish</strong> <strong>Journal</strong> <strong>of</strong> <strong>Microbiology</strong><br />
2011, Vol. 60, <strong>No</strong> 3, 203–207<br />
ORIGINAL PAPER<br />
Expression <strong>of</strong> Helicobacter pylori ggt Gene in Baculovirus Expression System<br />
and Activity Analysis <strong>of</strong> its Products<br />
Introduction<br />
Helicobacter pylori is a common human pathogen<br />
that colonizes the gastric mucosa. Infection puts the<br />
individual at greater risk for developing gastritis, peptic<br />
ulcer disease, and gastric cancer (Marshall and Warren,<br />
1984; Bjorkholm et al., 2003; Sharma and Vakil, 2003).<br />
H. pylori produces a number <strong>of</strong> virulence factors that<br />
enable its pathogenesis. One <strong>of</strong> these is an enzyme,<br />
γ-glutamyltranspeptidase (GGT, EC 2.3.2.2), in the<br />
periplasm, which is involved in induction <strong>of</strong> host cell<br />
apoptosis (Shibayama et al., 2003) and plays an important<br />
role in colonization by H. pylori (Chevalier et al.,<br />
1999; McGovern et al., 2001).<br />
GGTs are fairly ubiquitous with homologues observed<br />
in all kingdoms, and are generally considered to<br />
be involved in the metabolism <strong>of</strong> glutathione and in<br />
the salvaging <strong>of</strong> cysteine (Hanigan and Ricketts, 1993;<br />
Ikeda and Taniguchi, 2005). Although distant GGTs<br />
<strong>of</strong>ten share considerable sequence identity, significant<br />
catalytic differences exist between bacterial and nonbacterial<br />
homologues (Ikeda et al., 1995; Ikeda et al.,<br />
1996). Mammalian GGTs are embedded in the plasma<br />
membrane by a single N-terminal transmembrane<br />
anchor and are heterologously glycosylated, bacterial<br />
homologs are soluble and localized to the periplasmic<br />
space. H. pylori GGT (HpGT) is a member <strong>of</strong> the<br />
N-terminal nucleophile hydrolase superfamily, and is<br />
translated as an inactive proenzyme that undergoes<br />
MEI KONG, MING xU, YA-LONG HE and YOU-LI ZHANG*<br />
department <strong>of</strong> Gastroenterology, the Affiliated Hospital <strong>of</strong> Jiangsu University<br />
Received 21 december 2010, revised 26 June 2011, accepted 6 July 2011<br />
Abstract<br />
The γ-glutamyltranspeptidase (GGT) <strong>of</strong> Helicobacter pylori (HpGT) is a newly found virulence factor. In an approach to gain insight into the<br />
gene function, the four domains <strong>of</strong> the HpGT were cloned and expressed in baculovirus expression system. The results <strong>of</strong> a functional assay<br />
showed that the HpGT products acted as GGT, even when the N-terminal 380 amino acids were deleted. However, only the full length open<br />
reading frame (ORF) <strong>of</strong> the HpGT gene was apparently effective on cell growth. This result indicated that the products <strong>of</strong> the full length ORF<br />
might have an important role in gastric carcinogenesis. In this paper, we are the first to report that changes <strong>of</strong> mitochondrial membrane<br />
potential can be detected using 5, 5’, 6, 6’-tetrachloro-1, 1’, 3, 3’-tetraethylbenzimidazole carbocyanine iodide (JC-1) staining in insect cells.<br />
K e y w o r d s: glutamyltranspeptidase; Helicobacter pylori; membrane potential; virulence factor<br />
autoprocessing to become an active enzyme (Brannigan<br />
et al., 1995). despite its demonstrated involvement in<br />
H. pylori colonization, persistence, and disease progression<br />
(Boanca et al., 2007), the biochemical characterization<br />
<strong>of</strong> HpGT is still limited (Coloma and Pitot 1986).<br />
Although the general features <strong>of</strong> the function <strong>of</strong> HpGT<br />
can be inferred based on its classification as an N-terminal<br />
nucleophile hydrolase, many mechanistic details<br />
<strong>of</strong> the autoactivation and catalytic function <strong>of</strong> HpGT<br />
have not been addressed. In this paper, the domains <strong>of</strong><br />
the HpGT gene were expressed in baculovirus expression<br />
system and subsequently analyzed.<br />
Experimental<br />
Materials and Methods<br />
The E. coli dH10Bac/BmNPV cell line was provided<br />
by Pr<strong>of</strong>essor E.Y. Park (department <strong>of</strong> Applied Biological<br />
Chemistry, Faculty <strong>of</strong> Agriculture, Shizuoka University,<br />
Shizuoka, Japan).<br />
FuGENE TM 6 transfection reagent was from Roche<br />
Company. Grace’s insect cell culture medium (GIBCO)<br />
was purchased from Invitrogen. The B. mori cell line<br />
BmN (originated from ovary) was preserved in our<br />
laboratory and cultured at 27°C in Grace’s insect cell<br />
culture medium.<br />
H. pylori culture. H. pylori strain was isolated from<br />
clinic tissues. The strains were grown on horse blood<br />
* Corresponding author: Y-L. Zhang, department <strong>of</strong> Gastroenterology, the Affiliated Hospital <strong>of</strong> Jiangsu University; Jiefang Road 438,<br />
Zhenjiang 212001, Jiangsu Province, China; e-mail: youlizhang1972@126.com
204<br />
agar plates (Oxoid Base) supplemented with vancomycin<br />
(5 mg/L), polymyxin B (2500 U/L), trimethoprim<br />
(5 mg/L) and amphotericin B (4 mg/L). Plates were<br />
incubated in an anaerobic jar with a microaerobic gas<br />
in the presence <strong>of</strong> a catalyst. E. coli strain dH5α was<br />
used as hosts for plasmid cloning experiments, and was<br />
grown in L-broth (10 g <strong>of</strong> tryptone, 5 g <strong>of</strong> yeast extract<br />
and 5 g <strong>of</strong> NaCl per litre, pH 7.0) or on L-agar plates<br />
(1.5% agar) at 37°C.<br />
Cloning <strong>of</strong> the domains <strong>of</strong> HpGT gene. According<br />
to the HpGT gene structure and the dNA sequence<br />
in GenBank (Access <strong>No</strong>: NC_000921), four domains<br />
were designed for the functional analysis, including full<br />
length <strong>of</strong> the HpGT ORF (open reading frame), HpGTd30a,<br />
HpGT-d80a, and HpGT-d380a (deletion <strong>of</strong> 30,<br />
80, 380 amino acids in the N-terminal, respectively).<br />
The specific primers for amplification <strong>of</strong> the four fragments<br />
are shown in Table I.<br />
The PCR conditions for amplification <strong>of</strong> the HpGT<br />
fragments were: 1 cycle at 94°C for 5 min; 35 cycles at<br />
94°C for 45 s, 55°C for 40 s, 72°C for 3 min; and 1 cycle<br />
at 72°C for 10 min.<br />
Construction <strong>of</strong> recombinant donor plasmids.<br />
According to the HpGT protein structure, we designed<br />
four fragments (full length, d30a, d80a, and d380a) to<br />
analyze enzymic activity. After PCR, four fragments<br />
were obtained (Fig. 1a). Sequencing results indicated<br />
that no no-sense mutations occurred. The fragments<br />
were inserted into the baculovirus transfer vector<br />
pFastBac1. Furthermore, to detect the expression <strong>of</strong><br />
the fragments, the fusion proteins with the eGFP gene<br />
were constructed in the C-terminal <strong>of</strong> the fragments.<br />
The dNA <strong>of</strong> baculovirus donor plasmid pFastBac1<br />
was digested with EcoR I and Xho I, and ligated to the<br />
HpGT fragments digested with the same enzymes,<br />
respectively. To generate fusing ORFs with eGFP gene,<br />
the eGFP fragment was inserted into the constructed<br />
plasmids containing the HpGT fragments by digestion<br />
with Xho I and Hind III as well.<br />
Isolation <strong>of</strong> recombinant bacmid and baculoviruses.<br />
The recombinant bacmids were transformed<br />
into E. coli dH10Bac/BmNPV where transposition<br />
occurred. By screening the transformed clones, Bacmid<br />
Mei Kong et al. 3<br />
Table I<br />
The primers for amplification <strong>of</strong> HpGT fragments<br />
Fragmnent Primer Length (bp)<br />
Full length F: cgc gaa ttc atg aga cgg agt ttt tta aaa acg (EcoR I) 1704<br />
d30a F: cgc gaa ttc atg ccc att aaa aac act aaa gtg (EcoR I) 1614<br />
d80a F: cgc gaa ttc atg aat att ggt ggg ggg ggt ttt (EcoR I) 1464<br />
d380a F: cgc gaa ttc atg acg cat tat tct gta gcg ga (EcoR I) 564<br />
R: gac ctc gag aaa ttc ttt cct tgg atc cgt t (Xho I)<br />
eGFP F: gac ctc gag atg gtg agc aag ggc gag ga (Xho I) 693<br />
R: cgc aag ctt tta ctt gta cag ctc gtc ca (Hind I)<br />
dNA was isolated using the FlexiPrep kit (Amersham<br />
Pharmacia Biotech) and then analyzed by PCR with<br />
the M13 primers (Su et al., 2009). The PCR conditions<br />
were 1 cycle at 94°C for 5 min; 35 cycles at 94°C for 45 s,<br />
55°C for 45 s, and 72°C for 5 min; and 1 cycle at 72°C<br />
for 10 min. Recombinant bacmid dNA confirmed by<br />
PCR was transfected into Bm cells using transfection<br />
reagent according to the manual.<br />
γ-Glutamyltranspeptidase activity. After infection<br />
with the recombinant viruses p.i. 60 h, the BmN cells<br />
were collected and lysed. The lysate with 100 µg total<br />
protein was used for γ-Glutamyltranspeptidase activity<br />
assay. Qualitative detection <strong>of</strong> the GGT enzyme was<br />
achieved by a Clinic Biochemistry detector (Olympus<br />
AU2700), the tests were repeated 3 times.<br />
Western-blot. To comfirm the protein expression,<br />
the products <strong>of</strong> fusing gene (the HpGT fragment with<br />
eGFP) were detected by Western-blot. The first antibody<br />
was <strong>of</strong> anti-eGFP with a dilution <strong>of</strong> 1:1000.<br />
Analysis <strong>of</strong> mitochondrial membrane potential.<br />
After infected with the baculoviruses containing the<br />
HpGT fragment, respectively, mitochondrial membrane<br />
potential <strong>of</strong> the BmN cells was observed by fluorescence<br />
microscopy with JC-1 staining. The staining process<br />
was carried out by the protocol <strong>of</strong> the JC-1 Mitochondrial<br />
Membrane Potential detection Kit (Biotium, Inc.,<br />
Cat: 30001). In brief, the living cells were stained red,<br />
and when the cells were going to die <strong>of</strong> apoptosis, the<br />
cells were stained green (Bowser et al., 1998).<br />
MTT assay. The MTT assay was performed using<br />
the cell proliferation kit I MTT (Roche Co.) according<br />
to the manufacturer’s protocol. In brief, after diverse<br />
treatments for 24 h, the gastric cancer cells (BGC-823)<br />
were subsequently prepared for assays. The absorbance<br />
was determined at 570 nm by an ELISA reader<br />
(Bio-tech Synergy HT). Each approach was replicated<br />
6 times and repeated 3 times with similar results.<br />
Results and discussion<br />
Identification and harvest <strong>of</strong> the recombinant<br />
bacmids. The HpGT fragments were amplified from<br />
Hp genomic dNA by PCR, and digested with EcoR I
3 Function <strong>of</strong> H. pylori ggt domains<br />
205<br />
and Xho I to be inserted into the baculovirus transfer<br />
vector digested with the same enzymes. After the plasmids<br />
were transferred into the Bm-dH10 bacteria, the<br />
bacmid dNAs were extracted, respectively. To confirm<br />
the fragment inserts, PCR was used to amplify the fragments.<br />
The results indicated that the HpGT fragments<br />
were inserted into the viral genome.<br />
To construct the fusing fragments with eGFP, the<br />
eGFP fragments were amplified and were digested with<br />
Xho I and Hind III, and then ligated to the recombinant<br />
vectors containing the HpGT fragment.<br />
A<br />
B<br />
Fig. 2a and 2b. detection <strong>of</strong> expression products <strong>of</strong> the fusing fragment<br />
<strong>of</strong> ggt and gfp in baculovirus by Western-blot.<br />
The lysates <strong>of</strong> BmN cells and <strong>of</strong> cells infected with wild baculovirus<br />
(BmNPV) were the negative controls. In Figure 2a, the products <strong>of</strong> the<br />
full length ggt fusing with eGFP gene were detected, and in Figure 2b, the<br />
products <strong>of</strong> the fragments <strong>of</strong> ggt fusing with eGFP gene were detected.<br />
Fig. 1. Observation <strong>of</strong> HpGT products fusing<br />
with eGFP under fluorescent microscope<br />
(200-fold).<br />
The GGT-d380a-eGFP products had different<br />
location in BmN cells. Bm-eGFP recombinant<br />
baculovirus, with egfp gene instead <strong>of</strong> the polyhedron<br />
gene, was a control.<br />
The recombinant bacmid dNAs were transfected<br />
into BmN cells to generate budded viruses. After 72 h<br />
infection, the symptoms <strong>of</strong> viral infection were observed<br />
using an inverted phase microscope and the medium<br />
was collected as viral stock. Green fluorescence was<br />
observed in the infected cells when the HpGT fragments<br />
fusing eGFP were expressed (Fig. 1).<br />
Confirmation <strong>of</strong> fusing expression. At <strong>of</strong> yet, the<br />
HpGT antibody has not been raised. Expression <strong>of</strong><br />
the HpGT fragments was tested by tagging with eGFP<br />
gene. Using eGFP antibody, expression was confirmed<br />
by Western blot (Fig. 2a and 2b). After that, the location<br />
<strong>of</strong> the HpGT fragments in the cells was observed under<br />
an inverted fluorescent microscope. Interestingly, the<br />
fragments that lost N-terminal 380aa were concentrated<br />
in the cytoplasm (Fig. 1).<br />
GGT activity assay. The test <strong>of</strong> GGT activity assay<br />
showed that all the fragments used in this paper had<br />
GGT activity, even after deleting the N-terminal 380aa<br />
Fig. 3. GGT activity detection <strong>of</strong> the expression products<br />
<strong>of</strong> the fusing fragment <strong>of</strong> the ggt in baculovirus.<br />
The Bm-GFP virus was a negative control.
206<br />
(Fig. 3). The result indicated that the enzyme activity<br />
center was located in the C-terminal <strong>of</strong> the protein and<br />
the N-terminal <strong>of</strong> HpGT might have other functions.<br />
Mitochondrial membrane potential assay. To know<br />
the effect <strong>of</strong> the HpGT products on the cell cycle, the<br />
mitochondrial membrane potential <strong>of</strong> the infected<br />
BmN cells was compared. The results demonstrated that<br />
infection <strong>of</strong> HpGT fragments with full length, deleting<br />
30aa and 80aa changed the mitochondrial membrane<br />
potential significantly, but the wild type virus and the<br />
HpGT fragment with deletion <strong>of</strong> 380aa did not change<br />
Fig. 5. Growth inhibition assay <strong>of</strong> BGC-823 cells (from gastric cancer)<br />
induced with the GGT expression products using MTT method.<br />
Only the products <strong>of</strong> the full length GGT and that fusing with GFP affected<br />
cell activity at 24 hours time point.Table I. The primers for amplification<br />
<strong>of</strong> HpGT fragments<br />
Mei Kong et al. 3<br />
Fig. 4. detection <strong>of</strong> the membrane voltage<br />
change <strong>of</strong> the BmN cells post infection<br />
48 hours by dyeing with the reagent <strong>of</strong> 5,<br />
5’, 6, 6’-tetrachloro-1, 1’, 3, 3’-tetraethyl<br />
benzimidazol carbocyanine iodide (JC-1).<br />
it apparently. This evidence denotes that the N-terminal<br />
domain is related to cell function (Fig. 4). This is the<br />
first report using JC-1 staining to detect cell changes<br />
in insect BmN cells.<br />
Effect <strong>of</strong> tumor cell growth. To check the impact<br />
<strong>of</strong> the HpGT products on cell survival, stomach cancer<br />
cells (BGC-823) were treated with the expression<br />
compound. Analysis <strong>of</strong> cell viability by MTT assay indicated<br />
that the cell growth was inhibited significantly<br />
by HpGT full length products at 24 h. However, when<br />
the incubation time lasted 48 h, cell growth showed<br />
recovery. These results indicate that only the full length<br />
HpGT might have the activity to inhibit cell growth<br />
(Fig. 5). Furthermore, the effect might be reversible.<br />
In this paper, we identified the HpGT activity and<br />
effect on cell growth using baculovirus expression system.<br />
Although the C-terminal domain <strong>of</strong> the HpGT has GGT<br />
activity, only the full length ORF affected cell growth.<br />
This indicates that the products <strong>of</strong> the full length ORF<br />
may have an important role in gastric carcinogenesis.<br />
Acknowledgements<br />
This work was funded by the Science and Technology development<br />
Foundation <strong>of</strong> Jiangsu University medicine and clinic<br />
(JLY2010106).<br />
Literature<br />
Bjorkholm B., P. Falk, L. Engstrand and O. Nyren. 2003. Helico bacter<br />
pylori: resurrection <strong>of</strong> the cancer link. J. Intern. Med. 253: 102–119.<br />
Boanca G., A. Sand, T. Okada, H. Suzuki, H. Kumagai, K. Fukuyama<br />
and J.J. Barycki. 2007. Autoprocessing <strong>of</strong> Helicobacter pylori
3 Function <strong>of</strong> H. pylori ggt domains<br />
207<br />
γ-Glutamyltranspeptidase Leads to the Formation <strong>of</strong> a Threonine-<br />
Threonine Catalytic dyad. J. Biol. Chem. 282: 534–541.<br />
Bowser D.N., T. Minamikawa, P. Nagley and D.A. Williams. 1998.<br />
Role <strong>of</strong> mitochondria in calcium regulation <strong>of</strong> spontaneously contracting<br />
cardiac muscle cells. Biophys. J. 75: 2004–2014.<br />
Brannigan J.A., G. Dodson, H.J. Duggleby, P.C. Moody, J.L. Smith,<br />
D.R. Tomchick and A.G. Murzin. 1995. A protein catalytic framework<br />
with an N-terminal nucleophile is capable <strong>of</strong> self-activation.<br />
Nature 378, 416–419.<br />
Chevalier C., J.M. Thiberge, R.L. Ferrero and A. Labigne. 1999.<br />
Essential role <strong>of</strong> Helicobacter pylori gamma-glutamyltranspeptidase<br />
for the colonization <strong>of</strong> the gastric mucosa <strong>of</strong> mice. Mol. Microbiol.<br />
31: 1359–1372.<br />
Coloma J. and H.C., Pitot. 1986. Characterization and sequence<br />
<strong>of</strong> cdNA clone <strong>of</strong> gamma-glutamyltranspeptidase. Nucleic. Acids.<br />
Res. 14: 1393–1403.<br />
Hanigan M.H. and W.A. Ricketts. 1993. Extracellular glutathione<br />
is a source <strong>of</strong> cysteine for cells that express gamma-glutamyl transpeptidase.<br />
Biochemistry 32: 6302–6306.<br />
Ikeda Y., J. Fujii and N. Taniguchi. 1996. Effects <strong>of</strong> substitutions<br />
<strong>of</strong> the conserved histidine residues in human γ-glutamyl transpeptidase.<br />
J. Biochem. 119: 1166–1170.<br />
Ikeda Y., J. Fujii, M.E. Anderson, N. Taniguchi and A. Meister.<br />
1995. Involvement <strong>of</strong> Ser-451 and Ser-452 in the catalysis <strong>of</strong><br />
human gamma-glutamyl transpeptidase. J. Biol. Chem. 270: 22223–<br />
–22228.<br />
Ikeda Y. and N. Taniguchi. 2005. Gene expression <strong>of</strong> gamma-glutamyltranspeptidase.<br />
Methods. Enzymol. 401: 408–425.<br />
Marshall B.J. and J.R. Warren. 1984. Unidentified curved bacilli in<br />
the stomach <strong>of</strong> patients with gastritis and peptic ulceration. Lancet<br />
1: 1311–1315.<br />
McGovern K.J., T.G. Blanchard, J.A. Gutierrez, S.J. Czinn,<br />
S. Krakowka and P. Youngman. 2001. Gamma-glutamyltransferase<br />
is a Helicobacter pylori virulence factor but is not essential for colonization.<br />
Infect. Immun. 69: 4168–4173.<br />
Sharma P. and N. Vakil. 2003. Review article: Helicobacter pylori<br />
and reflux disease. Aliment. Pharmacol. Ther. 17: 297–305.<br />
Shibayama K., K. Kamachi, N. Nagata, T. Yagi, T. Nada, Y. Doi,<br />
N. Shibata, K. Yokoyama, K. Yamane, H. Kato, Y. Iinuma and<br />
Y. Arakawa. 2003. A novel apoptosis-inducing protein from Helicobacter<br />
pylori. Mol. Microbiol. 47: 443–451.<br />
Su W., W. Shen, B. Li, Y. Wu, G. Gao and W. Wang. 2009. A novel<br />
way to purify recombinant baculoviruses by using bacmid. Bioscience<br />
report 29: 71–75
<strong>Polish</strong> <strong>Journal</strong> <strong>of</strong> <strong>Microbiology</strong><br />
2011, Vol. 60, <strong>No</strong> 3, 209–212<br />
ORIGINAL PAPER<br />
Extracellular Xylanase Production by Fusarium species in Solid State Fermentation<br />
MOHAMMEd IMAd EddIN ARABI, YASSER BAKRI* and MOHAMMEd JAWHAR<br />
department <strong>of</strong> Molecular Biology and Biotechnology, damascus, Syria<br />
Received 4 May 2011, revised 11 July 2011, accepted 15 July 2011<br />
Introduction<br />
To date xylanase has gained increasing attention<br />
because <strong>of</strong> its various biotechnological applications.<br />
Endo-β-1, 4-xylanase plays important roles in animal<br />
feed, increasing the body weight gains <strong>of</strong> animals<br />
(Medel, et al., 2002). In pulp and paper industry,<br />
xylanases are employed in the prebleaching process<br />
to reduce the use <strong>of</strong> toxic chlorine chemicals (Wong<br />
et al., 2002). In bread and bakery industry, xylanases<br />
are used to increase dough viscosity, bread volume, and<br />
shelf life (Romanowska et al., 2003). Other potential<br />
applications include the conversion <strong>of</strong> xylan in wastes<br />
from agriculture and food industries into xylose, and<br />
the production <strong>of</strong> fuel and chemical feedstocks (Sunna<br />
and Antranikian, 1997). xylanolytic enzymes are produced<br />
by a wide variety <strong>of</strong> microorganisms, among<br />
which the filamentous fungi are especially interesting<br />
as they secrete these enzymes into the medium and<br />
their xylanase activities are much higher than those<br />
found in yeast and bacteria (Haltrich et al., 1996; Khan<br />
et al., 2003; Guimaraes et al., 2006). However, to reach<br />
commercial feasibility, enzyme production must be<br />
increased by introducing a more potent strain and by<br />
optimizing culture conditions.<br />
Fusarium is a large genus <strong>of</strong> filamentous fungi, and<br />
most Fusarium species are harmless saprobes and relatively<br />
abundant members <strong>of</strong> the soil microbial community<br />
(domsch et al., 1980; Nwanma et al., 1993). This<br />
ecological habitat <strong>of</strong> the fungus implies that Fusarium<br />
would be a useful resource <strong>of</strong> extracellular enzymes.<br />
Abstract<br />
Fusarium sp. has been shown to be a promising organism for enhanced production <strong>of</strong> xylanases. In the present study, xylanase production<br />
by 21 Fusarium sp. isolates (8 Fusarium culmorum, 4 Fusarium solani, 6 Fusarium verticillioides and 3 Fusarium equiseti) was evaluated<br />
under solid state fermentation (SSF). The fungal isolate Fusarium solani SYRN7 was the best xylanase producer among the tested isolates.<br />
The effects <strong>of</strong> some agriculture wastes (like wheat straw, wheat bran, beet pulp and cotton seed cake) and incubation period on xylanase<br />
production by F. solani were optimized. High xylanase production (1465.8 U/g) was observed in wheat bran after 96 h <strong>of</strong> incubation.<br />
Optimum pH and temperature for xylanase activity were found to be 5 and 50°C, respectively.<br />
K e y w o r d s: Fusarium sp., solid-state fermentation, xylanase<br />
However, information on the ability <strong>of</strong> xylanase production<br />
in Fusarium spp. is rarely reported.<br />
Among the processes used for xylanase production,<br />
solid state fermentation (SSF) is an attractive one<br />
because its presents many advantages, especially for<br />
fungal cultivations (Weiland, 1988; Bakri et al., 2003;<br />
Arabi et al., 2001).<br />
In SSF, the productivity per reactor volume is much<br />
higher compared to that <strong>of</strong> submerged culture (Haltrich<br />
et al., 1996). Also, the operation cost is lower, because<br />
simple plant, machinery and energy are required<br />
(Poorna and Prema 2007). Many SSF processes for<br />
enzyme production, including xylanase, are described<br />
in the literature (Pandey, 1994).<br />
The objectives <strong>of</strong> the present study were (i) to investigate,<br />
on artificial growth media, the xylanase production<br />
by Fusarium sp. Isolates collected from different<br />
regions <strong>of</strong> Syria, and (ii) study the effects <strong>of</strong> some agricultural<br />
wastes on xylanase production by the promising<br />
F. solani SYRN7 isolate under SSF.<br />
Experimental<br />
Materials and Methods<br />
Fungal isolates. Over several years, more than 105<br />
isolates <strong>of</strong> Fusarium spp. were obtained from wheat<br />
seeds showing disease symptoms in different locations<br />
<strong>of</strong> Syria. Seeds were sterilized in 5% sodium hypochlorite<br />
(NaOCl) for 5 min. After three washings with sterile<br />
* Corresponding author: Y. Bakri, department <strong>of</strong> Molecular Biology and Biotechnology, AECS, P.O. Box 6091, damascus, Syria;<br />
e-mail: ascientific@aec.org.sy
210<br />
distilled water, the seeds were transferred onto Petri<br />
dishes containing potato dextrose agar (PdA, dIFCO,<br />
detroit, MI. USA) with 13 mg/l kanamycin sulphate<br />
added after autoclaving and incubated for 10 days,<br />
at 23 ± 1°C in the dark to allow mycelial growth and<br />
sporulation. All isolates were identified morphologically<br />
according to Nelson et al. (1983). In previous studies,<br />
different wheat genotypes had been inoculated with<br />
105 fungal isolates, evaluating host-pathogen reactions<br />
using the method described by Kiprop et al. (2002).<br />
Emphasis was placed on selecting isolates that induced<br />
differential reactions on specific genotypes (Alazem,<br />
2007), leading to selection <strong>of</strong> the 21 monosporic isolates<br />
(eight belonging to F. culmorum, four to F. solani,<br />
six to F. verticillioides and three to F. equiseti) used in<br />
this study. The Fusarium isolates, their host plants, and<br />
geographic origin are listed in Table I. The cultures were<br />
maintained on silica gel at 4°C until needed.<br />
Xylanase production medium. Enzyme production<br />
by the selected isolates was carried out in 250 ml Erlenmeyer<br />
flasks containing 5 g <strong>of</strong> solid substrate and nutrients<br />
(based on 100 ml <strong>of</strong> liquid medium) plus distilled<br />
water to adjust the moisture content to 75%. The fermentation<br />
medium consisted <strong>of</strong>: (g/L) Na 2 HPO 4 × 2H 2 O 10;<br />
KCl 0.5; MgSO 4 × 7H 2 O 0.15, and Yeast extract 5, as<br />
a nitrogen source. The influences <strong>of</strong> different lignocellulosic<br />
materials (wheat bran, beet pulp and cotton seed<br />
cake) on xylanase production were tested. Fresh fungal<br />
spores have been used as inoculums and 1 mL spore<br />
suspension (containing around 10 6 spores/mL) was<br />
added to sterilized medium and incubated at 30°C. The<br />
flasks were removed after cultivation and the enzyme<br />
was extracted by adding distilled water containing 0.1%<br />
Triton × 100 to make the volume in a flask 100 mL. The<br />
flasks’ contents were stirred for 1.5 hours on a magnetic<br />
stirrer. The clear supernatant was obtained by centrifugation<br />
(5000 × g for 15 min) followed by filtration<br />
(Whatman no 1 paper).<br />
Enzyme assay. xylanase activity was assayed by the<br />
optimized method described by Bailey et al. (1992),<br />
using 1% birchwood xylan as substrate. The solution<br />
<strong>of</strong> xylan and the enzyme at appropriate dilution were<br />
incubated at 55°C for 5 minutes and the reducing sugars<br />
were determined by the dinitrosalicylic acid procedure<br />
(Miller, 1959), with xylose as standard. The<br />
released xylose was measured spectrophotometrically<br />
at 540 nm. One unit (U) <strong>of</strong> enzyme activity is defined as<br />
the amount <strong>of</strong> enzyme releasing 1 µmol xylose/ml per<br />
minute under the described assay conditions.<br />
Effect <strong>of</strong> temperature and pH on enzyme activity.<br />
To determine temperature activity pr<strong>of</strong>ile for xylanase<br />
enzyme, assay was carried out at several temperatures<br />
40, 45, 50, 55, 60, 65, 70, and 75°C at pH 5. The optimum<br />
pH was determined by measuring the activity<br />
at 50°C using the following buffers: 0.1M Citrate-<br />
Arabi M.I.E. et al. 3<br />
Table I<br />
Fusarium isolates, host, location and extracellular xylanse production<br />
in solid state fermentation after 5 days <strong>of</strong> incubation at 30°C<br />
Isolate Host Location<br />
F. culmorum<br />
Year <strong>of</strong><br />
collection<br />
xylanase<br />
(U/g)<br />
SY1 wheat seeds north-west 2005 20.3<br />
2 wheat seeds north-west 2005 96.36<br />
3 wheat seeds north-west 2005 163.69<br />
4 wheat seeds north-west 2005 12.16<br />
6 wheat seeds north-west 2005 131.93<br />
12 wheat seeds north-west 2005 115.92<br />
13 wheat seeds north-west 2004 90.64<br />
14 wheat seeds middle region<br />
F. verticillioides<br />
2003 19.52<br />
SY9 wheat seeds north-west 2005 138.72<br />
10 wheat seeds north-west 2005 19.52<br />
15 wheat seeds north-west 2004 61.92<br />
17 wheat seeds middle region 2005 16.56<br />
18 wheat seeds middle region 2005 129.92<br />
19 wheat seeds middle region 2004 108.56<br />
21 wheat seeds middle region<br />
F. solani<br />
2003 102.3<br />
SY7 wheat root middle region 2003 908.2<br />
8 wheat seeds north-west 2004 125.6<br />
11 wheat root north-west 2005 112.16<br />
20 wheat root north-west<br />
F. equiseti<br />
2004 234.96<br />
SY22 wheat seeds north-west 2005 93.2<br />
23 wheat seeds north-west 2003 84.64<br />
24 wheat seeds middle region 2005 122.43<br />
LSd 5%<br />
LSd: Least Significant difference at P < 0.05<br />
phosphate (pH 4.0–6.0); 0.1 M potassium-phosphate<br />
(pH 7.0–8.0) and 0.1M Tris-HCl (pH 9.0).<br />
Statistical analysis. The experiments were repeated<br />
twice. Results were subjected to an analysis <strong>of</strong> variance<br />
(Anon., 1996) using the super ANOVA computer package<br />
to test for differences in xylanase production among<br />
isolates.<br />
Results and Discussion<br />
Table I shows that all the Fusarium species were<br />
capable <strong>of</strong> producing xylanase activity but to varying<br />
degrees (Table I). Significant differences (P < 0.05) in<br />
the mean yield values were detected among isolates,<br />
with high values being consistently higher in the isolates<br />
F. solani SYRN7 and SYRN20 with mean value<br />
908.2 U/g and 234.69 U/g, respectively. Low enzyme<br />
activities <strong>of</strong> 12.16 and 16.56 U/g were detected for<br />
F. culmo rum SYRN4 and F. verticillioides SYRN17,
3 xylanase production by Fusarium sp.<br />
211<br />
Fig. 1. The effect <strong>of</strong> lignocellulosic materials (wheat straw, wheat<br />
bran, beet pulp, and cotton seed cake) on xylanase production by<br />
Fusarium solani F7.<br />
respectively (Table I). From this group, F.solani SYRN7<br />
isolate was selected for further studies. This isolate was<br />
isolated from infected wheat seeds showing disease<br />
symptoms, and screened among 105 isolates as the best<br />
xylanase producer in SSF culture. The isolate was grown<br />
on PdA medium and identified as described above.<br />
Since the cost <strong>of</strong> the substrate plays a crucial role<br />
in the economics <strong>of</strong> xylanase production process,<br />
the expensive substrate (pure xylan) is not suited for<br />
larger-scale production processes due to its high cost.<br />
Insoluble lignocellulosic materials <strong>of</strong>fer a cost effective<br />
substrate for xylanaase production (Bakri et al., 2003; Li<br />
et al., 2007). To select a suitable carbon source and incubation<br />
time for xylanase production, Fusarium solani<br />
SYRN7 was cultivated in a basal medium containing<br />
some lignocellulosic materials wheat straw, wheat bran,<br />
beet pulp and cotton seed cake as carbon sources during<br />
6 days. We observed that maximum enzyme activity<br />
(1465 U/g) was obtained by using wheat bran after<br />
4 days <strong>of</strong> incubation (Fig. 1). This indicated that the<br />
choice <strong>of</strong> an appropriate substrate is <strong>of</strong> great importance<br />
for the successful xylanase production. The substrate<br />
not only serves as a carbon and energy source, but<br />
also provides the necessary inducing compounds for<br />
the organism. Wheat bran proved to be the best carbon<br />
source followed by cotton seed cake. In some fungi,<br />
high xylanase production has been shown to be linked<br />
strictly to the ratio <strong>of</strong> cellulose to xylan <strong>of</strong> the growth<br />
substrate and substrate degradation due to time course<br />
or incubation period (Haltrich et al., 1996; Chirstakopoullos<br />
et al., 1999; Kang et al., 2004).<br />
Enzyme activity is markedly affected by pH. This<br />
is because substrate binding and catalysis are <strong>of</strong>ten<br />
dependent on charge distribution on both substrate<br />
and, in particular, enzyme molecules (Kulkarni et al.,<br />
1999). A pH range from 4 to 10 was used to study the<br />
effect <strong>of</strong> pH on xylanase activity and the results are<br />
given in Fig. 2. The favorable pH range for xylanase<br />
activity <strong>of</strong> Fusarium solani SYRN7 was between 5.0<br />
and 6.0, with optimum pH at 5.0. A significant drop<br />
in enzyme activity was observed below pH 5.0 and<br />
above pH 6.0. A sharp decrease <strong>of</strong> xylanase activity was<br />
observed between pH 5.0 (100%) and pH 8.0 (47.16%).<br />
The enzyme behaviour clearly indicates that it is more<br />
suitable for any application in the pH range <strong>of</strong> 5.0–6.0.<br />
Similar results were observed for other microorganisms.<br />
Aspergillus sp. (Khanna et al., 1995), A.oryzae<br />
(Kitamoto et al., 1999), Fusarium verticillioides (Saha,<br />
2003), Penicillium citrinum (Tanaka et al., 2005) and<br />
Penicillium sp. AH-30 (Li et al., 2007), presented xylanase<br />
with maximum activities at similar pH.<br />
The effect <strong>of</strong> temperature on the xylanase activity<br />
from Fusarium solani SYRN7 is shown in Fig. 3. The<br />
Fig. 2. Optimum pH activity <strong>of</strong> xylanase produced by Fusarium<br />
solani F7 grown on wheat bran under solid state culture.<br />
Relative activity was determined at 55°C.<br />
Fig. 3. Optimal temperature <strong>of</strong> xylanase produced by Fusarium<br />
solani F7 in solid state culture.<br />
Relative activity was determined at pH 5.
212<br />
optimum temperature was 50°C. When the temperature<br />
reached 60°C, relative xylanase activity retained<br />
was about 64.75% under the assay conditions used.<br />
The optimum temperature for xylanases from fungal<br />
sources has been found to be similar or slightly higher.<br />
Penicillium citrinum (Tanaka et al., 2005), Penicillium<br />
sp. AH-30 (Li et al., 2007), Aspergillus sydowii SBS 45<br />
(Nair et al., 2008) and Aspergillus niveus RS2 (Sudan<br />
and Bajaj, 2007) presented xylanase with maximum<br />
activities at 50°C. Penicillium purpurogenum (Belancic<br />
et al., 1995), Aspergillus orysae (Kitamoto et al., 1999)<br />
and Aspergillus niger (Coral et al., 2002) presented xylanase<br />
with maximum activities at 60°C.<br />
The present study demonstrated that significant<br />
improvement <strong>of</strong> xylanase production by F. solani SYRN7<br />
isolate could be obtained by selective use <strong>of</strong> nutrients<br />
and growth conditions. Since xylan is an expensive substrate<br />
for commercial scale xylanase production, the<br />
possibility <strong>of</strong> using wheat bran for xylanase production<br />
was investigated. Wheat bran (5% by mass per volume)<br />
could be used as a less expensive substrate for efficient<br />
xylanase production (1465.8 U/g). This observation is<br />
interesting due to the low cost <strong>of</strong> this carbon source.<br />
The F. solani SYRN7 isolate proved to be a promising<br />
microorganism for xylanase production.<br />
Acknowledgements<br />
The authors thank the director General <strong>of</strong> AECS and the Head<br />
<strong>of</strong> the Molecular Biology and Biotechnology department for their<br />
continuous support throughout this work. Thanks also extended to<br />
dr. A. Aldaoude for critical reading <strong>of</strong> the manuscript.<br />
Literature<br />
Alazem M. 2007. Characterization <strong>of</strong> Syrian Fusarium species by<br />
cultural characteristics and aggressiveness. Thesis, University <strong>of</strong><br />
damascus, Faculty <strong>of</strong> Agriculture. pp. 72.<br />
Anon. 1996. Statview 4.5. USA: Abacus Concepts Corporation.<br />
Arabi M.I.E., M. Jawhar and Y. Bakri. 2001. Effect <strong>of</strong> additional<br />
carbon sources and moisture level on xylanase production by<br />
Cochliobolus sativus in solid fermentation. <strong>Microbiology</strong> 80: 1–4.<br />
Bailey M.J., P. Baily and R. Poutanen. 1992. Interlaboratory testing<br />
<strong>of</strong> methods for assay <strong>of</strong> xylanase activity. J. Biotechnol. 23: 257–270.<br />
Bakri Y., P. Jacques and P. Thonart. 2003. xylanase production<br />
by Penicillium canescens 10–10c in solid-state fermentation. Appl.<br />
Biochem. Biotech. 108: 737–748.<br />
Belancic A., J. Scarpa, A. Peirano, R. Diaz, J. Steiner and<br />
J. Eyzaguirre. 1995. Penicillium purpurogenum produces several<br />
xylanase: Purification and properties <strong>of</strong> two <strong>of</strong> the enzymes. J. Biotechnol.<br />
41: 71–79.<br />
Chirstakopoullos P., D. Mamma, W. Nerinckxw, D. Kekos and<br />
B. Macris. 1999. Production and partial characterization <strong>of</strong> xylanase<br />
from Fusarium oxysporum. Bioresour. Technol. 58: 115–119.<br />
Coral G., B. Arikan, M.N. Ünaldi and H. Korkmaz-Güvenmez.<br />
2002. Some properties <strong>of</strong> thermostable xylanase from an Aspergillus<br />
niger strain. Ann. Microbiol. 52: 299–306.<br />
Domsch K.H., W. Gams and T. H. Anderson. 1980. Compendium<br />
<strong>of</strong> soil fungi. Academic Press, London.<br />
Guimaraes L.H.S., P.S. <strong>No</strong>gueira, M. Michelin, A.C.S. Rizzatti,<br />
V.C. Sandrim, F.F. Zanoela, A.C.M.M. Aquino, A.B. Junior and<br />
M.L.T.M. Polizeli. 2006. Screening <strong>of</strong> filamentous fungi for produc-<br />
Arabi M.I.E. et al. 3<br />
tion <strong>of</strong> enzymes <strong>of</strong> biotechnological interest. Brazil. J. Microbiol.<br />
37: 474–480.<br />
Haltrich D., B. Nidetzky, K.D. Kulbe, W. Steiner and S. Zupaneie.<br />
1996. Production <strong>of</strong> fungal xylanases. Biores. Technol. 58: 137–161.<br />
Kang S.W., Y.S. Park, J.S. Lee, S.I. Hong and S.W. Kim. 2004. Production<br />
<strong>of</strong> cellulose and hemicellulases by Aspergillus niger KK2<br />
from lignocellulosic biomass. Bioresour. Technol. 91: 153–156.<br />
Kiprop E. K., J.P. Baudoin, A.W. Mwangómbe, P.M. Kimani,<br />
G. Mergeai and A. Maquet. 2002. Characterization <strong>of</strong> Kenyan<br />
isolates <strong>of</strong> Fusarium udum from Pigeonpea [Cajanus cajan (L.)<br />
Millsp.] by cultural characteristics, aggressiveness and AFLP analysis.<br />
J. Phyto pathol. 150: 517–527.<br />
Kitamoto N., S. Yoshino, K. Ohmiya and N. Tsukagoshi. 1999.<br />
Purification and characterization <strong>of</strong> overexpressed Aspergillus<br />
oryzae xylanase xynF1. Biosc. Biotechnol. Biochem. 63: 1791–1794.<br />
Khan A., I. Ul-Haq, W.A. Butt and Ali S. 2003. Isolation and<br />
screening <strong>of</strong> Aspergillus isolates for xylanase biosynthesis. Biotech.<br />
2: 185–190.<br />
Khanna P., S.S. Sundari and N.J Kumar. 1995. Production, isolation<br />
and partial purification <strong>of</strong> xylanase from an Aspergillus sp.<br />
World J. Microbiol. Biotechnol. 11: 242–243.<br />
Kulkarni N., A. Shendye and M. Rao. 1999. Molecular and biotechnological<br />
aspects <strong>of</strong> xylanases. FEMS Microbiol. Rev. 23: 411–456.<br />
Li Y., Z. Liu, F. Cui and Y.X.H. Zhao. 2007. Production <strong>of</strong> xylanase<br />
from a newly isolated Penicillium sp. ZH-30. World J. Microbiol.<br />
Biotechnol. 23; 837–843.<br />
Medel, P., F. Baucells, M.I. Gracia, C. Blas and G.G. Mateos. 2002.<br />
Processing <strong>of</strong> barley and enzyme supplementation in diets for young<br />
pigs. Animal Feed Sci. Technol. 95: 113–122.<br />
Miller G.L. 1959. Use <strong>of</strong> dinitrosalicylic acid reagent for determination<br />
<strong>of</strong> reducing sugars. Ann. Chem. 31: 426–428.<br />
Nair S.G., R. Sindhu and S. Shashidhar. 2008. Purification and biochemical<br />
characterization <strong>of</strong> two xylanases from Aspergillus sydowii<br />
SBS 45. Appl. Biochem. Biotechnol. 149: 229–243.<br />
Nelson P.E., T.A. Toussoun and W.F.O. Marasas. 1983. Fusarium<br />
Species: An Illustrated Manual for Identification. The Pennsylvania<br />
State Univ. Press, University Park.<br />
Nwanma B., N. Onyike and P. E. Nelson. 1993. The distribution <strong>of</strong><br />
Fusarium species in soils planted to millet and sorghum in Lesotho,<br />
Nigeria and Zimbabwe. Mycopathologia 121: 105–114.<br />
Pandey A. 1994. Solid state fermentation: an overview, In: Solid<br />
state fermentation. Ashok Pandey, Wiley Eastern, New deli.<br />
Poorna C.A. and P. Prema. 2007. Production <strong>of</strong> cellulose-free<br />
endoxylanase from novel alkalophilic thermotolerent Bacillus pumilus<br />
by solid-state fermentation and its application in waste paper<br />
recycling. Bioresour Technol. 98: 485–490.<br />
Romanowska A., K.P. Janowska and S. Bielecki. 2003. The application<br />
<strong>of</strong> fungal endoxylanase in bread-making. Commun. Agric. Appl.<br />
Biol. Sci. 68: 317–320.<br />
Saha B.C. 2003. Hemicellulose bioconversion. J. Ind. Microbiol.<br />
Biotechnol. 30: 279–291.<br />
Sudan R. and B.K. Bajaj. 2007. Production and biochemical characterization<br />
<strong>of</strong> xylanase from an alkalitolerant novel species Aspergillus<br />
niveus RS2. World J. Microbiol. Biotechnol. 23: 491–500.<br />
Sunna A. and G. Antranikian. 1997. xylanolytic enzymes from<br />
fungi and bacteria. Crit. Rev. Biotechnol. 17: 39–67.<br />
Tanaka H., N. Toshihide., H. Sachio and O. Kazuyoshi. 2005. Purification<br />
and properties <strong>of</strong> an extracellular endo-1,4-β-xylanase from<br />
Penicillium citrinum and characterization <strong>of</strong> the encoding gene.<br />
<strong>Journal</strong> <strong>of</strong> Bioscience and Bioengineering. 100: 623–630.<br />
Weiland P. 1988. Principles <strong>of</strong> solid state fermentation. In: F. Zadrazil,<br />
P. Reiniger (Eds), Treatment <strong>of</strong> lignocellulosics with white rot fungi,<br />
Elsevier, London, pp. 64–76.<br />
Wong K.K.Y., C.S. James and S.H. Campion. 2002. xylanase pre<br />
and post-treatments <strong>of</strong> bleached pulps decrease absorption coefficient.<br />
J. Pulp pap. Sci. 26: 377–383.
<strong>Polish</strong> <strong>Journal</strong> <strong>of</strong> <strong>Microbiology</strong><br />
2011, Vol. 60, <strong>No</strong> 3, 213–221<br />
ORIGINAL PAPER<br />
Screening <strong>of</strong> Actinomycetes from Mangrove Ecosystem for L-asparaginase Activity<br />
and Optimization by Response Surface Methodology<br />
RAJAMANICKAM USHA*, KRISHNASWAMI KANJANA MALA, CHIDAMBARAM KULANDAISAMY VENIL<br />
and MUTHUSAMY PALANISWAMY<br />
Department <strong>of</strong> <strong>Microbiology</strong>, School <strong>of</strong> Life Science, Karpagam University, Tamil Nadu, India<br />
Received 2 September 2010, revised 12 May 2011, accepted 15 May 2011<br />
Introduction<br />
Mangrove ecosystems are rich in bacterial flora. Fertility<br />
<strong>of</strong> the mangrove water results from the microbial<br />
decomposition <strong>of</strong> organic matter and recycling<br />
<strong>of</strong> nutrients. Among the microbes, the bacterial population<br />
in mangrove is many folds greater than the<br />
fungi. The bacteria performed various activities in<br />
the mangrove ecosystems like photosynthesis, nitro-<br />
gen fixation, methanogenesis, production <strong>of</strong> antibio -<br />
tics and enzymes (arysulphatase, L-glutamine, chitinase,<br />
L-asparaginase, cellulase, protease, phosphatase)<br />
etc. (Sahoo et al., 2008).<br />
The enzyme L-asparaginase (L-asparagine aminohydrolase<br />
E.C.3.5.1.1) has been intensively investigated<br />
over the past two decades owing to its importance as<br />
anti neoplastic agent. Although the enzyme has been<br />
found in a variety <strong>of</strong> bacteria, fungi, actinomycetes<br />
and also in mammals, few <strong>of</strong> the purified preparations<br />
have shown to possess antitumor activity (Paul, 1983).<br />
Like bacteria, actinomycetes are also good source for<br />
the production <strong>of</strong> L-asparaginase (Dhevendran et al.,<br />
1999; Savitri et al., 2003).<br />
Abstract<br />
Marine actinomycetes were isolated from sediment samples collected from Pitchavaram mangrove ecosystem situated along the southeast<br />
coast <strong>of</strong> India. Maximum actinomycete population was noted in rhizosphere region. About 38% <strong>of</strong> the isolates produced L-asparaginase.<br />
One potential strain KUA106 produced higher level <strong>of</strong> enzyme using tryptone glucose yeast extract medium. Based on the studied<br />
phenotypic characteristics, strain KUA106 was identified as Streptomyces parvulus KUA106. The optimization method that combines the<br />
Plackett-Burman design, a factorial design and the response surface method, which were used to optimize the medium for the production<br />
<strong>of</strong> L-asparaginase by Streptomycetes parvulus. Four medium factors were screened from eleven medium factors by Plackett-Burman design<br />
experiments and subsequent optimization process to find out the optimum values <strong>of</strong> the selected parameters using central composite design<br />
was performed. Asparagine, tryptone, d))extrose and NaCl components were found to be the best medium for the L-asparaginase production.<br />
The combined optimization method described here is the effective method for screening medium factors as well as determining their<br />
optimum level for the production <strong>of</strong> L-asparaginase by Streptomycetes parvulus KUAP106.<br />
K e y w o r d s: Streptomyces parvulus KUAP106, L-asparaginase, mangrove ecosystem, optimization by RSM<br />
In the last decade, statistical experimental methods<br />
such as Plackett-Burman and Response surface methodology<br />
(RSM) have been applied to optimize media for<br />
industrial purposes. RSM is a collection <strong>of</strong> statistical<br />
techniques for designing experiments, building models,<br />
evaluating the effects <strong>of</strong> various factors and searching<br />
for the optimum conditions. RSM has been successfully<br />
used in the optimization <strong>of</strong> bioprocesses (Majumdar<br />
et al., 2008). <strong>No</strong> defined medium has been established<br />
for the optimum production <strong>of</strong> L-asparaginase from<br />
different microbial sources. Each organism has its own<br />
special conditions for maximum enzyme production.<br />
A statistical approach has been employed in which<br />
a Plackett-Burman design is used for identification significant<br />
variables influencing L-asparaginase production<br />
by Serratia marcescens SB 08 (Venil et al., 2009).<br />
Thereby, in this investigation L-asparaginase producing<br />
strain KUA106 was isolated from the pichavaram<br />
mangrove ecosystem and characterized to belong<br />
to Streptomyces parvulus (Shirling and Gottlieb, 1966)<br />
by morphology and biochemical characters. The levels<br />
<strong>of</strong> the significant variables were further optimized for<br />
L-asparaginase using response surface methodology.<br />
* Corresponding author: R. Usha, 113II nd D, Tatabad, Sivanandha colony, Coimbatore12; phone: 9865068286; fax: 0422-2611043;<br />
e-mail: ushaanbu2007@rediffmail.com
214<br />
Experimental<br />
Materials and Methods<br />
Sample collection. Sediment samples were collected<br />
from different stations <strong>of</strong> the pichavaram mangrove<br />
ecosystem (Lat, 11°27’ N; Long. 79°47’ E), situated along<br />
the southeast coast <strong>of</strong> India. Sediment samples were<br />
collected from rhizosphere areas <strong>of</strong> mangrove plants.<br />
The central portion <strong>of</strong> the 5–15 cm sediment sample<br />
was taken. This sample was then transferred to a sterile<br />
bag and transported immediately to the laboratory.<br />
Isolation <strong>of</strong> mangrove actinomycetes. The samples<br />
thus collected were air dried aseptically. After a week,<br />
sediment samples were incubated at 55°C for five minutes<br />
in order to facilitate the isolation <strong>of</strong> Actinomycetes.<br />
Then tenfold serial dilution was prepared with one<br />
gram <strong>of</strong> sediment sample using filtered and sterilized<br />
50% seawater. Samples were inoculated on the starch<br />
casein agar plates in triplicate petriplates. Nalidixic acid<br />
(20 µg/ml) and cycloheximide (50 µg/ml) were added<br />
to the medium in order to retard the growth <strong>of</strong> bacteria<br />
and fungi, respectively. All the plates were incubated<br />
at 28 ± 2°C, and observed from 5 th day onwards for<br />
25 days. Colonies with suspected Actinomycetes morphology<br />
were purified using yeast extract-malt extract<br />
agar medium. The pure cultures <strong>of</strong> the Actinomycetes<br />
were maintained as slant culture on ISP2 agar as well<br />
as in glycerol broth at 4°C.<br />
Screening <strong>of</strong> mangrove isolates for L-asparaginase<br />
production by rapid-plate assay. The isolates were<br />
screened for asparaginase activity using the method <strong>of</strong><br />
rapid plate assay (Gulati et al., 1997). The medium used<br />
was modified M-9 media with pH indicator (phenol<br />
red). L-asparaginase activity was identified by formation<br />
<strong>of</strong> a pink zone around colonies. Two control plates<br />
were also prepared using modified M-9 media – one<br />
was without dye while the other was without asparagine.<br />
All plates were incubated at 30°C. Pink zone<br />
radius and colony diameter were measured from positive<br />
isolates after 48 hrs.<br />
Identification <strong>of</strong> the selected L-asparaginase positive<br />
Actinomycetes. The large pink zone formed isolate<br />
was taken for further characterization. The microscopic<br />
characterization was done by cover slip culture method<br />
(Kawato and Sinobu, 1979). The mycelium structure,<br />
color and arrangement <strong>of</strong> conidiospore and arthrospore<br />
on the mycelium were observed through the oil immersion<br />
(1000X). The observed structure was compared<br />
with Bergey’s manual <strong>of</strong> determinative bacteriology,<br />
ninth edition (2000). Various biochemical tests were<br />
performed for the identification <strong>of</strong> the potent isolate.<br />
Hydrogen sulphide production, citrate utilization,<br />
coagulation <strong>of</strong> milk (Cowan, 1974), catalase test (Jones,<br />
Usha R. et al. 3<br />
1949), melanin pigment (Pridham, 1957), nitrate reduction<br />
(Gordon, 1966). The utilization <strong>of</strong> different carbon<br />
and nitrogen sources (Pridham, 1948). Cell wall was<br />
performed by the method <strong>of</strong> Lechevalier (1968). The<br />
cultural characteristics were studied in accordance with<br />
the guidelines established by the International Streptomyces<br />
Project (Shirilling, 1966).<br />
Production <strong>of</strong> L-asparaginase. An amount (100 ml)<br />
<strong>of</strong> tryptone glucose yeast extract (TGY) broth (production<br />
medium, pH 7.0) comprising <strong>of</strong> glucose, 0.1 g;<br />
K 2 HPO 4 , 0.1 g; yeast extract, 0.5 g; tryptone, 0.5 g; water,<br />
to 100 ml, and contained in a 250 ml Erlenmeyer flask,<br />
was inoculated separately with the screened isolates and<br />
incubated at 28°C in a shaker-incubator oscillating at<br />
200 rev/min for 24 h. At the end <strong>of</strong> the fermentation<br />
period, the crude enzyme was prepared by centrifugation<br />
at 1000x g for 20 min. The cell-free supernatant was<br />
taken as the crude enzyme.<br />
Enzyme assay. L-asparaginase activity was determined<br />
by measuring the amount <strong>of</strong> ammonia formed<br />
by nesslerization (Wriston and Yellin, 1973). 0.5 ml<br />
sample <strong>of</strong> crude enzyme, 1.0 ml <strong>of</strong> 0.1 M sodium borate<br />
buffer (pH 8.5) and 0.5 ml <strong>of</strong> 0.04 M L-asparagine solution<br />
were mixed and incubated for 10 min at 37°C. The<br />
reaction was then stopped by the addition <strong>of</strong> 0.5 ml <strong>of</strong><br />
15% trichloroacetic acid. The precipitated protein was<br />
removed by centrifugation, and the liberated ammonia<br />
was determined by direct nesslerization.<br />
Suitable blanks <strong>of</strong> substrate and enzyme-containing<br />
samples were included in all assays. The yellow color<br />
was read in a spectrophotometer (Shimadzu UV2450)<br />
at 500 nm. One unit (U) <strong>of</strong> L-asparaginase activity is<br />
that amount <strong>of</strong> enzyme, which liberates 1 μmole <strong>of</strong><br />
ammonia in 1 min at 37°C.<br />
Screening <strong>of</strong> important nutrient components<br />
using Plackett-Burman design. This study was done<br />
by Plackett-Burman design for screening medium<br />
components with respect to their main effects and not<br />
their interaction effects (Plackett and Burman, 1946)<br />
on L-asparaginase production by Streptomycetes sp. The<br />
medium components were screened for eleven variables<br />
at two levels, maximum (+) and minimum (–). According<br />
to the Plackett-Burman design, the number <strong>of</strong> positive<br />
signs (+) is equal to (N+1)/2 and the number <strong>of</strong><br />
negative signs (–) is equal to (N-1)/2 in a row. A column<br />
should contain equal number <strong>of</strong> positive and negative<br />
signs. The first row contains (N+1)/2 positive signs and<br />
(N-1)/2 negative signs and the choice <strong>of</strong> placing the<br />
signs is arbitrary. The next (N-1) rows are generated by<br />
shifting cyclically one place (N-1) times and the last row<br />
contains all negative signs. The experimental design and<br />
levels <strong>of</strong> each variable is shown in Table I. The medium<br />
was formulated as per the design and the flask culture<br />
experiments were performed. Response was calculated
3 L-asparaginase <strong>of</strong> Actinomycetes from mangrove ecosystems<br />
215<br />
Table I<br />
Plackett-Burman experiments design for evaluating factors influencing L-asparaginase by Streptomycetes sp.<br />
Run A B C D E F G H J K L<br />
L-asparaginase<br />
U/mL<br />
1 10 50 0 0.5 4 5 0.01 5 2 0.1 0.1 56<br />
2 4 50 150 1 4 1 0.01 5 0.5 0.3 0.1 36<br />
3 10 50 0 1 10 5 0.01 0.5 0.5 0.3 0.05 39<br />
4 4 50 150 0.5 10 5 0.05 0.5 0.5 0.1 0.1 66<br />
5 10 20 150 1 10 1 0.01 0.5 2 0.1 0.1 19<br />
6 4 20 0 1 4 5 0.05 0.5 2 0.3 0.1 45<br />
7 4 20 150 0.5 10 5 0.01 5 2 0.3 0.05 20<br />
8 10 20 150 1 4 5 0.05 5 0.5 0.1 0.05 23<br />
9 4 50 0 1 10 1 0.05 5 2 0.1 0.05 32<br />
10 4 20 0 0.5 4 1 0.01 0.5 0.5 0.1 0.05 25<br />
11 10 20 0 0.5 10 1 0.05 5 0.5 0.3 0.1 53<br />
12 10 50 150 0.5 4 1 0.05 0.5 2 0.3 0.05 36<br />
A: pH; B:Temperature (°C); C: Agitation (rpm); D: Inoculum concentration (%); E: Incubation time (days) F: Dextrose (%); G: Asparagine (%);<br />
H: Yeast extract (%); J: Tryptone (%); K: KH 2 PO 4 (%); L: NaCl (%)<br />
at the rate <strong>of</strong> enzyme production and expressed as<br />
U/mL. All experiments were performed in triplicate<br />
and the average <strong>of</strong> the rate <strong>of</strong> enzyme production was con-<br />
sidered as the response. The effect <strong>of</strong> each variable was calculated<br />
using the following equation: E = (ΣΜ + − Μ − )/Ν.<br />
Where E is the effect <strong>of</strong> tested variable, M + and M – are<br />
responses <strong>of</strong> trials at which the parameter was at its<br />
higher and lower levels respectively and N is the number<br />
<strong>of</strong> experiments carried out. The standard error<br />
(SE) <strong>of</strong> the variables were the square root <strong>of</strong> variance<br />
and the significance level (p-value) <strong>of</strong> each variables<br />
calculated by using Student’s t-test. t = Exi/SE, where<br />
Exi is the effect <strong>of</strong> tested variable. The variables with<br />
higher confidence levels were considered to influence<br />
the response or output variable.<br />
Optimization <strong>of</strong> concentration <strong>of</strong> the selected<br />
medium components using response surface methodology.<br />
The screened medium components affecting<br />
enzyme production were optimized using central composite<br />
design (CCD) (Box and Wilson, 1951; Box and<br />
Hunter, 1957). According to this design, the total number<br />
<strong>of</strong> treatment combinations is 2k + 2k + n0 where<br />
‘k’ is the number <strong>of</strong> independent variables and n0 the<br />
number <strong>of</strong> repetitions <strong>of</strong> the experiments at the center<br />
point. For statistical calculation, the variables Xi have<br />
been coded as xi according to the following transformation:<br />
xi = X i – X 0 /δX. where: X i is dimensionless coded<br />
value <strong>of</strong> the variable. X i , X 0 the value <strong>of</strong> the X i at the<br />
center point, and δX is the step change. A 2k-factorial<br />
design with eight axial points and six replicates at the<br />
center point with a total number <strong>of</strong> 30 experiments<br />
were employed for optimizing the medium components.<br />
The behavior <strong>of</strong> the system was explained by the<br />
2 following quadratic equation: Y = β + Σβ x + Σβ x +<br />
0 i i ii i<br />
+ Σβ x x where Y is the predicted response, β the inter-<br />
ij ij j. 0<br />
cept term, β the linear effect, β the squared effect, and<br />
i ii<br />
β is the interaction effect. The regression equation was<br />
ij<br />
optimized for maximum value to obtain the optimum<br />
conditions using Design Expert Version.<br />
Validation <strong>of</strong> the experimental model. The statistical<br />
model was validated with respect to L-asparaginase<br />
production under the conditions predicted by the<br />
model in shake flask conditions. Samples were withdrawn<br />
at the desired intervals and L-asparaginase assay<br />
was determined as described above.<br />
Results and Discussion<br />
Isolation and screening <strong>of</strong> mangrove actinomycetes<br />
for L-asparaginase production by rapid-plate<br />
assay. Samples were examined for Actinomycetes. After<br />
5 th day to 25 th day, 63 colonies were found on starch<br />
casein agar plate. These 63 isolates were screened for<br />
L-asparaginase activity. Only 24 isolates showed positive<br />
in rapid plate assay method (Fig. 1). The plate study<br />
is advantageous as the method is quick and L-asparaginase<br />
production visualized directly from the plates. The<br />
studies with different concentration <strong>of</strong> the dye revealed<br />
that as the concentration <strong>of</strong> the dye increases, the clarity<br />
and visibility <strong>of</strong> the pink zone increased.<br />
Mangroves have very specialized adaptations that<br />
enable them to live different condition. It exists under<br />
very hostile and inhospitable conditions (Khan and<br />
Ali, 2007). So far no reports are available on Actinomycetes<br />
isolated from mangrove sediments exhibiting
216<br />
Fig. 1. Isolation and screening <strong>of</strong> mangrove Actinomycetes<br />
for L-asparaginase production.<br />
prominent L-asparaginase production. Hence it is suggested<br />
that the strain isolated from pichavaram mangrove<br />
environment, possessing L-asparaginase activity.<br />
Identification <strong>of</strong> the selected L-asparaginase positive<br />
Actinomycetes. The large pink zone formed isolate<br />
produced grey and white colonies with yellow pigmentation<br />
and showed fast growth within two days on yeast<br />
extract malt extract agar (International Streptomyces<br />
Project 2 medium). The morphological, physiological<br />
and biochemical characteristics <strong>of</strong> actinomycete isolate<br />
KUA 106 was summarized in Table II. The cell wall<br />
hydrolysate contains L-diaminopimelic acid (LL-DAP)<br />
and sugar pattern were not detected.<br />
The physiological characteristic studies revealed that<br />
the isolate KUA 106 did produce melanoid pigments.<br />
This strain hydrolysed starch, reduced nitrate and liquefied<br />
gelatin but it did not produce H 2 S. It utilized glucose,<br />
arabinose, mannose, maltose, xylose, inositol and<br />
starch. It could not utilize lactose, raffinose, sucrose,<br />
galactose and mannitol. As nitrogen sources, it utilized<br />
cystein, phenyl alanine, lysine, serine and hydroxy<br />
proline, and histidine are poorly utilized. It could not<br />
utilize valine. Well growth was recorded at a temperature<br />
range <strong>of</strong> 15 to 37°C and pH range <strong>of</strong> 6 to 9. The<br />
utilization <strong>of</strong> various carbohydrates by the selected<br />
isolate suggests a good pattern <strong>of</strong> carbon assimilation.<br />
Glucose, xylose and inositol sugars were well utilized.<br />
These results emphasized that the Actinomycetes isolate<br />
is related to a group <strong>of</strong> Streptomyces parvulus.<br />
Plackett-Burman design. The influence <strong>of</strong> eleven<br />
(11) factors namely pH, temperature, agitation, inoculum<br />
concentration, incubation time, dextrose, asparagine,<br />
yeast extract, tryptone, KH 2 PO 4 and NaCl in<br />
the production <strong>of</strong> L-asparaginase was investigated in<br />
Usha R. et al. 3<br />
Table II<br />
The morphological, physiological and biochemical characteristics<br />
<strong>of</strong> the Actinomycetes isolate KUAP 106<br />
Characteristic Result<br />
Spore mass gray<br />
Spore surface smooth<br />
Spore chain spiral<br />
Diffusible pigment produced<br />
Melanin pigment –<br />
Diaminopimelic acid (DAP) LL-DAP<br />
Hydrolysis <strong>of</strong> Protein +<br />
Catalase test –<br />
Production <strong>of</strong> melanin pigment +<br />
Starch hydrolysis +<br />
Liquefied gelatin +<br />
H2S Production –<br />
Nitrate reduction +<br />
Citrate utilization +<br />
Urea test –<br />
Coagulation <strong>of</strong> milk<br />
Utilization <strong>of</strong>:<br />
-<br />
D-Xylose +<br />
D-Mannose +<br />
D-Glucose +<br />
D-Galactose +<br />
Rhamnose +<br />
Raffinose +<br />
Mannitol –<br />
L-Arabinose ++<br />
meso-Inositol –<br />
Lactose –<br />
Maltose ++<br />
D-fructose –<br />
Sucrose ++<br />
Starch +++<br />
L-Cycteine +<br />
L-Valine +<br />
L-Histidine –<br />
L-Phenylalanine –<br />
L-Hydroxproline +<br />
L-Lysine +<br />
L-Arginine –<br />
L-Serine +<br />
L-Tyrosine<br />
Growth with<br />
+<br />
Sodium azide (0.01) +<br />
Phenol (0.1)<br />
Enzyme activity<br />
+<br />
α-amylase +<br />
Gelatinase, +<br />
Protease +<br />
Lecithinase –<br />
L-asparaginase +<br />
– = Negative; + = Positive; ++ = moderate growth; +++ = good growth results.
3 L-asparaginase <strong>of</strong> Actinomycetes from mangrove ecosystems<br />
217<br />
Fig. 2. Pareto chart for Plackett-Burman design for 11 medium factors on L-asparaginase<br />
production by Streptomycetes parvulus KUA106.<br />
12 runs using Plackett-Burman design. Table I represents<br />
the Plackett-Burman design for 11 selected variables<br />
and the corresponding response for L-asparaginase<br />
production. Variations ranging from 19 to 66 U/mL<br />
in the production <strong>of</strong> L-asparaginase in the 12 trials were<br />
observed by Plackett-Burman design.<br />
The Pareto chart illustrates the order <strong>of</strong> significance<br />
<strong>of</strong> the variables affecting L-asparaginase production<br />
(Fig. 2). Among the variables screened, the most effective<br />
factors with high significance level indicated by<br />
Pareto chart were in the order asparagine, tryptone,<br />
dextrose and NaCl.<br />
Asparagine showed a remarkable support for the<br />
growth <strong>of</strong> Streptomycetes parvulus. Tryptone, dextrose<br />
and NaCl were also identified as most potent significant<br />
variables in L-asparaginase production from Streptomycetes<br />
parvulus and selected for further optimization<br />
while pH, temperature, agitation, inoculum concentration,<br />
incubation time, yeast extract and KH 2 PO4<br />
concentration which exhibited less significant level<br />
were omitted in further experiments. Statistical analysis<br />
<strong>of</strong> the Plackett-Burman design demonstrated that<br />
the model F value <strong>of</strong> 7.24 is significant. The values <strong>of</strong><br />
p < 0.05 indicate model terms are significant (Table II).<br />
Regression analysis was performed on the results<br />
and first order polynomial equation was derived representing<br />
L-asparaginase production as a function <strong>of</strong><br />
the independent variables. Y = 43.94G + 10.07J – 6.28F<br />
– 4.98L. Where Y is the response value (L-asparaginase<br />
production) and A, B, C and D are the coded levels <strong>of</strong><br />
asparagine, tryptone, dextrose and NaCl respectively.<br />
The magnitude <strong>of</strong> the effects indicated the level <strong>of</strong> the<br />
significance <strong>of</strong> the variables on L-asparaginase production<br />
consequently, based on the results from the experiment,<br />
statistically significant variables (i.e.) asparagine,<br />
tryptone, dextrose and NaCl with positive effect were<br />
further investigated with central composite design to<br />
find the optimal range <strong>of</strong> these variables.<br />
Central composite design. Based on Plackett-Burman<br />
design, asparagine, tryptone, dextrose and NaCl<br />
were selected for further optimization using response<br />
surface methodology. To examine the combined effect<br />
<strong>of</strong> these factors, a central composite design (CCD) was<br />
employed within a range <strong>of</strong> –2 to +2 in relation to production<br />
<strong>of</strong> L-asparaginase (Table III). Run 4 showed<br />
maximum L-asparaginase production <strong>of</strong> 135 U/mL<br />
(asparagine – 0.05%, tryptone – 0.5%, dextrose – 5%,<br />
NaCl – 0.05%).<br />
The results obtained from the central composite<br />
design were fitted to a second order polynomial equation<br />
to explain the dependence <strong>of</strong> L-asparaginase production<br />
on the medium components. L-asparaginase =<br />
= 115.67 + 19.17A – 5.08B + 11.83C + 0.83D – 6.38AB +<br />
+ 8.13AC + 1.63AD – 8.00BC + 0.50BD – 4.25CD –<br />
– 19.42A 2 – 17.67B 2 – 14.54C 2 – 9.29D 2 . Where Y is the<br />
Table III<br />
Analysis <strong>of</strong> variance for L-asparaginase production<br />
by Streptomycetes parvulus KUA106<br />
Source<br />
Sum <strong>of</strong><br />
square<br />
ource<br />
DF<br />
Mean<br />
square<br />
F<br />
– Value<br />
p<br />
– Value<br />
Model 2281.25 4 570.313 7.24958 0.0124<br />
G-Asparagine 294.03 1 294.03 3.73758 0.0945<br />
J-Tryptone 1216.05 1 1216.05 15.458 0.0057<br />
F-Dextrose 473.763 1 473.763 6.02228 0.0438<br />
L-NaCl 297.406 1 297.406 3.78049 0.0929<br />
Residual 550.679 7 78.6685<br />
Cor Total 2831.93 11
218<br />
Run<br />
predicted response <strong>of</strong> L-asparaginase production G, J,<br />
F and L are the coded values <strong>of</strong> asparagine, tryptone,<br />
dextrose and NaCl respectively. For the production <strong>of</strong><br />
this L-asparaginase enzyme there is the need for the<br />
presence <strong>of</strong> carbon source, nitrogen source and also<br />
small amount <strong>of</strong> mineral nutrients for the remarkable<br />
production <strong>of</strong> the enzyme particularly on the large scale<br />
production.<br />
The analysis <strong>of</strong> variance <strong>of</strong> the quadratic regression<br />
model suggested that the model is very significant as<br />
was evident from the Fisher’s F-test (Table IV). The<br />
model’s goodness to fit was checked by determination<br />
coefficient (R 2 ). In the case, the value <strong>of</strong> R 2 (0.84) closer<br />
to 1 denotes better correlation between the observed<br />
Usha R. et al. 3<br />
Table IV<br />
Experimental plan for optimization <strong>of</strong> L-asparaginase production using central composite design<br />
A: Asparagine<br />
%<br />
B: Tryptone<br />
%<br />
C: Dextrose<br />
%<br />
D: NaCl<br />
%<br />
L-asparaginase U/mL<br />
Experimental Predicted<br />
1 0.03 1.25 3 0.525 55 53<br />
2 0.03 1.25 –1 0.525 21 22<br />
3 0.03 –0.25 3 0.525 37 37<br />
4 0.05 0.5 5 0.05 135 132<br />
5 0.05 2 1 0.05 38 37<br />
6 0.03 2.75 3 0.525 48 44<br />
7 0.05 0.5 5 1 121 119<br />
8 0.01 2 1 1 21 19<br />
9 0.05 2 1 1 87 89<br />
10 0.05 2 5 1 54 52<br />
11 0.01 0.5 1 0.05 34 33<br />
12 –0.01 1.25 3 0.525 12 10<br />
13 0.05 0.5 1 0.05 67 67<br />
14 0.07 1.25 3 0.525 59 54<br />
15 0.05 0.5 1 1 54 54<br />
16 0.03 1.25 3 –0.425 65 67<br />
17 0.01 0.5 5 0.05 32 31<br />
18 0.03 1.25 3 0.525 129 130<br />
19 0.03 1.25 3 0.525 124 125<br />
20 0.03 1.25 3 0.525 130 128<br />
21 0.03 1.25 3 1.475 87 86<br />
22 0.01 2 5 1 22 21<br />
23 0.03 1.25 7 0.525 89 88<br />
24 0.01 2 1 0.05 37 35<br />
25 0.01 2 5 0.05 42 40<br />
26 0.01 0.5 1 1 36 35<br />
27 0.03 1.25 3 0.525 125 121<br />
28 0.03 1.25 3 0.525 131 134<br />
29 0.05 2 5 0.05 75 74<br />
30 0.01 0.5 5 1 41 43<br />
and predicted responses. The coefficient <strong>of</strong> variation<br />
(CV) indicates the degree <strong>of</strong> precision with which the<br />
experiments are compared. The lower reliability <strong>of</strong> the<br />
experiment is usually indicated by high value <strong>of</strong> CV<br />
(4.06) denotes that the experiments performed are<br />
highly reliable. The p value denotes the significance<br />
<strong>of</strong> the coefficient and also important in understanding<br />
the pattern <strong>of</strong> the mutual interactions between the<br />
variables.<br />
The fitted responses for the above regression model<br />
were plotted in Figure 3. 3D graphs were generated for<br />
the pair wise combination <strong>of</strong> four factors for L-asparaginase<br />
production. Graphs highlight the roles played<br />
by various factors affecting L-asparaginase production.
3 L-asparaginase <strong>of</strong> Actinomycetes from mangrove ecosystems<br />
219<br />
Fig. 3. Three dimensional response surface plot for the effect <strong>of</strong> (A) asparagine, tryptone (B) asparagine, dextrose (C) asparagine,<br />
NaCl (D) tryptone, dextrose (E) tryptone, NaCl (F) dextrose, NaCl.<br />
The experimental values were found to be very close<br />
to the predicted values hence, the model was successfully<br />
validated. The L-asparaginase production showed<br />
about 2.04 fold increases over the central point and<br />
5.50 fold increases over the basal medium.<br />
Validation model. The maximum experimental<br />
response for L-asparaginase production was 135 U/mL<br />
whereas the predicted value was 132 U/mL indicating<br />
a strong agreement between them. The scale-up study<br />
was carried out in jar fermentation by using medium<br />
under optimized conditions. The maximum production<br />
<strong>of</strong> 146 U/ml L-asparaginase was achieved in this scaleup<br />
study. The result <strong>of</strong> optimization study under flask<br />
conditions was 135 U/mL was observed in the scale up<br />
study with higher volume <strong>of</strong> fermentation.<br />
Conclusions. Based on screening results, it has<br />
been shown that mangrove sediments <strong>of</strong> pichavaram<br />
possess L-asparaginase producing Actinomycetes and
220<br />
this ecosystem exists as one <strong>of</strong> the potential source <strong>of</strong><br />
L-asparaginase enzyme. Smaller and less time consuming<br />
experimental designs will generally suffice for<br />
the optimization <strong>of</strong> fermentation process. The isolated<br />
Streptomycetes parvulus KUAP106 can be used for<br />
the production <strong>of</strong> L-asparaginase enzyme. Further it<br />
is important to discover newer Streptomycetes sp. that<br />
produce enzymes that could be <strong>of</strong> industrial value.<br />
Acknowledgement<br />
The authors are grateful to Karpagam University, Coimbatore,<br />
Tamil Nadu, and India for providing the infrastructure facilities<br />
for this study.<br />
Literature<br />
Abdel-Fattah Y.R., H.M. Saeed, Y. Gohar and E.L. Baz-ma. 2005.<br />
Improved production <strong>of</strong> Pseudomonas aeruginosa uricase by optimization<br />
<strong>of</strong> process parameters through statistical experimental<br />
designs. Process Biochem. 40: 1707–1714.<br />
Aguilar G., J. Morlon-Guyot, B. Trejo-Aguilar and J.P. Guyot.<br />
2000. Purification and characterization <strong>of</strong> an extra cellular alpha<br />
amylase produced by Lactobacillus manihotivorans LMG 1801 (T),<br />
an amylolytic lactic acid bacterium. Enzyme Microb. Technol. 27:<br />
406–413.<br />
Box G. and J.S. Hunter. 1957. Multi-factor experimental designs for<br />
exploring response surfaces. Ann. Math. Stat. 28: 195–241.<br />
Box G. and K.B.Wilson. 1951. On the experimetal designs for<br />
exploring response surfaces. Ann. Math. Stat. 13: 1–45.<br />
Usha R. et al. 3<br />
Table V<br />
ANOVA for the experimental results <strong>of</strong> the central composite design (quadratic model)<br />
Source Sum <strong>of</strong> squares df Mean square F-value p-value<br />
Model 35586.45 14 2541.889 4.129386 0.0050<br />
A-Asparagine 8816.667 1 8816.667 14.32298 0.0018<br />
B-Tryptone 620.1667 1 620.1667 1.007482 0.3314<br />
C-Dextrose 3360.667 1 3360.667 5.459518 0.0337<br />
D-NaCl 16.66667 1 16.66667 0.027076 0.8715<br />
AB 650.25 1 650.25 1.056353 0.3203<br />
AC 1056.25 1 1056.25 1.715914 0.2099<br />
AD 42.25 1 42.25 0.068637 0.7969<br />
BC 1024 1 1024 1.663523 0.2167<br />
BD 4 1 4 0.006498 0.9368<br />
CD 289 1 289 0.46949 0.5037<br />
A2 10340.76 1 10340.76 16.79892 0.0009<br />
B2 8560.762 1 8560.762 13.90725 0.0020<br />
C2 5800.048 1 5800.048 9.422375 0.0078<br />
D2 2368.048 1 2368.048 3.846974 0.0687<br />
Residual 9233.417 15 615.5611<br />
Lack <strong>of</strong> Fit 4778.083 10 477.8083 0.536221 0.8122<br />
Pure Error 4455.333 5 891.0667<br />
Cor Total 44819.87 29<br />
CV = 4.06; R 2 = 0.84<br />
Cowan S.T. 1974. Cowan and Steel Manual for the Identification <strong>of</strong><br />
Medical Bacteria 2 . Edition Cambridge, Univ. Press.<br />
Dhevandran K. and K. Annie. 1999. Antibiotic and L-asparaginase<br />
<strong>of</strong> Streptomycetes isolated from fish, shellfish, and sediments <strong>of</strong> veli<br />
estuarine along Kerala coast. Indian J. Mar. Sci. 28: 335–337.<br />
Gordon R.E. 1966. Some criteria for the recognition <strong>of</strong> <strong>No</strong>cardia<br />
madura (Vincent) Blanchord. J. Gen. Microbiol. 45: 355–364.<br />
Gulati R., R.K. Saxena and R. Gupta. 1973. A rapid screening for<br />
L-asparaginase and glutaminase activities <strong>of</strong> microorganisms. J. Gen.<br />
Microbiol. 76: 85–99.<br />
Jones K. 1949. Fresh isolates <strong>of</strong> actinomycetes in which the presence<br />
<strong>of</strong> sporogenous aerial mycelia is a fluctuating characteristics.<br />
J. Bacteriol. 57: 141–145.<br />
Kim H.O, J.M. Lim, J.H. Joo, S.W. Kim, H.J. Hwang, J.W. Choi<br />
and J.W. Yun. 2005. Optimization <strong>of</strong> submerged culture condition<br />
for the production <strong>of</strong> mycelial biomass and exopolysaccharides by<br />
Agrocybe cylindracea. Bioresour. Technol. 96: 1175–1182.<br />
Khan A.S and M.S. Ali. 2007. Mangroves- an ecosystem in peril.<br />
J. Curr. Sci. 10: 419–420.<br />
Kawato M and R. Shinobu. 1959. A simple technique for the microscopical<br />
observation. Mem. Osaka Unit. Lib. Arts. Educ. B Nat. Sci.<br />
8: 114–119.<br />
Lechevalier M.P. and H.A. Lechevalier. 1968. Chemical composition<br />
as a criterion in the classification <strong>of</strong> aerobic actinomycetes.<br />
J. Sys. Bacteriol. 20: 435–443.<br />
Le Mense E.H., J. Corman, J.M. Van Lanen and A.F. Langlykke.<br />
1947. Production <strong>of</strong> mold amylases in submerged culture. Biochem.<br />
54: 149–159.<br />
Lee K.M. and D.F. Gilmore. 2005. Formulation and process modeling<br />
<strong>of</strong> biopolymer (polyhydroxyalkanoates: PHAs) production from<br />
industrial wastes by novel crossed experimental design. Process Biochem<br />
40: 229–246.
3 L-asparaginase <strong>of</strong> Actinomycetes from mangrove ecosystems<br />
221<br />
Locci R. 1989. Streptomyces and related genera. Bergey’s manual <strong>of</strong><br />
systematic bacteriology. William and Wilkins company. Baltimore<br />
4: 2451–2508.<br />
Majumdar A. and A. Goyal. 2008. Enhanced production <strong>of</strong> exo-<br />
cellular glucansucrase from Leuconostoc dextranicum NRRL<br />
B-1145 using response surface method. Bioresour. Technol. 99,<br />
3685–3691.<br />
McTigue M.A., C.T. Kelly, W.M. Fogarty and E.M. Doyle. 1994.<br />
Production studies on the alkaline amylases <strong>of</strong> three alkalophilic<br />
Bacillus sp. Biotechnology Lett. 16: 569–574.<br />
Nawani N.N. and B.P. Kapadnis. 2005. Optimization <strong>of</strong> chitinase<br />
production using statistics based experimental designs. Process Biochem.<br />
40: 651–660.<br />
Paul J.H. 1982. Isolation and characterization <strong>of</strong> a chlamydomonas<br />
L-asparaginase. Biochem. J. 203: 109–115.<br />
Plackett R.L. and J.P. Burman. 1946. The design <strong>of</strong> optimum multifactorial<br />
experiments. Biometrika 33: 305–325.<br />
Pridham T.G., P. Anderson, C. Foley, L.A. Lindenfelser, C.W.<br />
Hesselting and R.G. Benedict. 1957. A section <strong>of</strong> media for maintenance<br />
and taxonomic study <strong>of</strong> Streptomycetes. Antibiotics Ann.,<br />
pp. 947–953.<br />
Pridham T.G. and D. Gottlieb. 1948. The utilization <strong>of</strong> carbon compounds<br />
by some actinomycetes as an aid for species determination.<br />
J. Bacteriol. 56: 107–114.<br />
Sahoo K. and N.K. Dhal. 2009. Potential microbial diversity in<br />
mangrove ecosystems. A review. Indian J. Marine Sci. 38: 249–256.<br />
Santamaria R.I., G. Del Rio, G. Saab, M.E. Rodriguez, X. Soberon<br />
and A. Lopez Marguia. 1999. Alcoholysis reactions from starch<br />
with alpha-amylases. FEBS Lett. 452: 346–350.<br />
Savitri A.N. and W. Azmi. 2003. Microbial L asparaginase: A potent<br />
antitumor enzyme. Indian. J. Biotechnol. 2: 184–194.<br />
Senthilkumar S.R., B. Ashokkumar, K. Raj Chandra and<br />
P. Gunasekaran. 2005. Optimization <strong>of</strong> medium composition for<br />
alkali-stable xylanase production by Aspergillus fischeri Fxn 1 in<br />
solid state fermentation using central composite rotary design. Bioresour<br />
Technol. 96: 1380–1386.<br />
Shirling E.B. and D. Gottlieb. 1966. Methods for characterization<br />
<strong>of</strong> Streptomyces species. Int. J. Syst. Bacteriol. 16: 313–340.<br />
Venil C.K., K. Nanthakumar, K. Karthikeyan and P. Lakshmanaperumalsamy.<br />
2009. Production <strong>of</strong> L-asparaginase by Serratia marcescens<br />
SB08: Optimization by response surface methodology. Iranian<br />
J. Biotechnol. 7: 10–18.<br />
Wang Y.X. and Z.X. Lu. 2005. Optimization <strong>of</strong> processing parameters<br />
for the mycelial growth and extracellular polysaccharide<br />
production by Boletus spp. ACCC 50328. Process Biochem. 40:<br />
1043–1051.<br />
Wriston J.C and T.O. Yellin. 1973. L-asparaginase: a review. Adv.<br />
Enzymol. 39: 185–248.
<strong>Polish</strong> <strong>Journal</strong> <strong>of</strong> <strong>Microbiology</strong><br />
2011, Vol. 60, <strong>No</strong> 3, 223–228<br />
ORIGINAL PAPER<br />
Chitin-Glucan Complex Production by Schizophyllum commune<br />
Submerged Cultivation<br />
DZIANIS SMIRNOU*, MARTIN KRCMAR and EVA PROCHAZKOVA<br />
Introduction<br />
Chitin-glucan complex (CGC) is general name for<br />
a wide variety <strong>of</strong> biological copolymers composed <strong>of</strong><br />
chitin macromolecules with covalently linked β-Dglucan<br />
chains. The complex naturally occurs in the cellular<br />
walls <strong>of</strong> filamentous fungi, where it forms rigid<br />
micr<strong>of</strong>ibers that contribute cell wall mechanical strength.<br />
CGC can be extracted from fungal mycelium by various<br />
physiochemical and enzymatic methods, with the use<br />
<strong>of</strong> inorganic reagents, organic solvents, detergents, etc.<br />
(Ivshina, 2007). Traditionally CGC is recovered as an<br />
insoluble residue after mycelium successive treatments<br />
with alkali and acid. Fungal CGC is considered as an<br />
alternative source <strong>of</strong> chitin/chitosan (Wu et al., 2005;<br />
Teslenko and Woewodina, 1996) as well as a potent agent<br />
for application in medicine for wound-healing management<br />
(Teslenko and Woewodina 1996; Valentova et al.,<br />
2009), for improvement <strong>of</strong> desquamation process and<br />
xerosis reduction in diabetic patients (Quatresooz et al.,<br />
2009), for reduction <strong>of</strong> aortic fatty streak accumulation<br />
(Berecochea-Lopez et al., 2009), etc.<br />
Traditionally waste mycelium <strong>of</strong> Aspergillus niger<br />
from citric acid production is considered as an indus-<br />
CPN Ltd., Dolní Dobrouč, Czech Republic<br />
Received 10 March 2011, revised 5 May 2011, accepted 15 June 2011<br />
Abstract<br />
Chitin-glucan complex is a fungal origin copolymer that finds application in medicine and cosmetics. Traditionally, the mycelium <strong>of</strong><br />
Micromycetes is considered as an industrial chitin-glucan complex source. Basidiomycete Schizophyllum commune submerged cultivation for<br />
chitin-glucan complex production was studied. In different S. commune strains chitin-glucan complex composed 15.2 ± 0.4 to 30.2 ± 0.2%<br />
<strong>of</strong> mycelium dry weight. Optimized conditions for chitin-glucan complex production (nutrient medium composition in g/l: sucrose<br />
– 35, yeast extract – 4, Na 2 HPO 4 *12H 2 O – 2.5, MgSO 4 *7 H 2 O – 0.5; medium initial pH 6.5; aeration intensity 2 l <strong>of</strong> air per 1 l <strong>of</strong> medium;<br />
144 hours <strong>of</strong> cultivation) resulted in 3.5 ± 0.3 g/l complex yield. Redirection <strong>of</strong> fungal metabolism from exopolysaccharide synthesis to<br />
chitin-glucan complex accumulation was achieved most efficiently by aeration intensity increase. Chitin-glucan complex from S. commune<br />
had the structure <strong>of</strong> micr<strong>of</strong>ibers with diameter 1–2 µm, had water-swelling capacity <strong>of</strong> 18 g/g, and was composed <strong>of</strong> 16.63% chitin and<br />
83.37% glucan with a degree <strong>of</strong> chitin deacetylation <strong>of</strong> 26.9 %. S. commune submerged cultivation is a potent alternative to Micromycetes<br />
for industrial-scale chitin-glucan complex production.<br />
K e y w o r d s: Schizophyllum commune, chitin-glucan, optimized cultivation<br />
List <strong>of</strong> abbreviations: CGC – chitin-glucan complex, IPA – isopropanol, PDA – potato dextrose agar, rpm – rotations per minute,<br />
vvm – air volume per broth volume per minute, YE – yeast extract<br />
trial chitin(chitosan)-glucan complex source. There<br />
are several reports on other Micromycetes belonging to<br />
genus Ascomycota and Zygomycota utilization for CGC<br />
production (Wu et al., 2005; Teslenko and Woewodina<br />
1996). Basidiomycetes have been rarely considered as<br />
CGC producers, though they are capable <strong>of</strong> intensive<br />
growth in submerged culture as well. Schizophyllum<br />
commune is Basidiomycete used for β-(1,3;1,6)-Dglucan<br />
schizophyllan production. S. commune can be<br />
a promising culture for industrial scale CGC production<br />
if mycelium growth and CGC content in mycelium<br />
is increased and exopolysaccharide synthesis suppressed.<br />
The aim <strong>of</strong> the work was to characterize CGC<br />
from S. commune submerged mycelium and to study<br />
the possibility <strong>of</strong> fungal metabolism redirection from<br />
exopolysaccharide synthesis to CGC formation.<br />
Experimental<br />
Materials and Methods<br />
S. commune strains from different microorganism<br />
collections were used: F-795 (Czech Collection <strong>of</strong><br />
Microorganisms), 11223, 1024, 1025 and 1026 (German<br />
* Corresponding author: D. Smirnou, CPN Ltd., Dolní Dobrouč 401, 561 02 Dolní Dobrouč, Czech Republic; phone: + (420) 465 519 539;<br />
e-mail: smirnou@contipro.cz
224<br />
Collection <strong>of</strong> Microorganisms and Cell Cultures), 127<br />
(Collection <strong>of</strong> Microorganisms CPN Ltd.). The strains<br />
were stored on agar slants with PDA at + 4°C and<br />
subcultured regularly. Prior to experiment the strains<br />
were inoculated to Petri dishes that were cultivated for<br />
7 days at 29°C. 250 ml Erlenmeyer flasks with 100 ml<br />
medium (Inoculum I) were inoculated with 10 pieces<br />
0.5 × 0.5 cm <strong>of</strong> mycelium from the Petri dishes and<br />
incubated in rotary shakers at 29°C, 200 rpm for 5 days.<br />
Inoculum I was then homogenized by T 25 digital<br />
Ultra-TURRAX (IKA, Germany) and 50 ml <strong>of</strong> homogenate<br />
were used for inoculation <strong>of</strong> 1000 ml Erlenmeyer<br />
flasks with 500 ml medium. 1000 ml Erlenmeyer flasks<br />
were cultivated in rotary shakers at 29°C, 200 rpm for<br />
7 days. In case <strong>of</strong> cultivations in 50 l fermenter 1000 ml<br />
Erlenmeyer flasks with 500 ml medium were cultivated<br />
for 3 days and then used as seed culture for fermenter<br />
inoculation (5% amount <strong>of</strong> inoculum). Fermenters with<br />
working volume 0.3 l were inoculated with 20 ml <strong>of</strong><br />
homogenized Inoculum I and cultivation lasted 4 days.<br />
Medium for the seed cultures and production<br />
culti vations contained (in g/l): 35 – sucrose, 3 – YE,<br />
2.5 – Na 2 HPO 4 *12H 2 O, 0.5 – MgSO 4 *7 H 2 O, initial<br />
pH 5.5, unless otherwise specified. Effects <strong>of</strong> nutrient<br />
medium composition and pH were studied in 1000 ml<br />
Erlenmeyer flasks with 500 ml medium. Medium pH<br />
was adjusted by NaOH or HCl prior to sterilization.<br />
Influence <strong>of</strong> aeration was studied in Sixfors fermenters<br />
(INFORS AG, Switzerland) with working volume<br />
0.3 l. The cultivation conditions were as follows: temperature<br />
29°C, agitation 150 rpm, aeration 0.5–2.0 vvm.<br />
Effect <strong>of</strong> cultivation time was studied in fermenter<br />
(INFORS AG, Switzerland) with working volume 50 l<br />
under the following conditions: temperature 29°C;<br />
aeration 2 vvm; agitation 150 rpm. Cultivation medium<br />
(in g/l): 35 – sucrose, 4 – YE, 2.5 – Na 2 HPO 4 *12H 2 O,<br />
0.5 – MgSO 4 *7 H 2 O, pH 6.5.<br />
Mycelium and schizophyllan yields were measured<br />
as follows: 500 ml <strong>of</strong> cultural broth were centrifuged<br />
(10 000 × g, 25°C, 20 min), supernatant was collected<br />
and used for schizophyllan precipitation. Sediment<br />
(mycelium) was resuspended in 250 ml <strong>of</strong> demineralised<br />
water, centrifuged again and supernatant was discarded.<br />
The process <strong>of</strong> mycelium washing was repeated<br />
2 more times. The mycelium was placed into a Petri<br />
dish, freeze-dried in Heto PowerDry PL 3000 freeze<br />
dryer (Thermo Scientific, USA) to constant weight,<br />
and mycelium yield in grams <strong>of</strong> dry mycelium per<br />
1 liter <strong>of</strong> cultural broth was calculated. Schizophyllan<br />
was precipitated from supernatant with triple amount<br />
<strong>of</strong> IPA, dried under 60°C for 24 hours, weighted and<br />
schizophyllan yield in grams <strong>of</strong> dry polysaccharide per<br />
1 liter <strong>of</strong> supernatant was calculated. CGC amount in<br />
mycelium was determined as follows: 2 g <strong>of</strong> freeze-dried<br />
mycelium were resuspended in 60 ml <strong>of</strong> 4.2 M NaOH.<br />
Smirnou D. et al. 3<br />
The mixture was heated to 90°C and incubated under<br />
this temperature for 3 hours under constant mixing.<br />
The mixture was then centrifuged (10 000 × g, 25°C,<br />
10 min), the supernatant was discarded and sediment<br />
was resuspended in 300 ml <strong>of</strong> demineralised water by<br />
Ultra-Turrax T25 Digital (IKA, Germany) and centrifuged<br />
again. The process was repeated until supernatant<br />
pH 7. The sediment was then mixed with 60 ml <strong>of</strong><br />
0.25 M HCl, resuspended by Ultra-Turrax T25 Digital<br />
(IKA, Germany) and incubated for 2 hours at 50°C.<br />
The resulting CGC was centrifuged (10 000 × g, 25°C,<br />
10 min), supernatant was discarded, sediment was<br />
resuspended in 300 ml <strong>of</strong> demineralised water by Ultra-<br />
Turrax T25 Digital (IKA, Germany) and centrifuged<br />
again. The process was repeated until supernatant pH 7.<br />
The CGC was dehydrated by IPA, dried under 60°C<br />
for 24 hours and weighed. CGC content is presented as<br />
mass fraction (%) in dry mycelium. Residual sucrose in<br />
the medium was calculated from glucose that resulted<br />
from sucrose degradation by baker’s yeast invertase<br />
(Sigma, USA). Glucose was measured by L-Glucose<br />
assay kit GOD-POD (BioVendor, Czech Republic). pO 2<br />
in the cultivation broth was measured by optical probe<br />
Hamilton-Visiferm DO 120 (Hamilton, Switzerland).<br />
CGC swelling capacity was measured as follows:<br />
0.5 grams <strong>of</strong> sample were placed into spherical container<br />
45 mm diameter made <strong>of</strong> wire screen. The container<br />
was deep into water for 40 sec. to let the substance swell.<br />
Then the container was removed from the water, left<br />
for 30 sec. to drain and weighed. Swelling capacity<br />
(g <strong>of</strong> water/1 g <strong>of</strong> sample) was calculated as follows:<br />
(weight <strong>of</strong> container with swelled sample – weight <strong>of</strong><br />
wet container – 0.5)* 2.<br />
Hydrogen bromide titrimetric analysis was conduc<br />
ted by modified method described by Khan et al.<br />
(2002) with utilization <strong>of</strong> 500 mg CGC suspended in<br />
100 ml 0.2 M HBr. Elementary analyses were made<br />
on FISONS EA-1108 CHN elemental analyzer (Italy).<br />
Electron-scanning microscope image was made by<br />
Tescan VEGA II LSU electron microscope (Tescan USA<br />
Inc.) under the following conditions: high voltage 5 kV,<br />
working distance 4.4 mm, magnification 5000, display<br />
mode secondary electrons, high vacuum, room temperature.<br />
A15 nm layer <strong>of</strong> gold particles was applied on<br />
the sample by SC7620 Mini Sputter Coater (Quorum<br />
Technologies, UK). All experiments were repeated at<br />
least 3 times. The data is presented as value ± standard<br />
deviation.<br />
Results and Discussion<br />
Mycelium growth and CGC production by submerged<br />
culture <strong>of</strong> six S. commune strains was studied.<br />
Cultivation lasted 7 days, corresponding to late
3 Chitin-glucan production by S. commune<br />
225<br />
Table I<br />
Mycelium yield, CGC content in mycelium,<br />
CGC and schizophyllan production by different S. commune strains<br />
S. commune<br />
strain<br />
Mycelium<br />
yield<br />
g/l<br />
CGC in<br />
mycelium<br />
%<br />
CGC<br />
production<br />
g/l<br />
Schizophyllan<br />
production<br />
g/l<br />
F-795 6.0 ± 0.2 15.2 ± 0.4 0.9 ± 0.1 2.3 ± 0.5<br />
11223 11.0 ± 0.4 17.4 ± 0.2 1.9 ± 0.2 1.7 ± 0.2<br />
1024 8.5 ± 0.1 16.1 ± 0.1 1.4 ± 0.3 0.7 ± 0.1<br />
1025 8.6 ± 0.5 17.1 ± 0.1 1.5 ± 0.2 0.7 ± 0.1<br />
1026 12.3 ± 0.3 20.3 ± 0.3 2.5 ± 0.2 1.2 ± 0.3<br />
127 11.4 ± 0.7 30.2 ± 0.2 3.4 ± 0.4 0.5 ± 0.1<br />
stationary growth phase. S. commune mycelium yield<br />
varied between 6.0 ± 0.2 g/l and 12.3 ± 0.3 g/l (Table I).<br />
For comparison, mycelium yields <strong>of</strong> chitin producers<br />
A. niger and Mucor rouxii are reported about 7 g/l and<br />
5 g/l respectively (Wu et al., 2005; Tan et al., 1996). CGC<br />
content in mycelium <strong>of</strong> different S. commune strains<br />
ranged within 15.2 ± 0.4% and 30.2 ± 0.2% and was<br />
similar to that reported for Aspergillus and Mucor (Wu<br />
et al., 2005, Arcidiacono and Kaplan 1992, Muzzarelli<br />
et al., 1980). CGC production by S. commune reached<br />
3.4 ± 0.4 g/l that is superior to many reported production<br />
values <strong>of</strong> Micromycetes.<br />
The microstructure and chemical composition <strong>of</strong><br />
CGC from S. commune mycelium (Strain 127) were analyzed.<br />
The copolymer was a cotton-like substance white<br />
to creamy in color without odor. Electron-scanning<br />
microscopy showed that even after harsh extraction<br />
that removes alkali soluble cell wall polysaccharides,<br />
CGC from S. commune was composed <strong>of</strong> micr<strong>of</strong>ibers<br />
with diameter 1–2 µm, similar to fungal hypha (Fig. 1).<br />
Highly developed microstructure determined remarkable<br />
swelling capacity <strong>of</strong> the complex that was 18 grams<br />
<strong>of</strong> water per 1 gram <strong>of</strong> CGC and was comparable with<br />
that measured for cotton wool (35 g/l). This characteristic<br />
makes CGC from S. commune a valuable product<br />
for application in bandages.<br />
Elementary analyses <strong>of</strong> the complex showed nitrogen<br />
content 1.22 ± 0.10%, carbon 42.20 ± 0.24% and<br />
hydrogen 6.61 ± 0.15%. Glucosamine in the complex<br />
comprised 4.5 ± 0.4%. When these two analyses were<br />
combined, the composition <strong>of</strong> CGC from S. commune<br />
can be assumed as follows: 16.6% chitin and 83.4% <strong>of</strong><br />
glucan with chitin deacetylation degree 27%. Although,<br />
chitin portion in S. commune CGC is lower than in<br />
A. niger, where chitin content is reported to be about<br />
30% (Wu et al., 2005; Machova et al., 1999), utilization<br />
<strong>of</strong> S. commune for chitin production is promising due<br />
to high CGC yield.<br />
Fungal mycelium separation from cultivation me -<br />
dium is an essential technological step in CGC production.<br />
From this point, filtration <strong>of</strong> S. commune cultural<br />
broth is a rather complicated process due to exopolysaccharide<br />
content. The possibilities <strong>of</strong> CGC production<br />
increase together with exopolysaccharide synthesis<br />
suppression by variation <strong>of</strong> cultivation technique were<br />
studied. The study was conducted on S. commune F-795.<br />
CGC accumulation by fungi can be effected by<br />
nitrogen source in nutrient medium. Sousa et al. (2003)<br />
reported that when Mucor circinelloides was cultivated<br />
in synthetic medium with L-asparagine as single nitrogen<br />
source, chitin content in mycelium depended upon<br />
amino acid concentration. There was studied effect <strong>of</strong><br />
yeast extract (YE) in the medium on CGC production<br />
by S. commune. The amount <strong>of</strong> YE was varied from 2 g/l<br />
up to 5 g/l and CGC content in mycelium, mycelium<br />
yield and schizophyllan synthesis were measured. It<br />
was found, that CGC content in S. commune mycelium<br />
is little affected by YE, and it varied in the range<br />
<strong>of</strong> 15.4 ± 0.3% under all studied YE concentrations.<br />
Increase <strong>of</strong> YE content from 2 to 4 g/l increased mycelia<br />
biomass production more than 1.5 times (Fig. 2). Further<br />
supplementation <strong>of</strong> the medium with YE increased<br />
mycelium growth only slightly. As distinct from mycelium,<br />
schizophyllan synthesis was suppressed by YE<br />
concentrations over 4 g/l (Fig. 2).<br />
Amorim et al. (2001) reported medium pH as<br />
a regulating agent for chitosan production by Mucor<br />
racemosus and Cunninghamella elegans. The effect can<br />
be due to chitin deacetylase activity modification. It<br />
can be expected that medium pH may effect activity<br />
<strong>of</strong> enzymes, involved in S. commune CGC formation<br />
as well. CGC production by S. commune in medium<br />
with different initial pH was studied. Again, CGC<br />
Fig. 1. Electron-scanning microscope image <strong>of</strong> CGC<br />
from S. commune submerged mycelium (High voltage 5 kV, working<br />
distance 4.4 mm, magnification × 5000).
226<br />
Fig. 2. Effect <strong>of</strong> YE in nutrient medium on mycelium yield (■) g/l<br />
and schizophyllan production (■) g/l by S. commune.<br />
Fig. 3. Effect <strong>of</strong> initial medium pH on mycelium yield (■) g/l and<br />
schizophyllan production (■) g/l by S. commune.<br />
content in mycelium was not significantly affected by<br />
pH and varied in the range <strong>of</strong> 15.1 ± 0.4%. Mycelium<br />
yield reached highest values at medium initial pH 6.5<br />
(Fig. 3). Medium neutralization from pH 5 to pH 6<br />
increased schizophyllan production 1.5 times. Further<br />
increase <strong>of</strong> medium pH left schizophyllan synthesis<br />
practically unchanged.<br />
Smirnou D. et al. 3<br />
Fig. 4. Effect <strong>of</strong> aeration intensity on S. commune mycelium yield<br />
(■) g/l, and CGC content in mycelium (■) %.<br />
Fig. 5. Effect <strong>of</strong> aeration intensity on S. commune schizophyllan<br />
synthesis, grams <strong>of</strong> schizophyllan per gram <strong>of</strong> mycelium<br />
in the cultural broth.<br />
It is reported (Aguilar-Uscanga et al., 2003) that<br />
aeration intensity effects cell walls formation in fungi.<br />
In agreement with this, our study showed very significant<br />
changes in CGC production by S. commune during<br />
cultivation under different aeration rates. CGC content<br />
in mycelium rose from 12.4 ± 0.3% to 15.5 ± 0.3%<br />
when aeration increased to 1 vvm (Fig. 4). Further<br />
Fig. 6. Change <strong>of</strong> mycelium yield (g/l), CGC content in mycelium (%), CGC<br />
and schizophyllan production (g/l) during S. commune cultivation.
3 Chitin-glucan production by S. commune<br />
227<br />
Fig. 7. Change <strong>of</strong> medium pH, pO 2 (%) and sucrose content in medium (g/l) during<br />
S. commune cultivation.<br />
aeration increase up to 2 vvm increased CGC content<br />
to 16.3 ± 0.3% only. Mycelium yield increased more<br />
than 2 times with increase <strong>of</strong> aeration from 0.5 vvm to<br />
2 vvm and reached the maximum value <strong>of</strong> 13.7 ± 0.6 g/l<br />
(Fig. 4). From the data above, there was calculated<br />
maximal CGC production <strong>of</strong> 2.2 ± 0.2 g/l under 2 vvm<br />
aeration.<br />
When the amount <strong>of</strong> schizophyllan was related to<br />
mycelium yield, it was found that the most intensive<br />
exopolysaccharide synthesis takes place at aeration <strong>of</strong><br />
1 vvm (Fig. 5). These indicate that aeration intensity<br />
can be used as the key regulator for redirection <strong>of</strong><br />
S. commune metabolism from schizophyllan synthesis<br />
to CGC accumulation.<br />
Cultivation conditions that favored high CGC production<br />
(YE 4 g/l, pH 6.5, aeration 2 vvm) were combined<br />
and effect <strong>of</strong> cultivation time on CGC and schizophyllan<br />
accumulation was studied in fermenter with<br />
50 l working volume. The culture reached stationary<br />
growth phase in 96 hours, the highest mycelium yield<br />
<strong>of</strong> 15.9 ± 0.9 g/l was recorded at that cultivation time as<br />
well (Fig. 6). Amount <strong>of</strong> CGC in mycelium increased<br />
during all cultivation and reached maximum value <strong>of</strong><br />
28.1 ± 0.2% in 168 hours. The highest CGC production<br />
<strong>of</strong> 3.5 ± 0.3 g/l was recorded in 144 hours <strong>of</strong> cultivation.<br />
The amount <strong>of</strong> schizophyllan in medium increased<br />
until 144 h <strong>of</strong> cultivation when it reached 2.4 ± 0.6 g/l,<br />
whereupon it started to decrease (Fig. 6).<br />
S. commune acidified medium to pH 4.9 in first<br />
72 hours, however then medium pH started to increase<br />
and reached 6.3 at the end <strong>of</strong> cultivation (Fig. 7). All<br />
sucrose was consumed within the first 96 hours. pO 2<br />
probe indicated 0% medium oxygen saturation beginning<br />
from 48 hours <strong>of</strong> cultivation (Fig. 7).<br />
By means <strong>of</strong> cultivation conditions optimisation<br />
CGC production by S. commune was increased more<br />
than 3.8 times. CGC content in mycelium was little<br />
sensitive to medium composition, but was increased<br />
by aeration intensification and cultivation time prolongation.<br />
Mycelium yield was increased by adjustment<br />
<strong>of</strong> YE content in the medium, medium initial pH and<br />
aeration intensity. Redirection <strong>of</strong> fungal metabolism<br />
from schizophyllan synthesis to CGC accumulation<br />
was achieved most efficiently by aeration intensity<br />
increase. The study showed the potential <strong>of</strong> S. commune<br />
submerged cultivation for industrial-scale CGC<br />
production. CGC from S. commune can find application<br />
in medicine and chitin/chitosan production as an<br />
alternative to CGC from Micromycetes.<br />
Acknowledgement<br />
We thank pr<strong>of</strong>. Ing. Radim Hrdina (Institute <strong>of</strong> Organic Chemistry<br />
and Technology, University <strong>of</strong> Pardubice, Czech Republic) for<br />
elementary analyses. This work was supported by a grant from EU<br />
funds and national budget <strong>of</strong> the Czech Republic under project<br />
Nr. FR-TI 1/151 “New Wound Dressings Based On Micro- and<br />
Nano- Carriers” covered by TIP platform.<br />
Literature<br />
Aguilar-Uscanga B. and J.M. Francois. 2003. A study <strong>of</strong> the yeast<br />
cell wall composition and structure in response to growth conditions<br />
and mode <strong>of</strong> cultivation. Lett. Appl. Microbiol. 37: 268–274.<br />
Amorim R.V.S., W. de Souza, K. Fukushima and G.M. Campos-<br />
Takaki. 2001. Faster chitosan production by Mucoralean strains in<br />
submerged culture. Braz. J. Microbiol. 32: 20–23.<br />
Arcidiacono S. and D.L. Kaplan. 1992. Molecular weight distribution<br />
<strong>of</strong> chitosan isolated from Mucor rouxii under different culture<br />
and processing conditions. Biotechnol. Bioeng. 39: 281–286.<br />
Berecochea-Lopez A., K. Decordé, E. Ventura, M. Godard,<br />
A. Bornet, P.L. Teissèdre, J.P. Cristol and J.M. Rouane. 2009. Fungal<br />
chitin-glucan from Aspergillus niger efficiently reduces aortic<br />
fatty streak accumulation in the high-fat fed hamster, an animal<br />
model <strong>of</strong> nutritionally induced atherosclerosis. J. Agric. Food Chem.<br />
57: 1093–1098.<br />
Ivshin V.P., S.D. Artamonova, T.N. Ivshina and F.F. Sharnina.<br />
2007. Methods for isolation <strong>of</strong> chitin-glucan complexes from higher<br />
fungi native biomass. Polym. Sci. 49: 305–310.<br />
Khan T.A., K.K. Peh and H.S. Ch’ng. 2002. Reporting degree <strong>of</strong><br />
deacetylation values <strong>of</strong> chitosan: the influence <strong>of</strong> analytical methods.<br />
J. Pharm. Pharmaceut. Sci. 5: 205–212.<br />
Machova E., G. Kogan, D. Chorvatovicova and J. Sandula. 1999.<br />
Ultrasonic depolymerization <strong>of</strong> the chitin-glucan complex from<br />
Aspergillus niger and antimutagenic activity <strong>of</strong> its product. Ultrason.<br />
Sonochem. 6: 111–114.
228<br />
Muzzarelli R.A.A., F. Tanfani and G. Scarpini. 1980. Chelating,<br />
filmforming, and coagulating ability <strong>of</strong> the chitosan-glucan complex<br />
from Aspergillus niger industrial wastes. Biotechnol. Bioeng. 22:<br />
885–896.<br />
Quatresooz P., C. Piérard-Franchimont, G. Szepetiuk, C. Devillers<br />
and G.E. Piérard. 2009. Fungal chitin-glucan scaffold for managing<br />
diabetic xerosis <strong>of</strong> the feet in menopausal women. Expert. Opin.<br />
Pharmacother. 10: 2221–2229.<br />
Sousa A.V., N.B. de Barros, K. Fukushima and T.G.M. Campos.<br />
2003. Effect <strong>of</strong> medium components and time <strong>of</strong> cultivation on chitin<br />
production by Mucor circinelloides (Mucor javanicus IFO 4570)<br />
– a factorial study. Rev. Iberoam. Micol. 20: 149–53.<br />
Smirnou D. et al. 3<br />
Tan C.S., K.T. Tan, M.S. Wong and E. Khor. 1996. Chitosan yield<br />
<strong>of</strong> zygomycetes at their optimum harvesting time. Carbohydr. Polym.<br />
30: 239–242.<br />
Teslenko A. and I. Woewodina. 1996. Process for producing chitosan-glucan<br />
complexes, compounds producible therefrom and their<br />
use. United States patent US 6333399 B1.<br />
Valentová Z., H. Bilerová, R. Suláková and V. Velebný. 2009. Preparation<br />
for wound healing and prevention <strong>of</strong> bandage adhesion to<br />
the wound, containing chitosan-glucan. Patent WO/2009/043319.<br />
Wu T., S. Zivanovic, F.A. Draughon, W.S. Conway and C.F. Sams.<br />
2005. Physicochemical Properties and Bioactivity <strong>of</strong> Fungal Chitin<br />
and Chitosan. J. Agric. Food Chem. 53: 3888–3894.
<strong>Polish</strong> <strong>Journal</strong> <strong>of</strong> <strong>Microbiology</strong><br />
2011, Vol. 60, <strong>No</strong> 3, 229–232<br />
ORIGINAL PAPER<br />
Inhibition <strong>of</strong> Lactophage Activity by Quinolinilporphyrin and Its Zinc Compex<br />
NATALIA VODZINSKA 1 *, BORIS GALKIN 1 , YURIY ISHKOV 1 , ANNA KIRICHENKO 1 ,<br />
ALEXANDRA KONDRATYUK 2 and TETIANA FILIPOVA 2<br />
1 Biotechnological Scientific-Educational Centre <strong>of</strong> I.I. Mechnikov Odessa National University, Odessa, Ukraine<br />
2 Department <strong>of</strong> <strong>Microbiology</strong> and Virology, I.I. Mechnikov Odessa National University, Odessa, Ukraine<br />
Received 28 March 2011, revised 26 June 2011, accepted 5 July 2011<br />
Introduction<br />
Various lactic acid bacteria have been used for centuries<br />
in the preservation and production <strong>of</strong> fermented<br />
foods and feeds <strong>of</strong> plant and animal origins. One <strong>of</strong> the<br />
most critical problems in these processes is the contamination<br />
<strong>of</strong> the starters by bacteriophages that cause<br />
bacterial lysis and leads to failed or slow fermentation,<br />
decrease in acid production, reduction <strong>of</strong> milk products<br />
quality, e.g. taste and texture (C<strong>of</strong>fey and Ross, 2002),<br />
which all result in pr<strong>of</strong>ound economical losses.<br />
Recognition <strong>of</strong> the phage problem in the dairy<br />
industry led to the design and application <strong>of</strong> a variety<br />
<strong>of</strong> practical measures for its alleviation, such as direct<br />
inoculation <strong>of</strong> the starters in closed fermentation vats,<br />
use <strong>of</strong> antiphage media for starter propagation, rotation<br />
<strong>of</strong> starter cultures, application <strong>of</strong> genetic techniques to<br />
improve the phage-resistance <strong>of</strong> starter cultures (however,<br />
European legislation requires the labelling such<br />
<strong>of</strong> starters as GMO that were modified by self-cloning<br />
and thus contain only species-specific DNA) (Kutter<br />
and Sulakvelidze, 2005).<br />
Porphyrins are one <strong>of</strong> the challenging compounds<br />
for infectious disease treatment (Nitzan et al., 1994).<br />
<strong>No</strong>wadays they are widely used in anticancer photodynamic<br />
therapy. This method is based on the use <strong>of</strong><br />
a photosensitizer, which after light exposure can cause<br />
different derangements <strong>of</strong> cell structures. It was shown<br />
Abstract<br />
The influence <strong>of</strong> free base <strong>of</strong> quinolinilporphyrin and its Zn complex on infectivity <strong>of</strong> lactophages E3, E5 and E17 has been studied. The<br />
results <strong>of</strong> our investigations show that inhibition <strong>of</strong> lactophage activity by Zn complex <strong>of</strong> quinolinilporphyrin at concentration 10 μM and<br />
20 μM was in the range 53–62% and 65–85%, respectively. The presence <strong>of</strong> this porphyrin in nutrient medium prevents the propagation<br />
<strong>of</strong> bacteriophage infection in Lactococcus lactis, but does not affect the phage adsorption process. The free base <strong>of</strong> quinolinilporphyrin<br />
slightly inhibits the activity <strong>of</strong> lactophages.<br />
K e y w o r d s: Lactococcus lactis, lactophage, quinolinilporphyrin<br />
that porphyrins have good antibacterial effect even<br />
without activation by light (Philippova et al., 2003).<br />
Porphyrins and their derivatives appear to be effective<br />
virucidal agents in vitro (Cowsert, 1994; Grandadam<br />
et al., 1995). Most <strong>of</strong> the work on viruses in vitro has<br />
been oriented to the use for sterilization <strong>of</strong> blood or<br />
blood products (<strong>No</strong>rth et al., 1993). In some works bacteriophages<br />
were used as a model <strong>of</strong> viruses to study<br />
mechanisms <strong>of</strong> porphyrin action (Zupan et al., 2004;<br />
Vodzinska et al., 2008). These compounds showed good<br />
effect as inhibitors <strong>of</strong> phytoviral infection in plant tissue<br />
culture and in vivo (Krulko et al., 2008; 2009).<br />
The aim <strong>of</strong> this work was to test the ability <strong>of</strong> new<br />
synthetic porphyrins to inhibit the activity <strong>of</strong> lactophages,<br />
namely phage E3, E5 and E17 <strong>of</strong> Lactococus<br />
lactis, without activation by light.<br />
Experemental<br />
Materials and Methods<br />
Bacterial and phage strains. Lactococcus lactis<br />
subsp. lactis 502 and bacteriophages E3, E5 and E17<br />
were obtained from the collection <strong>of</strong> Belarusian State<br />
Technological University. Bacterial strains were grown<br />
and maintained at 30°C in M17 medium (Merck) with<br />
the following composition (Terzaghi and Sandine,<br />
1975) (g/l): peptone from soymeal (5.0), peptone from<br />
* Corresponding author: N. Vodzinska, Biotechnological Scientific-Educational Centre <strong>of</strong> I.I. Mechnikov Odessa National University;<br />
str. Dovzhenko 7а, 65058 Odessa, Ukraine; e-mail: nsvod@ukr.net
230<br />
meat (2.5), peptone from casein (2.5), yeast extract<br />
(2.5), meat extract (5.0), lactose monohydrate (5.0),<br />
ascorbic acid (0.5), sodium β-glycerophosphate (19.0),<br />
magnesium sulfate (0.25), supplemented with 0.5% glucose.<br />
When necessary, the medium was solidified with<br />
agar-agar (5 g/l for top agar, 10 g/l for bottom agar).<br />
Preparation <strong>of</strong> phage stocks was carried out in liquid<br />
medium M17 in the presence <strong>of</strong> 5 mM CaCl 2 .<br />
Chemicals. The antiphage activity <strong>of</strong> free base <strong>of</strong><br />
quinolinilporphyrin (TQP) and its complex with Zn<br />
(Zn(II)TQP) (Fig. 1), synthesized in PLMS-5 <strong>of</strong> Odessa<br />
National University named after I.I. Mechnikov, has<br />
been studied. They were stored at 4°C in powder form<br />
or as a stock solution in distilled water.<br />
Plaque reduction assay. The direct action <strong>of</strong> porphyrins<br />
on the viral particles was studied by using the<br />
plaque reduction assay (Ramezani et al., 2008). Bacteriophage<br />
was incubated with compound in medium<br />
M17 24 hours at 4°C, then plated using standard double-layer<br />
method and incubated at 30°C overnight. The<br />
antiphage activity was expressed in percents <strong>of</strong> inactivation,<br />
which were calculated by means <strong>of</strong> formula:<br />
A = (1 – N s /N k ) × 100%, where N s is a number <strong>of</strong> plaque<br />
forming units in test sample, N k is the number <strong>of</strong> plaque<br />
forming units in the control.<br />
Inhibition <strong>of</strong> bacteriophage infection in the<br />
liquid medium. To check the influence <strong>of</strong> porphyrin<br />
on bacteriophage infection in L. lactis bacterial cells<br />
(1 × 10 3 cfu cm –3 ) and bacteriophage (5 × 10 4 pfu cm –3 )<br />
were simultaneously added to test tubes which contained<br />
liquid medium M17 with different concentrations<br />
<strong>of</strong> compound. Test tubes without the studied compounds<br />
were used for determination <strong>of</strong> normal course<br />
<strong>of</strong> phage infection. Test tubes to which only L. lactis<br />
was added were used as a control. After 24 hours <strong>of</strong><br />
incubation the optical density <strong>of</strong> samples was measured<br />
and compared with that in the control. Optical density<br />
measurements were made on spectrophotometer “Spekol-10”<br />
at λ = 540 nm (Philippova at al., 2003).<br />
Vodzinska N. et al. 3<br />
Fig. 1. Quinolinilporphyrin and its zinc complex structure.<br />
Inhibition <strong>of</strong> bacteriophage adsorption. To study<br />
the influence <strong>of</strong> porphyrins on the phage adsorption<br />
process the bacterium was incubated with bacteriophage<br />
in the presence <strong>of</strong> the compounds at 30°C for<br />
15 min. Test tubes without compounds were used as<br />
control for determination <strong>of</strong> phage adsorption inhibition.<br />
After 15 minutes the incubation was stopped<br />
by diluting (1:100) in normal saline solution and the<br />
mixture was centrifuged for 5 min 5000x g. The supernatants<br />
were assayed for non-adsorbed phages by standard<br />
double-layer method, and the results compared<br />
with the titer <strong>of</strong> a control without bacterial cells. Phage<br />
adsorption was calculated as follows: Percentage adsorption<br />
= (сontrol titre – residual titre)/сontrol titre × 100%.<br />
Results and Discussion<br />
The main property for all antiviral agents is the<br />
absence <strong>of</strong> toxic effect on a host-cell. So for the start the<br />
influence <strong>of</strong> studied porphyrins on the growth <strong>of</strong> Lactococcus<br />
lactis culture has been checked. The porphyrin<br />
concentrations which not inhibit bacterial growth have<br />
been chosen. For both compounds those were concentrations<br />
0.1 µM, 1 µM, 10 µM, 20 µM. To determinate<br />
direct porphyrin action on the viral particles the bacteriophages<br />
were incubated with these compounds and<br />
then plated by the standard double-layer method.<br />
The results show that Zn complex <strong>of</strong> quinolinilporphyrin<br />
was the most effective against all studied bacteriophages.<br />
Maximal antiphage activity was observed in<br />
the presence <strong>of</strong> 20 µM <strong>of</strong> this compound. The inhibition<br />
<strong>of</strong> phage infectivity was in the range 65–85%. Bacteriophage<br />
E3 was the most sensitive to this porphyrin<br />
concentration. The antiphage effect <strong>of</strong> Zn complex at<br />
the concentration <strong>of</strong> 10 μM was equal to 53% for E5<br />
and reached 62% for E3 and E17 bacteriophages. Other<br />
concentrations <strong>of</strong> this porphyrin decreased bacteriophage<br />
activity by 3–25%. The inhibition <strong>of</strong> lactophage
3 Inhibition <strong>of</strong> lactophage activity by porphyrin<br />
231<br />
activity by free base <strong>of</strong> quinolinilporphyrin was in the<br />
2–25% range (Fig. 2).<br />
Data obtained in the experiments with liquid<br />
medium demonstrate similarity to data obtained in the<br />
plaque reduction assay. The results <strong>of</strong> these experiments<br />
show that the presence <strong>of</strong> quinolinilporphyrin Zn complex<br />
in the nutrient medium prevents the propagation<br />
<strong>of</strong> bacteriophage infection in L. lactis.<br />
Growth intensity <strong>of</strong> this bacterium in the presence<br />
<strong>of</strong> bacteriophage E3 and concentrations 10 µM and<br />
20 µM <strong>of</strong> quinolinilporphyrin Zn complex reached up<br />
111%, as compared with control. These concentrations<br />
<strong>of</strong> compound were also effective against bacteriophages<br />
E5 and E17, wherein the bacterium growth intensity<br />
reached up 104% and 102%, respectively. The presence<br />
<strong>of</strong> 1 µM <strong>of</strong> this compound in the nutrient medium also<br />
inhibited phage activity and bacterial growth was in the<br />
range 43–82%. The minimal concentration <strong>of</strong> this porphyrin<br />
wasn’t effective in prevention <strong>of</strong> bacteriophage<br />
infection (Tabele I).<br />
Table I<br />
Lactococcus lactis subsp. lactis 502 growth intensity in presence<br />
<strong>of</strong> bacteriophages and different concentrations<br />
<strong>of</strong> porphyrins, OD 540 ×10 –3<br />
Quinolinilporphyrins E3 E5 E17<br />
TQP 0.1 μM 87 ± 24 351 ± 88 93 ± 7<br />
1 μM 65 ± 3 298 ± 66 59 ± 3<br />
10 μM 56 ± 8 261 ± 57 77 ± 20<br />
20 μM 236 ± 49 707 ± 93 292 ± 5<br />
Zn(II)TQP 0.1 μM 77 ± 7 391 ± 52 88 ± 6<br />
1 μM 818 ± 128 1945 ± 197 805 ± 104<br />
10 μM 1918 ± 69 2466 ± 106 1913 ± 53<br />
20 μM 1955 ± 21 1587 ± 94 1925 ± 29<br />
С1 105 ± 13 295 ± 53 71 ± 6<br />
С2 1757 ± 93 2364 ± 57 1890 ± 32<br />
<strong>No</strong>te: С 1 – L. lactis + bacteriophage in medium without porphyrins,<br />
С 2 – L. lactis without addition <strong>of</strong> bacteriophages<br />
Fig. 2. Inhibition <strong>of</strong> bacteriophage activity in plaque reduction assay.<br />
The free base <strong>of</strong> quinolinilporphyrin slightly inhibited<br />
the activity <strong>of</strong> lactophages only in its maximal<br />
concentration. Other concentrations <strong>of</strong> this compound<br />
didn’t affect the phage infection course in L. lactis.<br />
Taking into consideration that the studied compounds<br />
have antiviral effect it was reasonable to check<br />
their ability to affect the initial stage <strong>of</strong> infection. The<br />
influence <strong>of</strong> porphyrin on viral adsorption was studied<br />
by determination <strong>of</strong> unadsorbed phage.<br />
The obtained results show that though quinolinilporphyrin<br />
Zn complex had a good effect in lactococcal<br />
infection inhibition it didn’t influence the phage<br />
adsorption process. The free base <strong>of</strong> quinolinilporphyrin<br />
showed only slight inhibition <strong>of</strong> lactophage<br />
adsorption in concentration 10 µM and 21–37% at<br />
20 µM. (Table II). Perhaps this delay <strong>of</strong> bacteriophage<br />
adsorption can be mediated by aggregation with viral<br />
peptides. At the same time the Zn complex may have<br />
another mechanism <strong>of</strong> antiphage action. The target <strong>of</strong><br />
this porphyrin action can be bacteriophage DNA. It<br />
has been described that porphyrins can bind to DNA<br />
by intercalation between base pairs or external binding<br />
in a groove (Pasternack et al., 1983). Studies <strong>of</strong> cationic<br />
Table II<br />
Effect <strong>of</strong> porphyrins on lactophages adsorption<br />
to Lactococcus lactis subsp. lactis 502<br />
Quinolinilporphyrins<br />
E17<br />
Phage adsorption, %<br />
E17 E17<br />
TQP 0.1 μM 91 ± 2 96 ± 3 77 ± 3<br />
1 μM 88 ± 4 95 ± 1 84 ± 4<br />
10 μM 69 ± 1 72 ± 3 68 ± 1<br />
20 μM 59 ± 2 67 ± 2 68 ± 3<br />
Zn(II)TQP 0.1 μM 91 ± 2 97 ± 1 78 ± 2<br />
1 μM 92 ± 3 96 ± 2 85 ± 4<br />
10 μM 90 ± 1 96 ± 4 83 ± 3<br />
20 μM 90 ± 3 95 ± 1 85 ± 1<br />
Control 94 ± 2 97 ± 2 86 ± 3
232<br />
porphyrin binding to the isolated and encapsidated<br />
DNA <strong>of</strong> T7 bacteriophage have shown that the presence<br />
<strong>of</strong> the protein capsid in the phage particle does<br />
not exclude the interaction between porphyrin and<br />
intraphage DNA (Zupan et al., 2004). Besides, Duwat<br />
et al. (2001) have patented a process for preparing lactic<br />
acid bacteria starter cultures which comprises culturing<br />
bacteria under aeration and in an appropriate<br />
nutrient medium in the presence <strong>of</strong> some porphyrins.<br />
They suggest that the molecule <strong>of</strong> porphyrin can protect<br />
cells from oxidative damage. Their studies show that<br />
respiration conditions result in improved growth and<br />
a remarkable increase in long-term survival compared<br />
to growth under conventional fermentation conditions.<br />
Thus, the results <strong>of</strong> our investigation show that the<br />
Zn complex <strong>of</strong> quinolinilporphyrin can be considered<br />
a perspective antiphage agent and in taking into<br />
account the preceding information additional studies<br />
can be used as a medium component for starters in<br />
dairy industry.<br />
Literature<br />
C<strong>of</strong>fey A. and R.P. Ross. 2002. Bacteriophage-resistance systems in<br />
dairy starter strains: molecular analysis to application. Antonie van<br />
Leeuwenhoek 82: 303–321.<br />
Cowsert L.M. 1994. Treatment <strong>of</strong> papillomavirus infections: recent<br />
practice and future approaches. Intervirology 37: 226–230.<br />
Duwat P., S. Sourice, B. Cesselin, G. Lamberet, K. Vido, P. Gaudu,<br />
Y. Le Loir, F. Violet, P. Loubière and A. Gruss. 2001. Respiration<br />
capacity <strong>of</strong> the fermenting bacterium Lactococcus lactis and its positive<br />
effects on growth and survival. <strong>Journal</strong> <strong>of</strong> Bacteriology. 183:<br />
4509–4516.<br />
Vodzinska N. et al. 3<br />
Grandadam M., D. Ingrand and J.M. Huraux. 1995. Photodynamic<br />
inactivation <strong>of</strong> cell-free HIV strains by a red absorbing chlorin-type<br />
photosensitizer. <strong>Journal</strong> <strong>of</strong> Photochemistry and Photobiology B: Bio-<br />
logy 31: 171–177.<br />
Krulko I.V., A.V. Kharina, N.S. Vodzinska, T.O. Filipova and<br />
V.P. Polischuk. 2008. Antifitoviral activity <strong>of</strong> synthetic porphyrins in<br />
system in vivo. Ukrainian journal <strong>of</strong> agroecology. Spec. issue: 138–139.<br />
Krulko I.V., S.A. Zaika, A.V. Kharina, N.S. Vodzinska and<br />
V.P. Polischuk. 2009. Porphyrins as the inhibitors <strong>of</strong> viral infection<br />
in plant tissue culture. <strong>Microbiology</strong> & Biotechnology 2: 47–52.<br />
Kutter Elizabeth and Alexander Sulakvelidze (eds). 2005. Bacteriophages<br />
: biology and applications. CRC Press, Boca Raton – London<br />
– New York – Washington.<br />
Nitzan Y., H.M. Wexler and S.M. Finegold. 1994. Inactivation<br />
<strong>of</strong> anaerobic bacteria by various photosensitized porphyrins or by<br />
hemin. Current <strong>Microbiology</strong> 29: 125–131.<br />
<strong>No</strong>rth J., H. Neyndorff and J.G. Levy. 1993. Photosensitizers<br />
as virucidal agents. <strong>Journal</strong> <strong>of</strong> Photochemistry and Photobiology B:<br />
Bio logy. 17: 99–108.<br />
Pasternack R.F., E.J. Gibbs and J.J. Villafranca. 1983. Interactions<br />
<strong>of</strong> porphyrins with nucleic acids. Biochemistry 22: 2406–2414.<br />
Philippova T.O., B.N. Galkin, O.Yu. Zinchenko, M.Yu. Rusakova,<br />
V.A. Ivanitsa, Z.I. Zhilina, S.V. Vodzinskij and Yu.V. Ishkov. 2003.<br />
The antimicrobial properties <strong>of</strong> new synthetic porphyrins. <strong>Journal</strong><br />
<strong>of</strong> Porphyrins and Phthalocyanines 11–12: 737–742.<br />
Ramezani M., J. Behravan, M. Arab and S. Amel Farzad. 2008.<br />
Antiviral activity <strong>of</strong> Euphorbia helioscopia extract. <strong>Journal</strong> <strong>of</strong> Biological<br />
Sciences 8: 809–813.<br />
Terzaghi, B.E. and W.E. Sandine. 1975. Improved medium for<br />
lactic streptococci and their bacteriophages. Applied <strong>Microbiology</strong><br />
29: 807–813.<br />
Vodzinska N.S., T.O. Filipova, B.M. Galkin, Yu.V. Ishkov and<br />
G.M. Kirichenko. 2008. Staphylococcal bacteriophage inactivation<br />
in the presence <strong>of</strong> synthetic porphyrins. <strong>Microbiology</strong> & Biotechnology<br />
3: 82–88.<br />
Zupan K., L. Herenyi, K. Toth, Z. Majer and G.G. Csık. 2004.<br />
Binding <strong>of</strong> cationic porphyrin to isolated and encapsidated viral<br />
DNA analyzed by comprehensive spectroscopic methods. Biochemistry<br />
43: 9151–9159.
<strong>Polish</strong> <strong>Journal</strong> <strong>of</strong> <strong>Microbiology</strong><br />
2011, Vol. 60, <strong>No</strong> 3, 233–241<br />
ORIGINAL PAPER<br />
A Two-Step Strategy for Molecular Typing <strong>of</strong> Multidrug-Resistant<br />
Mycobacterium tuberculosis Clinical Isolates from Poland<br />
TOMASZ JAGIELSKI 1,2 *, EWA AUGUSTYNOWICZ-KOPEĆ 2 , KRZYSZTOF PAWLIK 3,4 ,<br />
JAROSŁAW DZIADEK 5 , ZOFIA ZWOLSKA 2 and JACEK BIELECKI 1<br />
1 Department <strong>of</strong> Applied <strong>Microbiology</strong>, Institute <strong>of</strong> <strong>Microbiology</strong>, Faculty <strong>of</strong> Biology,<br />
University <strong>of</strong> Warsaw, Warsaw, Poland<br />
2 Department <strong>of</strong> <strong>Microbiology</strong>, National Tuberculosis and Lung Diseases Research Institute, Warsaw, Poland<br />
3 Department <strong>of</strong> <strong>Microbiology</strong>, Institute <strong>of</strong> Immunology and Experimental Therapy,<br />
<strong>Polish</strong> Academy <strong>of</strong> Sciences, Wrocław, Poland<br />
4 Department <strong>of</strong> Toxicology, Wrocław Medical University, Wrocław, Poland<br />
5 Laboratory <strong>of</strong> Mycobacterium Genetics and Physiology, Institute for Medical Biology,<br />
<strong>Polish</strong> Academy <strong>of</strong> Sciences, Łódź, Poland<br />
Received 1 February 2011, revised 13 April 2011, accepted 30 April 2011<br />
Introduction<br />
Tuberculosis (TB) continues to be one <strong>of</strong> the greatest<br />
public health problems in the world. Despite significant<br />
improvements in diagnosis and treatment procedures,<br />
every year TB kills about 2 million people, while an<br />
estimated 9 million develop the disease (WHO, 2006).<br />
Of the major contributors to the global TB burden is<br />
the appearance and spread <strong>of</strong> drug-resistant (DR), and,<br />
particularly, multidrug-resistant Mycobacterium tuberculosis<br />
strains (MDR; defined as resistant to at least<br />
isoniazid [H] and rifampicin [R] – two major anti-TB<br />
drugs). In Poland, the phenomenon <strong>of</strong> drug resistance<br />
in TB has been closely monitored since the mid 1990s,<br />
when Poland joined the World Health Organization<br />
(WHO) and International Union Against Tuberculosis<br />
and Lung Disease (IUATLD) global project on anti-TB<br />
drug resistance surveillance, and performed in 1996 the<br />
Abstract<br />
Tuberculosis (TB) continues to be one <strong>of</strong> the most challenging public health problems in the world. An important contributor to the global<br />
burden <strong>of</strong> the disease is the emergence and spread <strong>of</strong> drug-resistant and particularly multidrug-resistant Mycobacterium tuberculosis strains<br />
(MDR), defined as being resistant to at least isoniazid and rifampicin. In recent years, the introduction <strong>of</strong> different DNA-based molecular<br />
typing methods has substantially improved the knowledge <strong>of</strong> the epidemiology <strong>of</strong> TB. The purpose <strong>of</strong> this study was to employ a combination<br />
<strong>of</strong> two PCR-based genotyping methods, namely spoligotyping and IS6110-Mtb1/Mtb2 PCR to investigate the clonal relatedness<br />
<strong>of</strong> MDR M. tuberculosis clinical isolates recovered from pulmonary TB patients from Poland. Among the 50 isolates examined, 28 (56%)<br />
were clustered by spoligotyping, whereas IS6110-Mtb1/Mtb2 PCR resulted in 16 (32%) clustered isolates. The isolates that clustered in both<br />
typing methods were assumed to be clonally related. A two-step strategy consisting <strong>of</strong> spoligotyping as a first-line test, performed on the<br />
entire pool <strong>of</strong> isolates, and IS6110-Mtb1/Mtb2 PCR typing as a confirmatory subtyping method, performed only within spoligotype-defined<br />
clusters, is an efficient approach for determining clonal relatedness among M. tuberculosis clinical isolates.<br />
K e y w o r d s: Mycobacterium tuberculosis, multidrug resistance, spoligotyping, IS6110-Mtb1/Mtb2 PCR<br />
first prospective, country-wide survey (Zwolska et al.,<br />
2000). Based on the data <strong>of</strong> the 3 rd national survey on<br />
TB drug resistance conducted in 2004, the number <strong>of</strong><br />
DR- and MDR-TB cases was 246 (7.6%) and 51 (1.6%),<br />
respectively, placing Poland among the countries with<br />
relatively low DR-TB rates in the world (WHO and<br />
IUATLD, 2008).<br />
Over the last several years, the application <strong>of</strong> different<br />
DNA-based molecular typing methods has substantially<br />
improved our knowledge <strong>of</strong> the epidemiology<br />
<strong>of</strong> TB (Mathema et al., 2006). The usefulness <strong>of</strong> those<br />
methods has been demonstrated primarily as epidemiological<br />
markers to discriminate the pathogen at the<br />
genus, species, and subspecies level. The strain-level differentiation<br />
is <strong>of</strong> crucial importance for disclosing the<br />
sources <strong>of</strong> infection (exogenous vs endogenous acquisition),<br />
elucidating its potential routes <strong>of</strong> transmission,<br />
determining whether the infection is caused by a single<br />
* Corresponding author: T. Jagielski, Department <strong>of</strong> Applied <strong>Microbiology</strong>, Institute <strong>of</strong> <strong>Microbiology</strong>, Faculty <strong>of</strong> Biology, University<br />
<strong>of</strong> Warsaw; Miecznikowa 1, 02-096 Warsaw; phone: +48 22 5541311; fax: +48 22 5541402; e-mail: t.jagielski@biol.uw.edu.pl
234<br />
strain or by multiple strains (homogeneous vs mixed<br />
infection), and whether recurrence <strong>of</strong> the disease is<br />
attributable to treatment failure, that is relapse <strong>of</strong> infection<br />
with the original strain, or infection with a new<br />
strain <strong>of</strong> M. tuberculosis (endogenous reactivation vs<br />
exogenous reinfection). Furthermore, strain typing<br />
can be used to study the molecular mechanisms that<br />
mediate host-pathogen interactions or to identify the<br />
genotype-specific differences in the phenotypic characteristics,<br />
such as virulence, sensitivity to antimicrobial<br />
agents, organ tropism, transmissibility etc. (Mathema<br />
et al., 2006).<br />
The purpose <strong>of</strong> this study was to employ a combination<br />
<strong>of</strong> two PCR-based genotyping methods, namely<br />
spoligotyping and IS6110-Mtb1/Mtb2 PCR to investigate<br />
the clonal relatedness <strong>of</strong> MDR M. tuberculosis<br />
clinical isolates recovered from pulmonary TB patients<br />
(PTB) from Poland.<br />
Experimental<br />
Material and Methods<br />
Patients and bacterial strains. The study included<br />
a total <strong>of</strong> 50 MDR M. tuberculosis isolates recovered<br />
from 46 unrelated adult PTB patients from Poland<br />
(two isolates were obtained from each <strong>of</strong> four patients).<br />
The MDR-TB cases included in this study represen ted<br />
all bacteriologically-confirmed MDR-TB cases reported in<br />
Poland throughout 2004. Patients (40 men and 6 women;<br />
age range, 31 to 79 years; median age, 50.5 years) were<br />
recruited in 20 TB clinics in 11 <strong>Polish</strong> voivodeships: ku-<br />
jawsko-pomorskie (8 patients), mazowieckie (8), dolno-<br />
śląskie (7), lubelskie (7), śląskie (5), małopolskie (4),<br />
łódzkie (2), pomorskie (2), podlaskie (1), świętokrzys-<br />
kie (1) zachodnio-pomorskie (1), during a 1-year period<br />
(i.e. from 1 January 2004 to 31 December 2004). Primary<br />
isolation, species identification, and drug susceptibility<br />
testing (DST) were done at the regional mycobacteriology<br />
laboratories. The isolates were subcultured<br />
and sent to the National TB Reference Laboratory<br />
(NTRL) at the National Tuberculosis and Lung Diseases<br />
Research Institute in Warsaw, where confirmatory identification<br />
and DST were performed. Susceptibility testing<br />
to the first-line drugs was carried out according to<br />
the 1% proportion method, in Löwenstein-Jensen (L-J)<br />
medium, with the following critical concentrations: isoniazid<br />
[H] (0.2 µg/ml), rifampicin [R] (40 µg/ml), streptomycin<br />
[S] (4 µg/ml), and ethambutol [E] (2 µg/ml).<br />
Patient demographic and clinical characteristics were<br />
collected from the hospitalization records.<br />
Apart from the patient clinical isolates, two reference<br />
strains were used for spoligotyping, i.e.: M. tuberculosis<br />
H 37 Rv and M. bovis BCG.<br />
Jagielski T. et al. 3<br />
DNA isolation. Genomic DNA was obtained from<br />
M. tuberculosis colonies on L-J slants by the cetyltrimethyl-ammonium<br />
bromide (CTAB) method (van<br />
Embden et al., 1993).<br />
Genotyping methods. Spoligotyping was performed<br />
with a commercially available kit (Isogen Bioscience<br />
BV, Maarssen, The Netherlands) according<br />
to the instructions provided by the manufacturer and<br />
as described previously (Kamerbeek et al., 1997). The<br />
IS6110-Mtb1/Mtb2 PCR typing was performed according<br />
to the methodo logy described earlier (Kotłowski<br />
et al., 2004). Briefly, 2 μl <strong>of</strong> PvuII-restricted genomic<br />
DNA was used for two PCR assays, using a combination<br />
<strong>of</strong> primers IS1 and IS2, binding to the inverted repeats<br />
flanking IS6110, and either Mtb1 or Mtb2 primers,<br />
targeted to the repeated GC-rich sequences. The PCR<br />
products were resolved electrophoretically on 2% agarose<br />
gels and visualized under UV light after ethidium<br />
bromide staining.<br />
Analysis <strong>of</strong> genotyping results. The spoligotyping<br />
results were read independently by two observers,<br />
expressed as an octal code, entered in an Excel spreadsheet<br />
file and compared to the international spoligotype<br />
database (SpolDB4) at the Pasteur Institute <strong>of</strong> Guadeloupe<br />
(www.pasteur-guadeloupe.fr/tb/spoldb4), which<br />
at the time <strong>of</strong> matching analysis contained 39,295 patterns<br />
split into 1,939 shared types and 3,370 orphan<br />
pr<strong>of</strong>iles from 122 countries (Brudey et al., 2006b).<br />
A spoligotype cluster (the term „cluster” always<br />
referred to a group <strong>of</strong> at least two isolates that derived<br />
from different patients) was defined as two or more<br />
isolates exhibiting 100% identity <strong>of</strong> their spoligotype<br />
patterns, whereas those non-clustered were referred to<br />
as unique. The isolates whose spoligotype patterns were<br />
already recorded in the database, were assigned “shared<br />
types”, whereas those <strong>of</strong> spoligotypes identified for the<br />
first time, were designated either as “new shared types”<br />
(if 2 or more) or as “orphans” (if occurred only once).<br />
The SpolDB4 was also used to assign genotype<br />
families to the spoligotypes obtained. The spoligotypes<br />
absent in the SpolDB4 database, or <strong>of</strong> unknown family<br />
(“U”), were identified at a family level by the “Spot-<br />
Clust” program, which implements a mixture model<br />
built on the SpolDB3 database (Vitol et al., 2006; http://<br />
cgi2.cs.rpi.edu/~bennek/SPOTCLUST.html).<br />
In IS6110-Mtb1/Mtb2 PCR typing, the patterns<br />
obtained in each <strong>of</strong> the two PCR assays, dependently on the<br />
primer combination (Mtb1-IS1-IS2 or Mtb2-IS1-IS2),<br />
were analysed separately with LabWorks 4.5 s<strong>of</strong>tware<br />
(UVP, Inc., Upland, CA, USA) and by visual inspection.<br />
The molecular sizes <strong>of</strong> the PCR fragments were<br />
calculated using a 50-bp DNA ladder (Promega) as<br />
a molecular weight standard. Strains whose band patterns<br />
were identical (with a 5.0% band size tolerance)<br />
were defined as indistinguishable. However, isolates
3 A two-step strategy for M. tuberculosis typing<br />
235<br />
with less than 5 bands were defined as different, even<br />
if there was a single-band difference. Only if indistinguishable<br />
upon IS6110-Mtb1 and IS6110-Mtb2 PCR<br />
typing, the strains were considered clustered. The isolates<br />
were assumed clonally related only if clustered by<br />
both genotyping methods.<br />
A spoligotype-based dendrogram was generated<br />
with BioNumerics s<strong>of</strong>tware (Applied Maths, Kortrijk,<br />
Belgium), whereas dendrograms based on IS6110-<br />
Mtb1/Mtb2 PCR analyses were drawn using the Gel-<br />
Quest/ClusterVis (Sequentix, Klein Raden, Germany).<br />
Similarity between fingerprints was each time calculated<br />
with the Dice’s coefficient, and clustering was<br />
performed using UPGMA (Unweighted Pair Group<br />
Method with Arithmetic Averages) algorithm.<br />
Results<br />
Spoligotyping <strong>of</strong> the analysed M. tuberculosis isolates<br />
produced a total <strong>of</strong> 27 different spoligotype patterns.<br />
Of these, 7 patterns defined as many clusters,<br />
including 28 (56%) isolates from 26 (56.5%) patients<br />
(the size <strong>of</strong> the clusters ranged from 2 to 8 isolates). The<br />
remaining 20 spoligotypes were unique, being found<br />
in 22 (44%) isolates from 20 (43.5%) patients (in two<br />
cases, both isolates from the same patient had identical<br />
spoligotypes).<br />
By comparison with the international spoligotype<br />
database (SpolDB4), 40 isolates from 37 (80.4%)<br />
patients harboured spoligotypes that had already been<br />
reported. For those isolates, specific international<br />
Fig. 1. Spoligotype dendrogram drawn for the 50 M. tuberculosis isolates used in this study.<br />
A, spoligotype hybridization pattern; B, isolate number; C, drug resistance pr<strong>of</strong>ile; D, molecular family; E, shared type (ST) designation, according to<br />
the SpolDB4; H, isoniazid; R, rifampicin; E, ethambutol; S, streptomycin; C1-C3, reference strains: M. tuberculosis H Rv (C1, C2), M. bovis BCG (C3);<br />
37<br />
Nf – not found (in the SpolDB4); Unk, family unknown. <strong>No</strong>te the double isolates from the same patient were put in frames (1–4).
236<br />
shared-type (ST) designations could be assigned<br />
(Fig. 1). The most prevalent among the 19 SpolDB4defined<br />
spoligotypes found in this study were: ST53,<br />
ST891, ST1, ST1557, and ST1051, embracing 8, 5, 4, 4,<br />
and 3 isolates, respectively.<br />
Nine (19.6%) patients had isolates whose spoligotypes<br />
did not match any existing ST. Two <strong>of</strong> those spoligotypes<br />
were defined as new STs, as they were common<br />
in 2 isolates from one patient or 2 isolates from two<br />
different patients. Those new STs were designated “A”,<br />
and “B”, respectively. Another 6 spoligotypes (designated<br />
“C”-“H”) that were unrecorded in the SpolDB4<br />
occurred only once, and were thus defined as orphan<br />
types (Table I).<br />
Analysis <strong>of</strong> the geographical distribution <strong>of</strong> the spoligotypes<br />
found in this study revealed that 16 (59.2%)<br />
spoligotypes, representative <strong>of</strong> 37 (74%) isolates, had<br />
been observed in Poland previously (in past studies).<br />
Jagielski T. et al. 3<br />
Table I<br />
Spoligotypes unrecorded in the SpolDB4 and their family assignment by SpotClust analysis<br />
Spoligotype a Family b P c N d<br />
Binary Octal<br />
1. A ■■■■■■■■■■■■■ oooo■ ooooooo■■■■■■■ oooo■■■■■■■ 777741003760771 LAM9 0.94 2 (11420; 12489)<br />
2. B oooooooooooooooo■ ooooooooooooooooooooo■ oo■■ 000002000000111 LAM7 0.69 2 (1324; 4832) *<br />
3. C ooo■■■■■oo■■■■■■■■■■■o■■■■■■■■■■oooo■■■■■■■ 076377737760771 S 0.78 1 (469)<br />
4. D ■■■■■■■■■ooooooooooooooooo■■■■■■oooo■■■■■■■ 777000001760771 T4 0.97 1 (2575)<br />
5. E ■■■■■■■■■■■■■■■■■■■■■■■■■oooooo■oooo■■■oo■■ 777777774020711 H1 0.99 1 (1377)<br />
6. F ■■■■■■■■■■■■o■■■■■■■■■■■■■■■■oooooooooooo■■ 777737777600011 T2 0.91 1 (5895)<br />
7. G ■■■■■■o■oo■ooooo■o■■■■■■■■■■■■■■oooo■■■■■■■ 772202777760771 S 0.95 1 (124)<br />
8. H ■■■■■■■■■■■■■■■o■■oooo■■■■■■■■■■oooo■■■■■■■ 777773037760771 H Rv 37 0.98 1 (4991)<br />
9. 775 ■■■■■■■■■■■■■■■■■■■■■■■■■■■oooooooooo■■■■■■ 777777777000371 H3 0.69 1 (101)<br />
a Spoligotype, A-H, arbitrary spoligotype designation;<br />
b SpotClust-assigned family;<br />
c P, probability <strong>of</strong> the spoligotype pattern to belong to the family;<br />
d N, number <strong>of</strong> isolates; in brackets are given isolate numbers; an asterisk indicates isolates from the same patient.<br />
The family assignment, based upon SpolDB4 and<br />
SpotClust analysis revealed that 42% <strong>of</strong> the isolates<br />
belonged to the T family, 22% to the Latin American<br />
Mediterranean (LAM) family, and 18% to the Haarlem<br />
(H) family. Four other minor families, that is Beijing,<br />
S, X, and H 37 Rv family accounted for 8%, 6%, 2%, and<br />
2% <strong>of</strong> all isolates, respectively.<br />
With the aim <strong>of</strong> further differentiation, all patient<br />
isolates were subjected to IS6110-Mtb1/Mtb2 PCR typing.<br />
The results showed that 10 (35.7%) isolates being<br />
part <strong>of</strong> spoligotype clusters produced unique banding<br />
patterns. Thus, one spoligotype cluster (ST37)<br />
was ruled out. Another cluster (ST53), containing 8<br />
isolates from 6 patients was split into two subgroups;<br />
the first was composed <strong>of</strong> two isolates from the same<br />
patient, while the second was comprised <strong>of</strong> 3 isolates,<br />
<strong>of</strong> which 2 belonged to one patient. (The latter group<br />
met the criterion <strong>of</strong> a cluster). The IS6110-Mtb1/Mtb2<br />
Fig. 2. IS6110-Mtb1/Mtb2 PCR patterns for two selected spoligotype-defined clusters: ST53 (A) and ST1557 (B).<br />
I and II designate two PCR assays with IS1-IS2-Mtb1 (I) and IS1-IS2-Mtb2 (II) primer combination; MW, molecular weight marker. Numbers above the<br />
gel lines are isolate numbers. Asterisks (*; **) indicate isolates from the same patient. <strong>No</strong>te that isolates with identical DNA fingerprints were put in frames.
3 A two-step strategy for M. tuberculosis typing<br />
237<br />
Table II<br />
Clustering results <strong>of</strong> the two genotyping methods used<br />
in this study<br />
Method<br />
<strong>No</strong> <strong>of</strong><br />
clustered<br />
isolates<br />
(%)<br />
<strong>No</strong> <strong>of</strong><br />
clusters<br />
Size <strong>of</strong><br />
cluster<br />
Spoligotyping 28 (56) 7 2–8 0.9535<br />
IS6110-Mtb1 PCR 17 (34) 6 2–4 0.9837<br />
IS6110-Mtb2 PCR 16 (32) 6 2–4 0.9853<br />
IS6110-Mtb1/Mtb2 PCR 16 (32) 6 2–4 0.9853<br />
HGDI<br />
PCR patterns <strong>of</strong> the remaining three isolates from the<br />
spoligotype cluster ST53 were unique (Fig. 2A). In three<br />
clusters, the number <strong>of</strong> clustered isolates dropped from<br />
5 to 4 (ST891), and from 4 to 2 (ST1, ST1557). Only<br />
2 spoligotype clusters (ST1051, “A”), containing 3 and<br />
2 isolates respectively, were identical with IS6110-Mtb1/<br />
Mtb2 PCR.<br />
For the 22 isolates with unique spoligotypes, the patterns<br />
generated by IS6110-Mtb1/Mtb2 PCR were also<br />
found unique.<br />
In IS6110-Mtb1/Mtb2 PCR typing, the clustering <strong>of</strong><br />
the patterns generated from each <strong>of</strong> the two PCR assays,<br />
with either Mtb1-IS1-IS2 or Mtb2-IS1-IS2 primer combination<br />
was highly concordant (Fig. 3). The only difference<br />
was in the subtyping within the ST1557 cluster.<br />
Three or two isolates clustered when IS6110-Mtb1- or<br />
-Mtb2 PCR was performed (Fig. 2B).<br />
In all four cases, double isolates from the same<br />
patient were identical with respect to their spoligotypes<br />
and IS6110-Mtb1/Mtb2 PCR patterns.<br />
Clustering results obtained with each <strong>of</strong> the two typing<br />
methods are compared in Table II.<br />
Overall, a combined analysis <strong>of</strong> spoligotyping and<br />
IS6110-Mtb1/Mtb2 PCR resulted in 6 clusters comprising<br />
<strong>of</strong> 16 isolates (32% <strong>of</strong> all isolates) from 15 patients<br />
(32.6% <strong>of</strong> all patients). The isolates within those clusters<br />
were assumed to be clonally related.<br />
Discussion<br />
Although M. tuberculosis constitutes a remarkably<br />
genetically homogeneous species, various repetitive<br />
DNA elements have been found in the M. tuberculosis<br />
genome that contribute to strain variation, thus providing<br />
excellent targets for molecular typing methods.<br />
The method most widely used for M. tuberculosis strain<br />
differentiation, considered the “gold standard” in the<br />
molecular epidemiology <strong>of</strong> TB, has been the IS6110based<br />
restriction fragment length polymorphism<br />
(RFLP) analysis, which detects, through Southern blotting,<br />
a specific repetitive element insertion sequence<br />
IS6110, whose number <strong>of</strong> copies and distribution<br />
throughout the mycobacterial chromosome varies<br />
between the strains (Thierry et al., 1990; van Embden<br />
et al., 1993). Other repetitive element-based DNA fingerprinting<br />
techniques include spoligotyping, which<br />
relies on determining the presence or absence <strong>of</strong> unique<br />
spacer sequences interspersing the direct repeats (DRs)<br />
within the DR locus <strong>of</strong> the M. tuberculosis chromosome<br />
(Kamerbeek, et al., 1997), DRE-(double-repetitiveelement)<br />
PCR, based on the detection <strong>of</strong> inter-IS6110-<br />
PGRS (polymorphic GC-rich sequence) polymorphism<br />
(Friedman et al., 1995) or more recently MIRU-VNTR<br />
(mycobacterial interspersed repetitive unit-variable<br />
number <strong>of</strong> tandem repeats) typing, which targets the<br />
polymorphism <strong>of</strong> different tandem DNA repeats scattered<br />
in various intergenic loci in the mycobacterial<br />
genome (Supply et al., 2000; Supply et al., 2001).<br />
In the molecular epidemiology studies <strong>of</strong> TB, the<br />
choice <strong>of</strong> the most appropriate typing method is <strong>of</strong> the<br />
utmost importance. First <strong>of</strong> all, such a method should<br />
have high enough discriminatory power to clearly discriminate<br />
among unrelated isolates <strong>of</strong> M. tuberculosis<br />
and at the same time to establish a clonal relationship<br />
between related strains. The higher the discriminatory<br />
power <strong>of</strong> the method, the greater the probability that<br />
the isolates within the clusters are truly related. The use<br />
<strong>of</strong> a poorly discriminative technique will overestimate<br />
the number <strong>of</strong> clustered isolates, thus leading to a false<br />
reconstruction <strong>of</strong> the transmission patterns within the<br />
population studied. Spoligotyping, which has important<br />
advantages <strong>of</strong> technical simplicity, robustness, time- and<br />
cost-effectiveness, portability and high reproducibility,<br />
has been repeatedly shown to overestimate clustering<br />
(Kremer et al., 1999; Gori et al., 2005). For instance,<br />
in a study <strong>of</strong> Gori et al. (2005), the number <strong>of</strong> isolates<br />
with identical spoligotypes was twice the number <strong>of</strong><br />
isolates with identical IS6110-RFLP patterns. The low<br />
discriminatory capacity <strong>of</strong> the spoligotyping precludes<br />
its use as a sole genotyping method for epidemiological<br />
studies. However, spoligotyping has been found highly<br />
efficient when used in association with a second-line<br />
test, such as IS6110-RFLP (Goyal et al., 1997; Gori et al.,<br />
2005) or a PCR-based method, such as DRE-PCR (Sola<br />
et al., 1998) or MIRU-VNTR typing (Sola et al., 2003;<br />
Oelemann et al., 2007).<br />
Although the IS6110-RFLP is the reference technique<br />
for genotyping M. tuberculosis, because <strong>of</strong> its<br />
high discriminatory index, several limitations and<br />
drawbacks have been demonstrated for this method.<br />
First, it requires large amount <strong>of</strong> extracted and highly<br />
purified DNA, necessitating lengthy subculturing <strong>of</strong><br />
M. tuberculosis. Second, it provides insufficient discrimination<br />
among isolates carrying six or fewer copies <strong>of</strong><br />
IS6110 (Bauer et al., 1999; Kremer et al., 1999). Finally,<br />
IS6110-RFLP suffers from the difficulty <strong>of</strong> analysing and
238<br />
interpreting <strong>of</strong> complex banding patterns. Databasing<br />
and interlaboratory comparison <strong>of</strong> the IS6110-RFLP<br />
pr<strong>of</strong>iles are technically demanding, requiring specialized<br />
s<strong>of</strong>tware and expertise in its operation. Consequently,<br />
there is still a need for novel genetic markers<br />
that would unambiguously distinguish genetically<br />
related from genetically distinct (unrelated) isolates.<br />
A strategy integrating two rapid PCR-based methods<br />
has been suggested as a potential alternative to IS6110-<br />
Jagielski T. et al. 3<br />
Fig. 3A.<br />
RFLP for genotyping <strong>of</strong> M. tuberculosis (Goguet de la<br />
Salmonière et al., 1997). The best results were achieved<br />
when combining spoligotyping with MIRU-VNTR typing.<br />
The discrimination ability <strong>of</strong> such a system was<br />
found to be higher that that <strong>of</strong> IS6110-RFLP analysis<br />
(Oelemann et al., 2007; Allix-Beguec et al., 2008).<br />
In this study, we evaluated the applicability <strong>of</strong> another<br />
two-step strategy in typing M. tuberculosis clinical isolates.<br />
The strategy involved two PCR-based methods:
3 A two-step strategy for M. tuberculosis typing<br />
239<br />
Fig. 3. Dendrogram generated for the 50 M. tuberculosis isolates, based on computer-assisted comparison <strong>of</strong> DNA fingerprints obtained<br />
in two PCR assays with IS1-IS2-Mtb1 (A) and IS1-IS2-Mtb2 (B) primer combination.<br />
Roman numerals (I–IX; i–ix) indicate groups <strong>of</strong> 2 or more isolates harbouring identical banding patterns. Only groups indicated I–V, and VIII, as well<br />
as groups indicated ii–iv, and vi–viii are clusters. <strong>No</strong>te the double isolates from the same patient were put in frames (1–4).<br />
spoligotyping and IS6110-Mtb1/Mtb2 PCR. The latter<br />
method has been proposed as a new marker system for<br />
strain differentiation <strong>of</strong> tubercle bacilli by Kotłowski<br />
et al. (2004). The strength <strong>of</strong> this method is that it is fast,<br />
fairly robust, and easy to perform. More importantly, it<br />
possesses high discriminatory power, higher that that <strong>of</strong><br />
spoligotyping and MIRU-VNTR typing, and comparable<br />
to that <strong>of</strong> IS6110-RFLP, as indicated in preliminary<br />
studies (Sajduda et al., 2006). The superiority <strong>of</strong> the<br />
IS6110-Mtb1/Mtb2 PCR over spoligotyping, in terms<br />
<strong>of</strong> discriminatory potential, was further demonstrated<br />
in two studies by Augustynowicz-Kopeć et al. (2007;
240<br />
2008b). This was also confirmed in the present study.<br />
The clustering rate for spoligotyping and IS6110-Mtb1/<br />
Mtb2 PCR was 56% and 32%, respectively. It should<br />
also be stressed here that in all studies utilizing IS6110-<br />
Mtb1/Mtb2 PCR typing, carried out so far (including<br />
the present one), isolates with unique spoligotypes also<br />
bore unique IS6110-Mtb1/Mtb2 PCR patterns. This<br />
observation justifies the performance <strong>of</strong> IS6110-Mtb1/<br />
Mtb2 PCR typing only within spoligotype clusters (i.e.<br />
for differentiation <strong>of</strong> isolates belonging to spoligotype<br />
clusters). A two-step protocol, in which spoligotyping<br />
is used as a preliminary screening test, and is followed<br />
by another typing method, <strong>of</strong> greater discriminatory<br />
capacity, performed on isolates with the same spoligotypes,<br />
has already been deployed by other investigators<br />
(Goguet de la Salmonière et al., 1997; Sola et al., 1998;<br />
Brudey et al., 2006a).<br />
Accurate assessment <strong>of</strong> genetic relatedness between<br />
M. tuberculosis isolates depends on cluster definition.<br />
Most studies, including the current one, define “clustered<br />
isolates” as those sharing an identical DNA fingerprint.<br />
In general, the more lenient the criteria, the<br />
higher chance <strong>of</strong> finding clusters, but the lower the likelihood<br />
that a cluster represents clonally related isolates,<br />
being part <strong>of</strong> the same chain <strong>of</strong> TB transmission (Glynn<br />
et al., 1999). However, in certain studies a single band<br />
difference between two DNA fingerprints is an allowable<br />
criterion to define a cluster (Goyal et al., 1997; Lari<br />
et al., 2007). This tolerance is supported by the documented<br />
cases <strong>of</strong> TB transmission between patients<br />
whose isolates had similar but not identical genotypic<br />
patterns (Ijaz et al., 2002). Based on the results from<br />
this study, the situation described above might have<br />
occurred only in one case. Among four isolates belonging<br />
to the ST1557 spoligotype cluster, two isolates had<br />
identical IS6110-Mtb1/Mtb2 PCR patterns, whereas<br />
one isolate differed from them by a single band, in<br />
only one PCR assay (with Mtb2-IS1-IS2 primer set)<br />
(Fig. 2B). Hence, in this particular situation, not two<br />
but three isolates could make up the final cluster. In all<br />
the remaining cases, the patterns resulted from subtyping<br />
<strong>of</strong> spoligotype clusters were either identical or<br />
differed by at least two bands.<br />
Regarding the phylogenetic structure <strong>of</strong> the M. tuber-<br />
culosis population studied, inferred by confronting the<br />
spoligotyping results with the international spoligotype<br />
database (SpolDB4), three families: T, LAM, and<br />
Haarlem were shown predominant, accommodating<br />
82% <strong>of</strong> the patients’ isolates. Overall, the genetic structure<br />
<strong>of</strong> <strong>Polish</strong> MDR M. tuberculosis isolates was characteristic<br />
<strong>of</strong> a European country (Brudey et al., 2006a;<br />
David et al., 2007; Lari et al., 2007). It was also similar<br />
to what had been reported for DR-TB in Poland in the<br />
past years (Sajduda et al., 2004; Augustynowicz-Kopeć<br />
et al., 2008a). The finding that 74% <strong>of</strong> the isolates from<br />
Jagielski T. et al. 3<br />
the MDR-TB cases studied displayed spoligotypes that<br />
had previously been shown in Poland may suggest that<br />
strains with these genotypes have been circulating in<br />
Poland for a long time and have been actively transmitted<br />
within the country. The presence <strong>of</strong> unique spoligotypes,<br />
hitherto unreported in the spoligotype database<br />
may suggest their specificity to the study setting.<br />
In conclusion, this study demonstrates the usefulness<br />
<strong>of</strong> a two-step strategy consisting <strong>of</strong> spoligotyping<br />
as a first-line test, performed on the entire pool <strong>of</strong><br />
isolates, and IS6110-Mtb1/Mtb2 PCR typing as a confirmatory<br />
subtyping method, performed only within<br />
spoligotype-defined clusters, for determining the clonal<br />
relatedness among M. tuberculosis clinical isolates.<br />
Literature<br />
Allix-Beguec C., M. Fauville-Dufaux and P. Supply. 2008. Threeyear<br />
population-based evaluation <strong>of</strong> standardized mycobacterial<br />
interspersed repetitive-unit-variable-number tandem-repeat typing<br />
<strong>of</strong> Mycobacterium tuberculosis. J. Clin. Microbiol. 46: 1398–1406.<br />
Augustynowicz-Kopeć E., M. Kozińska, A. Zabost, S. Brzezińska,<br />
M. Anielak, T. Jagielski, D. Krawiecka, R. Grzesica, W. Szymkowicz,<br />
L. Maciak and Z. Zwolska. 2007. Molecular epidemiology <strong>of</strong><br />
pulmonary tuberculosis among closely related people (in <strong>Polish</strong>).<br />
Pneumonol. info 4: 14–22.<br />
Augustynowicz-Kopeć E., T. Jagielski and Z. Zwolska. 2008a.<br />
Genetic diversity <strong>of</strong> isoniazid-resistant Mycobacterium tuberculosis<br />
isolates collected in Poland and assessed by spoligotyping. J. Clin.<br />
Microbiol. 46: 4041–4044.<br />
Augustynowicz-Kopeć E., T. Jagielski, M. Kozińska, A. Zabost,<br />
M. Klatt and Z. Zwolska. 2008b. Molecular analysis <strong>of</strong> drug-resistant<br />
Mycobacterium tuberculosis isolates collected in central Poland.<br />
Clin. Microbiol. Infect. 14: 605–607.<br />
Bauer J., A.B. Andersen, K. Kremer and H. Miorner. 1999. Usefulness<br />
<strong>of</strong> spoligotyping to discriminate IS6110 low-copy-number<br />
Mycobacterium tuberculosis complex strains cultured in Denmark.<br />
J. Clin. Microbiol. 37: 2602–2606.<br />
Brudey K., I. Filliol, S. Ferdinand, V. Guernier, P. Duval,<br />
B. Maubert, C. Sola and N. Rastogi. 2006a. Long-term populationbased<br />
genotyping study <strong>of</strong> Mycobacterium tuberculosis complex isolates<br />
in the French departments <strong>of</strong> the Americas. J. Clin. Microbiol.<br />
44: 183–191.<br />
Brudey K., J.R. Driscoll, L. Rigouts, W.M. Prodinger, A. Gori,<br />
S.A. Al-Hajoj, C. Allix, L. Aristimuño, J. Arora, V. Baumanis<br />
and others. 2006b. Mycobacterium tuberculosis complex genetic<br />
diversity: mining the fourth international spoligotyping database<br />
(SpolDB4) for classification, population genetics and epidemiology.<br />
BMC Microbiol. 6: 23.<br />
David S., D.R. Ribeiro, A. Antunes, C. Portugal, L. Sancho and<br />
J.G. de Sousa. 2007. Contribution <strong>of</strong> spoligotyping to the characterization<br />
<strong>of</strong> the population structure <strong>of</strong> Mycobacterium tuberculosis<br />
isolates in Portugal. Infect. Genet. Evol. 7: 609–617.<br />
Friedman C.R., M.Y. Stoeckle, W.D. Johnson and L.W. Riley. 1995.<br />
Double-repetitive-element PCR method for subtyping Mycobacterium<br />
tuberculosis clinical isolates. J. Clin. Microbiol. 33: 1383–1384.<br />
Glynn J.R., J. Bauer, A.S. de Boer, M.W. Borgdorff, P.E.M. Fine,<br />
P. Godfrey-Faussett and E. Vynnycky. 1999. Interpreting DNA<br />
fingerprint clusters <strong>of</strong> Mycobacterium tuberculosis. Int. J. Tuberc.<br />
Lung Dis. 3: 1055–1060.
3 A two-step strategy for M. tuberculosis typing<br />
241<br />
Goguet de la Salmonière Y.O., H.M. Li, G. Torrea, A. Bunschoten,<br />
J.D.A. van Embden and B. Gicquel. 1997. Evaluation <strong>of</strong> spoligotyping<br />
in a study <strong>of</strong> the transmission <strong>of</strong> Mycobacterium tuberculosis.<br />
J. Clin. Microbiol. 35: 2210–2214.<br />
Gori A., A. Bandera, G. Marchetti, A. Degli Esposti, L. Catozzi,<br />
G.P. Nardi, L. Gazzola, G. Ferrario, J.D.A. van Embden, D. van<br />
Soolingen and others. 2005. Spoligotyping and Mycobacterium<br />
tuberculosis. Emerg. Infect. Dis. 11: 1242–1248.<br />
Goyal M., N.A. Saunders, J.D.A. van Embden, D.B. Young and<br />
R.J. Shaw. 1997. Differentiation <strong>of</strong> Mycobacterium tuberculosis isolates<br />
by spoligotyping and IS6110 restriction fragment length polymorphism.<br />
J. Clin. Microbiol. 35: 647–651.<br />
Ijaz K., Z. Yang, H.S. Matthews, J.H. Bates and M.D. Cave.<br />
2002. Mycobacterium tuberculosis transmission between cluster<br />
members with similar fingerprint patterns. Emerg. Infect. Dis. 8:<br />
1257–1259.<br />
Kamerbeek J., L. Schouls, A. Kolk, M. van Agterveld, D. van<br />
Soolingen, S. Kuijper, A. Bunschoten, H. Molhuizen, R. Shaw,<br />
M. Goyal and J.D.A. van Embden. 1997. Simultaneous detection<br />
and strain differentiation <strong>of</strong> Mycobacterium tuberculosis for diagnosis<br />
and epidemiology. J. Clin. Microbiol. 35: 907–914.<br />
Kotłowski R., I.C. Shamputa, N.A. El Aila, A. Sajduda, L. Rigouts,<br />
A. van Deun and F. Portaels. 2004. PCR-based genotyping <strong>of</strong><br />
Mycobacterium tuberculosis with new GC-rich repeated sequences<br />
and IS6110 inverted repeats used as primers. J. Clin. Microbiol. 42:<br />
372–377.<br />
Kremer K., D. van Soolingen, R. Frothingham, H.W. Haas,<br />
P.W. Hermans, C. Martin, P. Palittapongarnpim, B.B. Plikaytis,<br />
L.W. Riley, M.A. Yakrus and others. 1999. Comparison <strong>of</strong> methods<br />
based on different molecular epidemiological markers for typing <strong>of</strong><br />
Mycobacterium tuberculosis complex strains: interlaboratory study<br />
<strong>of</strong> discriminatory power and reproducibility. J. Clin. Microbiol. 37:<br />
2607–2618.<br />
Lari N., L. Rindi, D. Bonanni, N. Rastogi, C. Sola, E. Tortoli and<br />
C. Garzelli. 2007. Three-year longitudinal study <strong>of</strong> genotypes <strong>of</strong><br />
Mycobacterium tuberculosis isolates in Tuscany, Italy. J. Clin. Microbiol.<br />
45: 1851–1857.<br />
Mathema B., N.E. Kurepina, P.J. Bifani and B.N. Kreiswirth.<br />
2006. Molecular epidemiology <strong>of</strong> tuberculosis: current insights.<br />
Clin. Microbiol. Rev. 19: 658–685.<br />
Oelemann M.C., R. Diel, V. Vatin, W. Haas, S. Rusch-Gerdes,<br />
C. Locht, S. Niemann and P. Supply. 2007. Assessment <strong>of</strong> an optimized<br />
mycobacterial interspersed repetitive-unit-variable-number<br />
tandem-repeat typing system combined with spoligotyping for<br />
population-based molecular epidemiology studies <strong>of</strong> tuberculosis.<br />
J. Clin. Microbiol. 45: 691–697.<br />
Sajduda A., A. Brzostek, M. Popławska, N. Rastogi, C. Sola,<br />
E. Augustynowicz-Kopeć, Z. Zwolska, J. Dziadek and F. Portaels.<br />
2004. Molecular epidemiology <strong>of</strong> drug-resistant Mycobacterium<br />
tuberculosis strains isolated from patients with pulmonary tuberculosis<br />
in Poland: a 1-year study. Int. J. Tuberc. Lung Dis. 8: 1448–1457.<br />
Sajduda A., J. Dziadek, R. Kotłowski and F. Portaels. 2006. Evaluation<br />
<strong>of</strong> multiple genetic markers for typing drug-resistant Mycobacterium<br />
tuberculosis strains from Poland. Diagn. Microbiol. Infect.<br />
Dis. 55: 59–64.<br />
Sola C., I. Filliol, E. Legrand, S. Lesjean, C. Locht, P. Supply and<br />
N. Rastogi. 2003. Genotyping <strong>of</strong> the Mycobacterium tuberculosis<br />
complex using MIRUs: association with VNTR and spoligotyping<br />
for molecular epidemiology and evolutionary genetics. Infect. Genet.<br />
Evol. 3: 125–133.<br />
Sola C., L. Horgen, J. Maisetti, A. Devallois, K.S. Goh and<br />
N. Rastogi. 1998. Spoligotyping followed by double-repetitive-element<br />
PCR as rapid alternative to IS6110 fingerprinting for epidemiological<br />
studies <strong>of</strong> tuberculosis. J. Clin. Microbiol. 36: 1122–1124.<br />
Supply P., E. Mazars, S. Lesjean, V. Vincent, B. Gicquel and<br />
C. Locht. 2000. Variable human minisatellite-like regions in the<br />
Mycobacterium tuberculosis genome. Mol. Microbiol. 36: 762–771.<br />
Supply P., S. Lesjean, E. Savine, K. Kremer, D. van Soolingen<br />
and C. Locht. 2001. Automated high-throughput genotyping for<br />
study <strong>of</strong> global epidemiology <strong>of</strong> Mycobacterium tuberculosis based<br />
on mycobacterial interspersed repetitive units. J. Clin. Microbiol.<br />
39: 3563–3571.<br />
Thierry D., A. Brisson-<strong>No</strong>ël, V. Vincent-Lévy-Frébault, S. Nguyen,<br />
J.L. Guesdon and B. Gicquel. 1990. Characterization <strong>of</strong> a Mycobacterium<br />
tuberculosis insertion sequence, IS6110, and its application<br />
in diagnosis. J. Clin. Microbiol. 28: 2668–2673.<br />
van Embden J.D.A., M.D. Cave, J.T. Crawford, J.W. Dale,<br />
K.D. Eisenach, B. Gicquel, P. Hermans, C. Martin, R. McAdam,<br />
T.M. Schinnick and P.M. Small. 1993. Strain identification <strong>of</strong> Mycobacterium<br />
tuberculosis by DNA fingerprinting: recommendations for<br />
a standardized methodology. J. Clin. Microbiol. 31: 406–409.<br />
Vitol I., J. Driscoll, B. Kreiswirth, N. Kurepina and K.P. Bennett.<br />
2006. Identifying Mycobacterium tuberculosis complex strain families<br />
using spoligotypes. Infect. Genet. Evol. 6: 491–504.<br />
World Health Organization (WHO) & International Union<br />
against Tuberculosis and Lung Disease (IUATLD). The WHO/<br />
IUATLD Global Project on Anti-Tuberculosis Drug Resistance Surveillance<br />
2002–2007: anti-tuberculosis drug resistance in the world:<br />
4 th global report. WHO, Geneva, Switzerland, 2008. WHO/HTM/<br />
TB/2008.394.<br />
World Health Organization (WHO). 2006. Global tuberculosis con -<br />
trol: surveillance, planning, financing. WHO, Geneva, Switzerland.<br />
Zwolska Z., E. Augustynowicz-Kopeć and M. Klatt. 2000. Primary<br />
and acquired drug resistance in <strong>Polish</strong> tuberculosis patients: results<br />
<strong>of</strong> a study <strong>of</strong> the national drug resistance surveillance programme.<br />
Int. J. Tuberc. Lung Dis. 4: 832–838.
<strong>Polish</strong> <strong>Journal</strong> <strong>of</strong> <strong>Microbiology</strong><br />
2011, Vol. 60, <strong>No</strong> 3, 243–251<br />
ORIGINAL PAPER<br />
A Comparative Study on the Activity and Antigenicity <strong>of</strong> Truncated<br />
and Full-Length forms <strong>of</strong> Streptokinase<br />
REZA ARABI1 , FARZIN ROOHVAND1, 2 *, DARYOUSH NOROUZIAN3 , SOROUSH SARDARI4 ,<br />
MOHAMMAD REZA AGHASADEGHI1 , HOSEIN KHANAHMAD5 , ARASH MEMARNEJADIAN1 1, 2<br />
and FATEMEH MOTEVALLI<br />
1 Hepatitis and AIDS Dept., 2 NRGB, 3 Bacterial vaccine Dept., 4 Biotechnology Dept.<br />
5 BCG vaccine Dept., Pasteur Institute <strong>of</strong> Iran<br />
Received 15 February 2011, revised 30 April 2011, accepted 30 May 2011<br />
Introduction<br />
Several thrombolytic drugs (plasminogen activators;<br />
PAs) with different pharmacokinetic and pharmacodynamic<br />
properties have been developed for treating diseases<br />
such as stroke, pulmonary embolism, deep vein<br />
thrombosis and acute myocardial infarction , among<br />
which streptokinase (SK) and tissue plasminogen(Plg)<br />
activator (tPA) are the most commonly used agents<br />
(Banerjee et al., 2004; Baruah et al., 2004). Although no<br />
predominant thrombolytic drug has been introduced<br />
to be used for every indication so far (Banerjee et al.,<br />
2004), however, several clinical trials comparing the<br />
efficacy <strong>of</strong> SK and tPA generally suggested that streptokinase<br />
is the drug <strong>of</strong> choice for thrombolytic therapy<br />
especially in resource limited countries (Banerjee et al.,<br />
2004; Baruah et al., 2004).<br />
Streptokinase is produced by different strains <strong>of</strong><br />
β-hemolytic streptococci and due to its non human<br />
origin, is immunogenic and can evoke the immune<br />
Abstract<br />
Application <strong>of</strong> streptokinase (SK) as a common and cost-effective thrombolytic drug is limited by its antigenicity and undesired hemorrhagic<br />
effects. Prior structural/functional and epitope-mapping studies on SK suggested that removal <strong>of</strong> 59 N-terminal residues led to its<br />
fibrin dependency and identified SK antigenic regions, respectively. Following in silico analyses two truncated SK proteins were designed<br />
and compared for their fibrin specificity and antigenicity with the full-length SK. Computer-based modeling was used to predict the<br />
effect <strong>of</strong> vector (pET41a)-born protein tags on the conformation <strong>of</strong> SK fragments. SK60-386, SK143-386 and full-length SK (1–414) were<br />
separately cloned, expressed in BL21 E. coli cells and confirmed by Western-blotting. Functional activity <strong>of</strong> the purified proteins was evaluated<br />
with chromogenic and clot lysis assays and their antigenicity was tested by ELISA assay using rabbit anti-streptokinase antibody. As<br />
expected, chromogenic bioassay showed a major activity decline for SK60-386 and SK143-386 (83 and 91 percent, respectively), compared to<br />
SK1-414. However, in clot lysis assay, which is a fibrin-dependent pharmacopoeia-approved test, SK60-386 and SK143-386 were respectively<br />
35 and 31 percent more active though lysed the clots slower than full-length SK. Antigenic analysis also indicated significant decrease<br />
in ELISA signals obtained for truncated proteins compared to SK1-414 (45 and 28 percent less reactivity for SK143-386 and SK60-386,<br />
respectively, p < 0.0001). The results <strong>of</strong> this study for the first time pointed to SK143-386 and SK60-386, as improved SK derivatives with<br />
increased fibrin-selectivity and decreased antigenicity as well as acceptable bioactivity pr<strong>of</strong>iles in a pharmacopoeia-based analysis, which<br />
deserve more detailed pharmacological studies.<br />
K e y w o r d s: antigenicity, fibrin specificity, protein modeling, truncated streptokinase<br />
system; hence, frequent administrations <strong>of</strong> SK can<br />
result in production <strong>of</strong> neutralizing antibodies, which<br />
in turn reduces the efficacy <strong>of</strong> therapy, and eventually<br />
may lead to extensive allergic reactions (Banerjee et al.,<br />
2004; Baruah et al., 2004; Parhami-Seren et al., 1997;<br />
Parhami-Seren et al., 1995; Reed et al., 1993; Torrèns<br />
et al., 1999). Besides, SK function is not fibrin-specific;<br />
therefore its infusion to patients’ blood may result in<br />
rapid activation <strong>of</strong> plasminogen and subsequent ectopic<br />
emergence <strong>of</strong> plasmin in circulatory system. This<br />
unspecific action <strong>of</strong> SK has undesirable consequences<br />
such as general depletion <strong>of</strong> plasminogen (Plg) concentration<br />
in circulatory system, rapid production <strong>of</strong><br />
bradykinin resulting in hypotension (Reed et al., 1999)<br />
and elevating the risk <strong>of</strong> hemorrhage (Banerjee et al.,<br />
2004; Baruah et al., 2004; Mundada et al., 2003; Reed<br />
et al., 1999; Sazonova et al., 2004). Therefore, there is<br />
high interest in providing modified or truncated SK<br />
molecules with improved fibrin-dependency and less<br />
immunogenicity.<br />
* Corresponding Author: F. Roohvand, Hepatitis and AIDS Dept. and NRGB, Pasteur Institute <strong>of</strong> Iran, Pasteur Ave., Tehran 1316943551,<br />
Iran; phone/fax: +98.21.66969291; e-mail: rfarzin@pasteur.ac.ir
244<br />
Streptokinase with a molecular mass <strong>of</strong> 47 kDa, is<br />
a 414 amino acid single strand peptide which lacks<br />
cystine, cystein, phosphorous, conjugated carbohydrates<br />
and lipids (Banerjee et al., 2004). SK forms an<br />
equimolar complex with plasminogen or plasmin and<br />
this complex converts plasminogen substrates to plasmin<br />
by hydrolyzing the amide bound between Arg 561<br />
and Val 562 . Eventually the resulted plasmin can degrade<br />
and solubilize the fibrin clots (Wang et al., 1998). Crystallography<br />
analysis <strong>of</strong> streptokinase structure (Wang<br />
et al., 1998) has shown that it is composed <strong>of</strong> 3 domains<br />
known as α, β and γ (residues 12–150, 151–287 and<br />
287–372 respectively) domains (Reed et al., 1999). All<br />
three domains <strong>of</strong> the protein are involved directly or<br />
indirectly in the SK interaction with Plg (Conjero-Lara<br />
et al., 1998). γ domain which has a close contact with<br />
Plg active site (Wang et al., 1998) plays a central role in<br />
amidolytic activity <strong>of</strong> the activator complex (Conjero-<br />
Lara et al., 1998) while β domain is known as the region<br />
responsible for high affinity interaction between SK and<br />
Plg. Although the exact role <strong>of</strong> α domain is not clearly<br />
defined, but the first 59 residues <strong>of</strong> this domain are<br />
important for streptokinase accurate conformation and<br />
full activity (Shi et al., 1994). In fact, deletion <strong>of</strong> these<br />
first 59 amino acids <strong>of</strong> the N-terminal segment (SKΔ59<br />
or SK60-414) resulted in major reduction <strong>of</strong> SK activity<br />
in the absence <strong>of</strong> fibrin, but interestingly in the presence<br />
<strong>of</strong> fibrin the activity was shown to be restored albeit in<br />
a longer period <strong>of</strong> time. In other words, SKΔ59 showed<br />
a fibrin-dependent full-activity characteristic when<br />
SK-Plg reaction were awaited for longer times (Mundada<br />
et al., 2003; Sazonova et al., 2004). Further studies<br />
indicated that presence <strong>of</strong> plasmin is an essential element<br />
for efficient activation <strong>of</strong> SKΔ59 (Mundada et al.,<br />
2003; Sazonova et al., 2004). In fact, addition <strong>of</strong> trace<br />
amounts <strong>of</strong> plasmin markedly increased plasminogen<br />
activity <strong>of</strong> SKΔ59 and declined the previously reported<br />
lag time <strong>of</strong> the reaction. Moreover, in contrast to the<br />
wild type SK which protected plasmin from inhibition<br />
by α 2 -antiplasmin, SKΔ59 is more prone to such haemostatic<br />
regulations to prevent the risk <strong>of</strong> hemorrhage.<br />
Therefore, since in the real physiological condition, only<br />
plasminogen substrates on the surface <strong>of</strong> fibrin can be<br />
fully activated by SK60-414*plasmin complex (Mundada<br />
et al., 2003; Reed et al., 1999; Sazonova et al., 2004) and<br />
just fibrin-bound plasmin is protected from inhibitory<br />
action <strong>of</strong> α 2 -antiplasmin (Mundada et al., 2003), thus<br />
this truncated form <strong>of</strong> streptokinase was considered as<br />
a fibrin targeted plasminogen activator and a potentially<br />
improved SK for thrombolytic therapy (Mundada et al.,<br />
2003; Sazoana et al., 2009; Sazonova et al., 2004). However,<br />
to our knowledge there is no prior study addressing<br />
a standard pharmacopoeia comparative analysis based<br />
on clot lyses assay between full length SK and SKΔ59<br />
in allowed reaction period <strong>of</strong> times to approve the efficiency<br />
<strong>of</strong> this truncated SK as a thrombolytic drug.<br />
Arabi R. et al. 3<br />
It is also well shown that during in vivo and in vitro<br />
Plg activation, SK is cleaved into three fragments spanning<br />
amino acid residues <strong>of</strong> 1–59, 60–386 and 387–414<br />
(Reed et al., 1999). While the N-terminal fragment<br />
remains tightly attached to the main segment, the<br />
C-terminal part, i.e. amino acids 387–414 is released<br />
during Plg activation, implying that this part may not be<br />
important for SK activity (Reed et al., 1999). Although<br />
the SK60-386 may be even a potentially more improved<br />
fibrin-dependent PA drug because <strong>of</strong> losing some immu-<br />
nogenic segments <strong>of</strong> SK located in its C-terminal (compared<br />
to SK60-414) but no prior study has addressed<br />
evaluation <strong>of</strong> its activity by fibrin based methods either.<br />
It was previously demonstrated that 143–386 fragment<br />
<strong>of</strong> streptokinase has only 60 percent <strong>of</strong> maximal<br />
activity over even a longer period <strong>of</strong> time compared to<br />
both full-length streptokinase and SK60-414 (Rodriguez<br />
et al., 1995). This fragment lacks the so-called nonessential<br />
C terminal part similar to SK60-386 and moreover<br />
has an extra 83 residue deletion in the N terminal<br />
region. Although SK143-386 has a dramatic reduction <strong>of</strong><br />
activity in the absence <strong>of</strong> fibrin, but fibrin degradation<br />
potential <strong>of</strong> this fragment (which lacks more immunodominant<br />
regions <strong>of</strong> SK) or changes <strong>of</strong> its activity in<br />
the presence <strong>of</strong> fibrin was not previously studied either.<br />
Different regions <strong>of</strong> streptokinase have been identified<br />
as antigenic epitopes by using murine and human<br />
monoclonal antibodies as well as sera <strong>of</strong> patients treated<br />
with SK. Many <strong>of</strong> these regions, including residues 4 to<br />
8 and 96–99 (C<strong>of</strong>fey et al., 2001), 120–140 (Parhami-<br />
Serena et al., 2003), 353–414 (Reed et al., 1993) and<br />
373–414 (Torrèns et al., 1999), are located in regions<br />
which are marked out for SK truncations in our study<br />
( that is 1–59, 1–142 and 387–414) with the expectation<br />
that removal <strong>of</strong> these parts may result in the reduction<br />
<strong>of</strong> antigenicity in truncated SK molecules.<br />
In the present study, with the final aim <strong>of</strong> improving<br />
the potential therapeutic efficacy <strong>of</strong> streptokinase<br />
by development <strong>of</strong> more fibrin-specific SKs with less<br />
antigenicity, we sought to produce two recombinant<br />
truncated streptokinase derivatives spanning the residues<br />
<strong>of</strong> either 143–386 or 60–386 and analyzed their<br />
clot lyses activity by a standard pharmacopoeia fibrinbased<br />
method with that <strong>of</strong> full length SK. We also provide<br />
comparative data for improved and less antigenic<br />
pr<strong>of</strong>iles <strong>of</strong> these truncated molecules.<br />
Experimental<br />
Materials and Methods<br />
Computer-based modeling. To evaluate the impact<br />
<strong>of</strong> the protein tags derived from pET41a (used for<br />
expression <strong>of</strong> SKs and its derivatives in this study) on<br />
the conformation <strong>of</strong> full length and truncated forms <strong>of</strong>
3 Truncated forms <strong>of</strong> streptokinase<br />
245<br />
Fig. 1. Schematic illustration for insertion site <strong>of</strong> 3 different forms <strong>of</strong> skc in pET41a vector.<br />
Truncated (143–386 and 60–386) and full-length(1–414) forms <strong>of</strong> skc were inserted into BamH1 and Pst1 sites <strong>of</strong> MCS <strong>of</strong> pET41a; ATG and Kan stands<br />
for start translation codon and kanamycin resistance respectively; MCS stands for for multiple cloning sites; GST-tag, S-tag and His-tag are the tags<br />
derived from the vector.<br />
SKs , three-dimensional structure <strong>of</strong> the SK proteins<br />
fused to the vector derived-tags were modeled using<br />
MODELLER program (version 9v5, 2008) which is<br />
a non-graphical, command-line based s<strong>of</strong>tware. To this<br />
end, 1bmlC.pdb and 1m9A.pdb atom files (as templates<br />
for streptokinase and GST proteins respectively) were<br />
downloaded from Protein Data Bank (http://www.rcsb.<br />
org) and multiple template script files <strong>of</strong> MODELLER<br />
program were used for modeling. Visualization <strong>of</strong> the<br />
models was performed by Deep View Spdb-viewer (version<br />
4.0.1, 2009) and WebLab viewer Lite (version 4,<br />
2000) s<strong>of</strong>twares. The resulted models were evaluated<br />
based on three methods: 1. Energy level comparison: in<br />
which energy calculation <strong>of</strong> residues <strong>of</strong> model and template<br />
was performed by applying DOPE potential command<br />
line <strong>of</strong> MODELLER program and energy level<br />
<strong>of</strong> the residues were compared in a graphing program.<br />
2. Root Mean Square Deviation (RMSD) calculation:<br />
in which the 3D structures <strong>of</strong> templates and models<br />
were superimposed in Deep View spdb-viewer program<br />
(version 4.0.1, 2009) and the quality <strong>of</strong> the fits were<br />
evaluated by calculating Root Mean Square Deviation<br />
(RMSD) between carbon α <strong>of</strong> the residues. 3. Ramachandran<br />
plot assessment: which was used to visualize<br />
dihedral angles ψ against φ <strong>of</strong> amino acid residues in<br />
protein structure by using RAMPAGE server (Lovell<br />
et al., 2002).<br />
Bacterial strains and culture media. Plasmid<br />
propagation and preparation was performed in E. coli<br />
DH5α (<strong>No</strong>vagen, USA) and E. coli BL21 (DE3) (<strong>No</strong>vagen,<br />
USA) was used for protein expression <strong>of</strong> cloned<br />
genes by IPTG induction. Bacteria were cultivated in<br />
LB (Luria-Bertani) broth or TY2X for plasmid extraction<br />
and expression induction, respectively. All strains<br />
were stored in 20% (v/v) glycerol and stab culture <strong>of</strong><br />
LB Agar.<br />
Gene amplification, cloning and expression.<br />
Streptokinase gene (skc), from a standard streptococcus<br />
strain (S. equisimilis, ATCC 9542) which is also known<br />
as skc2 (Estrada et al., 1992), was PCR amplified by<br />
Pfu DNA polymerase. Various BamHI-tailed forward<br />
and PstI-tailed reverse primers (Table I) were used to<br />
amplify the nucleotide sequences corresponding to<br />
full length (SK1-414) and truncated SKs (SK60-386,<br />
SK143-386). In this regard Pf1 and Pf414 were used as<br />
primers for amplification <strong>of</strong> skc1-414 and pairs <strong>of</strong> Pf60,<br />
Pf386 and Pf143, Pf386 were applied for amplification<br />
<strong>of</strong> skc60-386 and skc143–386, respectively. Thermal<br />
program was set as 30 cycles <strong>of</strong> 95°C for 60 sec, 58°C<br />
for 45 sec and 72°C for 90 sec, which was followed by<br />
a final extension at 72°C for 5 min.<br />
The amplicons, after digestion with BamHI/PstI<br />
restriction enzymes, were separately cloned into the<br />
same sites <strong>of</strong> pET41a vector (<strong>No</strong>vagen, USA) downstream<br />
and in frame <strong>of</strong> the vector-derived tags (GST,<br />
S and His-tag), under the control <strong>of</strong> a T7 promoter<br />
(Fig. 1) to construct three recombinant plasmids <strong>of</strong><br />
pETSK1, pETSK60 and pETSK143. The constructs<br />
which respectively encoded SK1-414, SK60-386 and<br />
SK143-386 were confirmed by sequencing (SeqLab,<br />
Germany) and subsequently were transformed into<br />
the E. coli BL21 cells. Single colony transformants were<br />
Table I<br />
Nucleotide sequence <strong>of</strong> primers designed for amplification <strong>of</strong> truncated<br />
and full-length streptokinase molecules.<br />
Pf60 (forward) 5’-CGAGGATCCAGTCCAAAATCAAAACC-3’<br />
Pf143 (forward) 5’-ATAGGATCCCATGTGCGCGTTAGAC-3’<br />
Pr386 (reverse) 5’-CCGCTGCAGTTACTAGGCTAAATGATAGCTAG-3’<br />
Pf1 (forward) 5’-GAAGGATCCATTGCTGGACCTGAGTG-3’<br />
Pr414 (reverse) 5’-ATCTGCAGTTATTTGTCGTTAGGGTTATCAGG-3’<br />
Underlined sequences denote the restriction sites.
246<br />
inoculated in TY2X medium (OD 600 = 0.6) to express<br />
the recombinant protein for 3–5 hrs following induction<br />
by 0.1 mM IPTG (Isopropyl-thiogalactoside).<br />
Protein analysis and purification. Pellets <strong>of</strong> induced<br />
bacteria (5 ml) were lysed in 50 μl <strong>of</strong> lysis buffer (100 mM<br />
NaH 2 Po 4 , 10 mM Tris.Cl and 8 M Urea), resuspended<br />
in 50 μl Laemmli buffer (0.09 M Tris-HCl, 20% (v/v)<br />
Glycerol, 2% (v/v) SDS, 0.02% (v/v) bromophenol<br />
blue and 2% (v/v) β-ME) and heated at 80°C for 5 min.<br />
The supernatants were electrophoresed in 12% SDS-<br />
PAGE gel and separated proteins were either stained<br />
by coommasie Brilliant Blue or transferred to nitrocellulose<br />
membrane. After blocking the membrane in 3%<br />
(w/v) bovine serum albumin (BSA) and application <strong>of</strong><br />
proper dilution <strong>of</strong> mouse anti-His antibody (Qiagen,<br />
Germany) and washing steps, HRP-conjugated goat<br />
anti-mouse IgG (Sigma, USA) was utilized as tracking<br />
antibody. The bands related to the recombinant SK<br />
proteins were finally visualized by application <strong>of</strong> DAB<br />
(3.3’ Diaminobenzidine) substrate.<br />
Recombinant proteins harboring the N-terminally<br />
tagged 6xHis amino acids were purified in denaturing<br />
condition by the application <strong>of</strong> Nickel-TitriloTriacetic<br />
Acid (Ni-NTA) agarose columns (Qiagen, Germany),<br />
according to manufacturer protocol. Briefly, the pellets<br />
<strong>of</strong> 200 ml <strong>of</strong> induced bacterial culture were lysed in<br />
5 ml <strong>of</strong> lysis buffer (100 mM NaH2Po4, 10 mM Tris.Cl<br />
and 8 M Urea) for 15 minutes. After centrifugation for<br />
20 minutes at 10000 rpm, the upper lysate was mixed<br />
with 2 ml <strong>of</strong> Ni-NTA resin for 30 minutes in a Falcon<br />
tube. The mixture was subsequently loaded into appropriate<br />
column (Qiagen, Germany), washed with 4 ml<br />
<strong>of</strong> washing buffer (containing the same lysis buffer,<br />
pH 6.3) twice and finally the SK proteins were eluted by<br />
elution buffer (containing the same lysis buffer, pH 4.5)<br />
in four fractions (0.5 ml each one). Purity and concentration<br />
<strong>of</strong> protein fractions were analyzed by SDS-PAGE<br />
and Bradford methods, respectively.<br />
Bioassay <strong>of</strong> recombinant SK proteins. Streptokinase<br />
activity was determined by three methods:<br />
Caseinolysis – In this semiquantitative standard<br />
method (Saksella, 1981) a plate containing 5% (w/v)<br />
skim-milk, 1% (w/v) agarose, 10 mM NaCl and 50 mM<br />
Tris base was prepared and different dilutions <strong>of</strong> standard<br />
SK (B. Braun, Germany) and the same amounts <strong>of</strong><br />
eluted proteins were applied in the 5-mm wells previously<br />
prepared in the plate. All the standard and test<br />
wells were filled with 1 mg ml –1 concentration <strong>of</strong> plasminogen<br />
solution (Fluka, Sweden) to have the plasminogen<br />
in an excess molarity. Two other wells containing<br />
standard SK alone or plasminogen alone were also<br />
prepared as negative controls. After 24 h incubation at<br />
room temperature the caseinolysis diameter surrounding<br />
the wells, reflecting the functional activity <strong>of</strong> SK,<br />
was measured.<br />
Arabi R. et al. 3<br />
Chromogenic assay – This method that monitors<br />
the amount <strong>of</strong> formed plasmin by an endpoint assay<br />
<strong>of</strong> a synthetic substrate (British Pharmacopoeia, 1998)<br />
(Couto et al., 2004) was conducted with slight modifications.<br />
In brief, recombinant SK molecules (0.4 nM)<br />
and Plg (1 nM) were mixed together in 96-well plates<br />
and incubated at 37°C for 10 min to construct activator<br />
complexes. 0.75 mM S2251 (H-D-valyl-L-leucyl-Llysine-ρ-nitroanalide)<br />
was added to the enzymatic complex<br />
as substrate and the mixture was incubated at 37°C<br />
for 20 min. The reaction was stopped with 20% (v/v)<br />
acetic acid and absorbance was read in 405 nm. Biological<br />
activity (IU ml –1 ) and specific activity (IU mg –1 and<br />
IU nM –1 ) <strong>of</strong> the samples were calculated according to<br />
OD 405 <strong>of</strong> reference streptokinase with known biological<br />
activity (B. Braun, Germany).<br />
Clot lysis assay – This method measures the SK<br />
activity in the presence <strong>of</strong> fibrin (British Pharmacopoeia,<br />
1998). Briefly, 0.2 ml <strong>of</strong> SK (0.8 nM) (either reference<br />
or purified recombinant proteins) was mixed<br />
with 0.2 ml <strong>of</strong> citric-phosphate buffer, 0.1 ml <strong>of</strong> thrombin<br />
(20 IU ml –1 ) and 0.5 ml <strong>of</strong> euglobulin (10 mg ml –1 ),<br />
which was purified according to the method used by<br />
Couto et al. (Couto et al., 2004), in a test tube. After<br />
the formation <strong>of</strong> clots, the required times for complete<br />
dissolution <strong>of</strong> clots was noted. Biological activity <strong>of</strong> the<br />
unknown purified samples was determined based on<br />
the plotted standard curve showing the clot lysis time<br />
against the IU ml –1 <strong>of</strong> different concentrations <strong>of</strong> reference<br />
SK. Biological activity (IU ml –1 ) and specific activity<br />
(IU mg –1 and IU nM –1 ) <strong>of</strong> samples were calculated<br />
according to reference streptokinase plot with known<br />
biological activity (B. Braun, Germany).<br />
Antibody preparation and Enzyme-Linked Immunosorbent<br />
Assay (ELISA). ELISA was used to evaluate<br />
antigenic discrepancy between full-length and truncated<br />
SK using polyclonal anti-SK antibodies generated<br />
in rabbits. Full length purified SK (SK1-414) emulsified<br />
in Complete Fraunds’ Adjuvant (CFA, Sigma) was<br />
intramuscularly injected to six female New Zealand<br />
rabbits (0.25 mg/rabbit). Booster administration was<br />
performed with the same amount <strong>of</strong> SK mixed with<br />
Incomplete Fraunds’ Adjuvant (IFA, Sigma) 4 wks<br />
later. The anti-sera were prepared at 4 wk post-booster<br />
injection and used in an indirect ELISA to detect the<br />
truncated SK molecules. ELISA plate was coated with<br />
0.4 nM <strong>of</strong> the 3 proteins (SK143-386, SK60-386 and<br />
SK1-414). After blocking with 3% (w/v) BSA, serial<br />
dilutions <strong>of</strong> anti-sera from individual injected rabbits<br />
(1/800, 1/1600, 1/3200, 1/6400, 1/12800) were added<br />
to streptokinase coated wells. Following the washing<br />
steps, horse-radish peroxidase (HRP)-conjugated antirabbit<br />
antibody was applied to the wells. Finally and<br />
after further washes, addition <strong>of</strong> the chromogenic substrate;<br />
TMB (Tetramethyl-benzidine) led to the color
3 Truncated forms <strong>of</strong> streptokinase<br />
247<br />
Fig. 2. Analysis <strong>of</strong> the expressed SK proteins.<br />
(A) SDS-PAGE and (B) western blot analysis <strong>of</strong> crude lysis <strong>of</strong> E. coli BL21 cells expressing truncated and intact forms <strong>of</strong> streptokinase; lane M: molecular<br />
weight marker, lane 1–3: SK143-386, SK60-386 and SK1-414 respectively; (C) SDS-PAGE analysis <strong>of</strong> purified proteins; lane M: molecular weight marker,<br />
lane 1–3: SK143-386, SK60-386 and SK1-414 respectively.<br />
appearance that was stopped by 10% (w/v) acetic acid.<br />
While the background absorbance resulting from the<br />
pre-immune sera was subtracted from the tests, the<br />
means <strong>of</strong> OD 450 for different groups were statistically<br />
compared using student t-tets.<br />
Results<br />
Modeling <strong>of</strong> truncated and full-length proteins.<br />
Expression <strong>of</strong> N-terminally truncated proteins is shown<br />
to be usually less efficient (Nihalani et al., 1998; Reed<br />
et al., 1999). We hypothesized that expression <strong>of</strong> N-terminally<br />
truncated SK proteins fused with N-terminal<br />
tags (derived from vectors such as pET41a) that are<br />
efficiently expressed may be facilitated. Although Reed<br />
et al. (Reed et al., 1999) previously reported that maltose<br />
binding protein (MBP) fused to streptokinase did<br />
not affect its activity, however for us an existing concern<br />
with this strategy was the risk <strong>of</strong> unwanted changes in<br />
the configuration <strong>of</strong> these proteins. To gain insights<br />
into this possibility we took advantage <strong>of</strong> computerbased<br />
modeling using the MODELLER s<strong>of</strong>tware.<br />
To avoid complexity in modeling, the small 6His-tag<br />
(6 residues) and S-tag (15 residues) were ignored but<br />
GST tag, a protein with 220 amino acids was included<br />
in the modeling procedure. Several models were created<br />
by using ‘multiple- template’ scripts <strong>of</strong> MODELLER<br />
s<strong>of</strong>tware and subsequently models with the lowest<br />
energy were selected for assessments (data not shown).<br />
DOPE scores <strong>of</strong> models resulted from model evaluation<br />
scripts <strong>of</strong> MODELLER s<strong>of</strong>tware were compared<br />
with DOPE scores <strong>of</strong> templates by depicting the data as<br />
plots (Fig. 3). There are gaps in the DOPE plots due to<br />
deletion <strong>of</strong> some residues in 1bmlC (template <strong>of</strong> SK),<br />
which is obtained from Protein Data Bank, however<br />
analogous points related to these gaps in the models<br />
show good level <strong>of</strong> energy (less than – 1E –2 ). Fortunately<br />
residues related to γ domain, which is in close<br />
contact with catalytic site <strong>of</strong> plasminogen in the complex<br />
(Wang et al., 1998), in all 3 models <strong>of</strong> streptokinase<br />
had very near level <strong>of</strong> energy to their template (Fig. 3).<br />
Assessment <strong>of</strong> selected models by Ramachandran plot<br />
showed that residues <strong>of</strong> outlier region for full-length SK<br />
(SK1-414), SK60-386 and SK143-386 were 4.9%, 2.9%<br />
and 3.5% respectively. These scores compared to the<br />
scores <strong>of</strong> their templates (6.1% for 1bmlC and 1% for<br />
1m9A) seemed very reasonable.<br />
RMSD <strong>of</strong> selected models for the 3 proteins after<br />
superimposing to 1bmlC as template for streptokinase<br />
and from 1m9aA as template GST-tag, were calculated<br />
separately. These results indicated that SK143-386<br />
model has the least RMSD in comparison to the other<br />
models which means it was the best model (RMSD less<br />
than 2 Å is considered as excellent, between 2 and 6 Å as<br />
reasonable and more than 6 Å as improper). Altogether<br />
the results <strong>of</strong> all three kinds <strong>of</strong> evaluations showed that<br />
the fusion tags may not have considerable impact on<br />
the conformation <strong>of</strong> our proteins.<br />
Cloning, expression and purification <strong>of</strong> recombinant<br />
full length and truncated streptokinase proteins.<br />
Two truncated SK genes encoding 143–386 and 60–386<br />
amino acid residues (skc143-386 and skc60-386, respectively)<br />
in addition to the full-length SK gene (skc1-414)<br />
were PCR-amplified from the previously isolated skc2<br />
template (Estrada et al., 1992). The amplicons were<br />
cloned into the BamH1/Pst1 sites <strong>of</strong> pET41a plasmid,<br />
in the same open reading frame (ORF) <strong>of</strong> vector-born<br />
N-terminal fusion-tag (Fig. 1). Transformation and<br />
subsequent expression by IPTG induction <strong>of</strong> plasmids<br />
in E. coli BL21 (DE3) resulted in the appearance <strong>of</strong><br />
protein bands with expected molecular weights for<br />
vector derived tags fused to the proteins (57, 66 and<br />
78 kDa for SK143-386, SK60-386 and SK1-414, respectively)<br />
in SDS-PAGE (Fig. 2A) and Western-blot analyses<br />
(Fig. 2B).<br />
Induction <strong>of</strong> protein expressions in large scale cultures<br />
(200 ml) and purification <strong>of</strong> His-tagged SK proteins<br />
using Ni-NTA affinity chromatography finally<br />
provided us with approximately 150 mg <strong>of</strong> full length<br />
and truncated proteins with a purity <strong>of</strong> more than<br />
90 percent for each protein that was shown by SDS-<br />
PAGE (Fig. 2C). These proteins were further evaluated<br />
for bioactivity and antigenicity.
248<br />
Comparison <strong>of</strong> biological activity for truncated<br />
and full length purified SK proteins. The caseinolysis<br />
method (Saksella, 1981) was used for preliminary activity<br />
assessment <strong>of</strong> the recombinant SK proteins. Two<br />
other methods used in this study were chromogenic<br />
plasminogen activation assay and a fibrin clot lysis assay<br />
which are recommended assays for biological activity<br />
assessment <strong>of</strong> streptokinase in British Pharmacopoeia<br />
(BP, 1998). Caseinolysis zones, surrounding the wells<br />
<strong>of</strong> samples together with different amounts <strong>of</strong> standard<br />
streptokinase, indicated that full length and truncated<br />
forms <strong>of</strong> SK proteins were biologically active (data not<br />
shown). Following this primary screening, specific<br />
activities <strong>of</strong> proteins were measured in terms <strong>of</strong> International<br />
Unit per milligram and per nanomole. The<br />
quantitative chromogenic assay indicated that, compared<br />
to SK1-414, specific activities <strong>of</strong> SK60-386 and<br />
SK143-386 had respectively reduced by 81 and 88 percent<br />
in terms <strong>of</strong> IU mg –1 83 and 91 percent in terms <strong>of</strong><br />
IU nM –1 (Table II). Similarly, the clot lysis assay (lysis<br />
<strong>of</strong> one milliliter <strong>of</strong> clot by one microgram or nanomole<br />
streptokinase) showed a reduction <strong>of</strong> 68 and 80% <strong>of</strong><br />
IU µg –1 and 72 and 85% <strong>of</strong> IU nM –1 , respectively, compared<br />
to SK1-414 (Table III). This method that mea-<br />
Arabi R. et al. 3<br />
Fig. 3. DOPE score pr<strong>of</strong>iles <strong>of</strong> streptokinase models.<br />
A: SK1-414, B: SK60-386, C: SK143-386; all three models totally show good<br />
(almost residues less than –1.00E –2 ) energy level when compared to their<br />
template, especially in C terminus which has close contact with catalytic<br />
site on plasminogen. The gaps in some parts <strong>of</strong> DOPE plot <strong>of</strong> template are<br />
related to deletion <strong>of</strong> some residues <strong>of</strong> template downloaded from Protein<br />
Data Bank (1bmlC).<br />
sures the activity <strong>of</strong> SK in the presence <strong>of</strong> fibrin may<br />
be considered as a criterion for the fibrin dependency<br />
<strong>of</strong> SK molecule in physiologic condition (Reed et al.,<br />
1999). Of note, all SK proteins (both full length and<br />
truncated SKs) were able to completely lyse the clots<br />
during 20 minutes which was acceptable and allowed<br />
time for a thrombolytic drug with potential therapeutic<br />
Table II<br />
Biologic and specific activity <strong>of</strong> truncated and full-length<br />
streptokinase molecules measured by chromogenic method.<br />
Biological activity (IU ml –1 ) 3758 634 346<br />
Specific activity (IU mg –1 ) 11743 2186 1443<br />
Specific activity (IU nMol –1 SK1-414 SK60-386<br />
SK143-386<br />
) 952 158 88<br />
Table III<br />
Biologic and specific activity <strong>of</strong> truncated and full-length<br />
streptokinase molecules measured by clot lysis method.<br />
Biological activity (IU ml –1 ) 3211 1464 1011<br />
Specific activity (IU mg –1 ) 10703 3405 2106<br />
Specific activity (IU nMol –1 SK1-414 SK60-386 SK143-386<br />
) 868 244 128
3 Truncated forms <strong>of</strong> streptokinase<br />
249<br />
Fig. 4. Antigenicity analysis <strong>of</strong> truncated forms <strong>of</strong> streptokinase in comparison to full length SK.<br />
(A) Reactivity <strong>of</strong> five serial dilutions <strong>of</strong> anti-SK polyclonal antisera on SK143-386, SK60-386 and SK1-414 by indirect ELISA. (B) Comparison <strong>of</strong> ELISA<br />
signals obtained with 1/12800 dilution <strong>of</strong> antisera in pairs <strong>of</strong> SK1-414 & SK143-386, SK1-414 & SK60-386 and SK60-386 & SK143-386. Deletion <strong>of</strong><br />
residues 1–59, 1–142 and 387–414 in streptokinase resulted in significantly less antigenic proteins (p < 0.0001 for all comparisons).<br />
efficacy in the British pharmacopoeia. Comparison <strong>of</strong><br />
the results obtained from clot lysis and chromogenic<br />
assays (in terms <strong>of</strong> IU nM –1 ) also indicated that while<br />
the specific activity <strong>of</strong> full length SK in the presence<br />
<strong>of</strong> fibrin was reduced approximately by 9%, but both<br />
truncated molecules showed an increased activity <strong>of</strong><br />
35% and 31% for SK60-386 and SK143-386 respectively.<br />
Although there was significant difference in the<br />
specific activity between truncated and full-length<br />
streptokinase it was observed that by equal amount<br />
(0.8 nM), SK60-386 and SK143-386 completely lysed<br />
the clot approximately in 12 and 16 minutes, respectively,<br />
whereas SK1-414 solubilized the clot in about<br />
3 minutes; i.e. the truncated molecules had full activity<br />
in longer times but still in the range <strong>of</strong> allowed time for<br />
a thrombolytic drug with potential therapeutic efficacy<br />
in the British pharmacopoeia (20 minutes).<br />
Antigenicity analysis <strong>of</strong> full length and truncated<br />
SK molecules. Immunological characteristics <strong>of</strong><br />
streptokinase can be evaluated by developing anti-SK<br />
antisera in different animals, including rabbits (Houba<br />
and Hana, 1966) and monkeys (Torrèns et al., 1999).<br />
In this study for comparison <strong>of</strong> antigenicity <strong>of</strong> the proteins,<br />
rabbit polyclonal antisera raised against purified<br />
SK1-414, were used to analyze antigenicity <strong>of</strong> truncated<br />
streptokinase proteins. Reactivity <strong>of</strong> five serial dilutions<br />
(1/800, 1/1600, 1/3200, 1/6400 and 1/12800) <strong>of</strong> the antisera<br />
with SK143-386, SK60-386 and SK1-414 which was<br />
measured by indirect ELISA pointed to lower signals<br />
(OD 450 ) in the case <strong>of</strong> truncated molecules (Fig. 4A).<br />
Dilution <strong>of</strong> 1/12800 was selected to statistically compare<br />
the observed differences <strong>of</strong> antigenicity between<br />
the 3 proteins (Fig. 4B). Interestingly, this analysis<br />
showed a significant decrease <strong>of</strong> reactivity for both<br />
truncated molecules in comparison with full length<br />
SK. SK143-386 showed to be 45% less reactive to anti-<br />
SK than SK1-414 (P < 0.0001) and SK60-386 had 28%<br />
lower reactivity in comparison to SK1-414 (P < 0.0001).<br />
Also reactivity <strong>of</strong> SK60-386 to anti-SK was 23% higher<br />
than SK143-386 (P < 0.0001). These data, in accordance<br />
with previous study (Torrèns et al., 1999) on evaluation<br />
<strong>of</strong> C terminally mutated streptokinase, indicated that<br />
removal <strong>of</strong> the selected fragments ( 59 or 142 residues<br />
<strong>of</strong> N terminal and 28 residues <strong>of</strong> C terminal) from full<br />
length SK leads to the production <strong>of</strong> considerably less<br />
immunogenic SK derivatives.<br />
Discussion<br />
Streptokinase is one <strong>of</strong> the most important drugs<br />
for thrombolytic therapy; however, it has shortcomings<br />
such as immunogenicity and fibrin-non specificity<br />
(Banerjee et al., 2004; Baruah et al., 2004; Reed<br />
et al., 1999; Sazonova et al., 2004). In the present study,<br />
based on previous reports on antigenic mapping and<br />
functional characteristics <strong>of</strong> SK regions, two truncated<br />
SK-molecules lacking the 59 N-terminal or the<br />
142 N-terminal amino acids plus 28 C-terminal residues<br />
(SK60-386 and SK143-386 respectively) were considered<br />
for construction and analysis <strong>of</strong> antigenicity/<br />
activity. To the best <strong>of</strong> our knowledge there was no prior<br />
report on evaluation <strong>of</strong> activity <strong>of</strong> SK143-386 and SK60-<br />
386 as potential thrombolytic drugs for their therapeutic<br />
efficacy by a fibrin based and pharmacopoeia<br />
approved method. Further, no prior study addressed<br />
for comparison <strong>of</strong> the antigenicity <strong>of</strong> these truncated<br />
SK proteins with full-length SK.<br />
Bioassay <strong>of</strong> truncated SK proteins by chromogenic<br />
method indicated a dramatic decline <strong>of</strong> activity compared<br />
to the full length SK (up to 84 and 91 percents<br />
for SK60-386 and SK143-386, respectively (Table II).<br />
According previous reports, on structure/function analysis<br />
<strong>of</strong> streptokinase, this lower activity <strong>of</strong> truncated SK
250<br />
proteins in chromogenic assay was expectable (Reed<br />
et al., 1999; Rodriguez et al., 1995). Analysis by fibrin<br />
clot lysis assay also evidenced for significant activity<br />
reduction for truncated SK proteins compared to fulllength<br />
SK (Table III), but comparison <strong>of</strong> activities by<br />
two methods (Chromogenic assay versus fibrin clot<br />
assay) indicated 35% and 31% increase <strong>of</strong> activity for<br />
SK60-386 and SK143-386 respectively and reduction<br />
<strong>of</strong> 9% for full-length SK by clot lysis assay compared<br />
to chromogenic assay (Tables II, III). These observations<br />
are somehow in accordance with prior studies<br />
which demonstrated SK lacking N terminal 59 amino<br />
acids restores the activity in the presence <strong>of</strong> fibrin,<br />
however in the present study the truncated SK proteins<br />
did not restored full activity. Accordingly, while<br />
it was already shown that during a long analyzing time<br />
(6 hours) SK60-414 is more active than full-length SK<br />
in all ranges <strong>of</strong> the tested concentrations (0–50 nM),<br />
(Reed et al., 1999), other studies showed that SK60-414<br />
is superior than full-length SK only in high concentrations<br />
(Mundada et al., 2003). The results <strong>of</strong> our clot<br />
lysis test are consistent with the later report in that our<br />
truncated proteins had less activity than full-length SK<br />
using a lower concentration (0.8 nM).<br />
The lag time in fibrinolysis, which was the major<br />
reason for lower activity in our clot lysis assay, may be<br />
explained by the fact that both truncated molecules<br />
(lacking 59 first residues) were only able to form efficient<br />
activator complexes with plasmin and not with<br />
plasminogen (Mundada et al., 2003; Sazonova et al.,<br />
2004) which were generated in trace amount in the<br />
beginning <strong>of</strong> the interaction. By more plasmin formation,<br />
further plasminogen substrates would be subsequently<br />
activated in a time manner. Delay in fibrin degradation<br />
can be, in fact, a positive feature, since it gives<br />
the opportunity to SK to become active only when it<br />
reaches to the loci occluded by fibrin clots. This feature<br />
can minimize activity <strong>of</strong> the SK protein in the regions<br />
lacking fibrin clots and may potentially reduce the risk<br />
<strong>of</strong> hemorrhage.<br />
The other side <strong>of</strong> our rationale for the truncation<br />
<strong>of</strong> streptokinase was to reduce its antigenicity. Antigenicity<br />
analysis by ELISA which was carried out in<br />
our study was based on methods previously developed<br />
for evaluation <strong>of</strong> the immunological characteristics <strong>of</strong><br />
streptokinase using anti-SK antisera developed in different<br />
animals, including rabbits (Houba and Hana,<br />
1966 and Torrèns et al., 1999). These analyses showed<br />
a less reactivity <strong>of</strong> the SK-specific rabbit polyclonal<br />
antisera against the truncated SK molecules (Fig. 5),<br />
so that a significant decrease in the obtained signals<br />
was observed for truncated molecules in comparison<br />
with the full length protein, which was still significantly<br />
lower for SK143-386 compared to the SK60-386. These<br />
findings were somehow expected and compatible with<br />
Arabi R. et al. 3<br />
other studies (Parhami-Serena et al., 2003; Reed et al.,<br />
1993; Torrèns et al., 1999) which mapped and analyzed<br />
antigenic epitopes <strong>of</strong> streptokinase. Accordingly,<br />
lower reaction <strong>of</strong> anti-SK1-414 antibodies with truncated<br />
molecules confirmed the accumulation <strong>of</strong> antigenic<br />
determinants in the excised regions. Moreover,<br />
in a confirmatory experiment we prepared anti-truncated<br />
SK antibodies by immunizing the rabbits with<br />
SK60-386 and SK143-386 molecules and found that in<br />
comparison with anti-full length SK antibodies, antisera<br />
raised against the shortened molecules generally<br />
had a lower reactivity with their corresponding proteins<br />
(data not shown). Overall, these findings verified the<br />
less antigenicity/immunogenicity <strong>of</strong> the truncated SK<br />
proteins introduced in this study.<br />
Altogether, based on the available structure/function<br />
and antigenic mapping reports <strong>of</strong> SK molecule,<br />
to our knowledge the present study for the first time<br />
attempted to engineer truncated recombinant SK molecules<br />
with a simultaneous more fibrin specificity and<br />
less antigenicity. According to the obtained results,<br />
truncation <strong>of</strong> SK in both N- and C-terminal ends was<br />
successful to create fibrin targeted SKs with comparable<br />
activities and considerably lower antigenic properties.<br />
In a preliminary analysis, both <strong>of</strong> these proteins<br />
(SK143-386 and SK60-386) passed the pharmacopoeia<br />
standard for streptokinase activity assessment by a clot<br />
lysis assay for evaluation <strong>of</strong> a thrombolytic drug with<br />
potential therapeutic efficacy and hence may be considered<br />
for further pharmacological assessments.<br />
Acknowledgments<br />
This study was financially supported by the Education Office <strong>of</strong><br />
Pasteur Institute <strong>of</strong> Iran. The authors would like to thank Mr. Hendi<br />
for his technical assistance in biological activity assays. This paper<br />
is a partial fulfillment <strong>of</strong> a Ph.D. thesis by R.A.<br />
Literature<br />
Banerjee A., C. Chisti and U.C. Banerjee. 2004. Streptoki-<br />
nase – a clinically useful thrombolytic agent. Biotechnol. Adv. 22:<br />
287–307.<br />
Baruah D.B., R.N. Dash, M.R. Chaundhari and S.S. Kadam. 2004.<br />
Plasminogen Activators: A comparison. Vascul. Pharmacol. 44: 1–9.<br />
C<strong>of</strong>fey J.A., K.R. Jennings and H. Dalton. 2001. New antigenic<br />
regions <strong>of</strong> streptokinase are identified by affinity directed mass<br />
spectrometry. Eur. J. Biochem. 268: 5215–5221.<br />
Conjero-Lara F., J. Parrado, A.I. Azuaga, C.M. Dobson and<br />
P.C. Paula. 1998. Analysis <strong>of</strong> the interactions between streptokinase<br />
domains and human plasminogen. Protein Sci. 7: 2190–2199.<br />
Couto L., J.L. Donato and G. Nucci. 2004. Analysis <strong>of</strong> five streptokinase<br />
formulations using the euglobulin lysis test and the plasminogen<br />
activation assay. Brazil J. Med. Biol. Res. 37: 1889–1894.<br />
Estrada M., L. Hernández, A Pérez, P. Rodríguez, R. Serrano,<br />
R. Rubiera, A.Pedraza, G. Padrón, W. Antuch, J. de la Fuente and<br />
L. Herrera. 1992. High level expression <strong>of</strong> streptokinase in Escherichia<br />
coli. Biotechnol. Adv. 10: 1138–1142.
3 Truncated forms <strong>of</strong> streptokinase<br />
251<br />
Houba V. and I. Hana. 1966. The difference in immunological characteristics<br />
<strong>of</strong> two streptokinases. Immunol. 11: 387–397.<br />
Lovell S.C., I.W. Davis, W.B. Arendall, P.I.W. de Bakker,<br />
J.M. Word, M.G. Prisant, J.S. Richardson and D.C. Richardson.<br />
2002. Structure validation by Calpha geometry: phi,psi and Cbeta<br />
deviation. Proteins: Struct. Funct. and Genet. 50: 437–450.<br />
Mundada L.V., M. Prorok, M.E. DeFord, M. Figuera, F.J. Castellino<br />
and W.P. Fay. 2003. Structure-function analysis <strong>of</strong> the<br />
streptokinase amino terminus (residues 1–59). J. Biol. Chem. 278:<br />
24421–24427.<br />
Nihalani D., R. Kumar, K. Rajagopal and G. Shan. 1998. Role <strong>of</strong><br />
the amino-terminal region <strong>of</strong> streptokinase in the generation <strong>of</strong><br />
a fully functional plasminogen activator complex probed with synthetic<br />
peptides. Protein Sci. 7: 637–648.<br />
Parhami-Seren B., K. Keel and G.L. Reed. 1997. Sequences <strong>of</strong><br />
antigenic epitopes <strong>of</strong> streptokinase identified via random peptide<br />
libraries displayed on phage. J. Mol. Biol. 271: 333–341.<br />
Parhami-Serena B., M. Lynch, H.D. Whites and G.L. Reed. 1995.<br />
Mapping the antigenic regions <strong>of</strong> streptokinase in humans before<br />
and after streptokinase therapy. Mol. Immunol. 32: 111–724.<br />
Parhami-Serena B., M. Seaveya, J. Krudysza and P. Tsantili. 2003.<br />
Structural correlates <strong>of</strong> a functional streptokinase antigenic epitope:<br />
serine 138 is an essential residue for antibody binding. J. Immunol.<br />
Methods. 272: 93–105.<br />
Reed G., P. Kussie and B. Parhami-Seren. 1993. A functional analysis<br />
<strong>of</strong> the antigenicity <strong>of</strong> streptokinase using monoclonal antibody<br />
mapping and recombinant streptokinase fragments.The J. Immunol.<br />
150: 4407–4415.<br />
Reed G., B. Parhami-Seren, S. Wang and L. Hedstrom. 1999.<br />
A catalytic switch and the conversion <strong>of</strong> streptokinase to a fibrin<br />
targeted plasminogen activator. PANAS 96: 8879–8883.<br />
Rodriguez P., P. Fuentes, M. Barro, J.G. Alvarez, M. Mwozz,<br />
D.C. Collen and H.R. Lunen. 1995. Structural domains <strong>of</strong> streptokinase<br />
involved in the interaction with plasminogen. Eur. J. Biochem.<br />
229: 83–90.<br />
Saksella O. 1981. Radial caseinolylis in agarose: a simple method<br />
for detection <strong>of</strong> plasminogen activator in the presence <strong>of</strong> inhibitory<br />
substances and serum. Anal. Biochem. 111: 276–282.<br />
Sazoana I.Y., R.A. Mcanmee, A.K. Houng, S.M. King, L. Hedstorm<br />
and G.L. Reed. 2009. Reprogrammed streptokinases develop<br />
fibrin-targeting and dissolve blood clots with more potency than tissue<br />
plasminogen activator. J. Thromb. and Haemostasis 7: 1321–1328.<br />
Sazonova I.Y., B.R. Robinson, I.P. Gladysheva, F.J. Castellino and<br />
G.L. Reed. 2004. Alpha domain deletion converts streptokinase into<br />
a fibrin-dependent plasminogen activator through mechanisms akin<br />
to staphylokinase and tissue plasminogen activator. J. Biol. Chem.<br />
279: 24994–5001.<br />
Shi G., B. Chang, S. Chen, D. Wu and H. Wu. 1994. Function<br />
<strong>of</strong> streptokinase fragments in plasminogen activation. Biochem.<br />
J. 304: 235–241.<br />
Torrèns I., A.G. Ojalvo, A. Seralena, O. Hayes and J. Fuente. 1999.<br />
A mutant streptokinase lacking the C-terminal 42 amino acids is less<br />
immunogenic. Immunol. Lett. 70: 213–218.<br />
Wang X., X. L i n, J.A. Lay, J. Tang and X.C. Zhang. 1998. Crystal<br />
structure <strong>of</strong> the catalytic domain <strong>of</strong> human plasmin complexed with<br />
streptokinase. Science 281: 1662–1665.
<strong>Polish</strong> <strong>Journal</strong> <strong>of</strong> <strong>Microbiology</strong><br />
2011, Vol. 60, <strong>No</strong> 3, 253–258<br />
ORIGINAL PAPER<br />
Infections Caused by RSV Among Children and Adults During<br />
Two Epidemic Seasons<br />
KATARZYNA PANCER *1 , AGNIESZKA CIĄĆKA1 , WŁODZIMIERZ GUT1 , BOŻENA LIPKA2 ,<br />
JUSTYNA MIERZEJEWSKA3 , BOGUMIŁA MILEWSKA-BOBULA2 , ANNA SMORCZEWSKA-KILJAN2 ,<br />
KARINA JAHNZ-RÓŻYK3 , DANUTA DZIERŻANOWSKA2 , KAZIMIERZ MADALIŃSKI1 and BOGUMIŁA LITWIŃSKA1 1 Department <strong>of</strong> Virology, National Institute <strong>of</strong> Public Heath – National Institute <strong>of</strong> Hygiene, Warsaw, Poland<br />
2 The Children’s Memorial Health Institute, Warsaw, Poland<br />
3 Department <strong>of</strong> Immunology and Clinical Allergology, Military Institute <strong>of</strong> Medicine, Warsaw, Poland<br />
Received 2 June 2011, revised 15 July 2011, accepted 16 July 2011<br />
Introduction<br />
Respiratory syncytial virus (RSV) is a member <strong>of</strong> Paramyxoviridae<br />
family, structured with ss-RNA <strong>of</strong> negative<br />
polarity, and lipid bilayer envelope that is derived from<br />
membrane <strong>of</strong> the host cell. On the surface <strong>of</strong> the envelope<br />
there are two glycoproteins: fusion protein (F) and<br />
G protein (G) (Lamb and Parks, 2007).<br />
RSV is the most common etiological agent <strong>of</strong> viral<br />
lower respiratory tract infections among infants and<br />
young children in the world. RSV is the most frequent<br />
cause <strong>of</strong> bronchiolitis and pneumonia in hospitalized<br />
children below 9 months <strong>of</strong> age (Iwane et al.,<br />
2004). It has been counted that over one-third <strong>of</strong> all<br />
infants below 1 year old admitted to the hospital due<br />
to lower respiratory tract infection were infected by<br />
RSV. Overall, 4–5 millions <strong>of</strong> young children (< 4 y.)<br />
per year in USA acquire an RSV infection and among<br />
Abstract<br />
Respiratory Syncytial Virus (RSV) is one <strong>of</strong> the most common causes <strong>of</strong> lower respiratory tract infections in young children, immunocompromised<br />
patients (children and adults), patients with chronic respiratory diseases and elderly people. Reinfections occur throughout the<br />
life, but the severity <strong>of</strong> disease decreased with subsequent infection. The aim <strong>of</strong> this study was to analyze the frequency <strong>of</strong> RSV infections<br />
in two selected subpopulations: young children (below 5 y.) and adults with chronic respiratory diseases (25–87 y.). Nasopharyngeal swabs<br />
(334) collected from October 2008 to March 2010 were examined. The presence <strong>of</strong> RSV genome was determined by RT-PCR and the presence<br />
<strong>of</strong> RSV antigen by quick immunochromatographic test. Positive results <strong>of</strong> RT-PCR were found in 45.2% <strong>of</strong> all swabs: 48.6% samples in<br />
2008; 41.5% in 2009; 50.8% in 2010. The highest frequency <strong>of</strong> RSV-positive samples was in fall-winter months, but differences in RSV epidemic<br />
seasons were found. In the first season (2008–2009) an increased number <strong>of</strong> RSV infections was observed from <strong>No</strong>vember 2008, but<br />
in the second season – from January 2010. Generally, the frequency <strong>of</strong> RSV-positive RT-PCR among children was 53%, among adults 25%.<br />
The highest difference was observed in the first three-month period <strong>of</strong> 2010. RT-PCR positive samples were found in 68.5% <strong>of</strong> children and<br />
5.9% <strong>of</strong> adults. However, the RSV antigen was found in 44.4% <strong>of</strong> samples collected from adults in this period. Our results indicate that the<br />
contribution <strong>of</strong> RSV infections during epidemic season <strong>of</strong> respiratory tract infections in Poland was really high among children and adults.<br />
K e y w o r d s: RSV, epidemic seasons, high risk groups<br />
them ~ 125 000 are hospitalized due to this infection<br />
and ~ 450 die (Iwane et al., 2004; Black, 2003; Krilov,<br />
http://emedicine.medscape.co./article/971488). It might<br />
be estimated that 3–9 per 1000 children below 1 y. were<br />
hospitalized because <strong>of</strong> severe RSV infections. Probably,<br />
every child in early childhood got at least one infection<br />
caused by RSV but may have been asymptomatic or<br />
with moderate symptoms. In Thailand, 417.1/100 000<br />
incidences <strong>of</strong> pneumonia per year were connected<br />
with RSV infections in children below 5 y. (Olsen et al.,<br />
2010). Meta-analysis performed by Nair et al. (2010)<br />
indicated, that 33.8 million <strong>of</strong> new episodes <strong>of</strong> RSV<br />
infections were occurred worldwide in children < 5 y.<br />
in 2005. Among them, 3.4 million cases were associated<br />
with acute lower respiratory infections (ALRI) which<br />
required hospitalization. The authors also estimated<br />
that 66 000–199 000 children (< 5 y.) died from ALRI<br />
associated with RSV in 2005. The majority <strong>of</strong> deaths<br />
* Corresponding author: K. Pancer, National Institute <strong>of</strong> Public Health-National Institute <strong>of</strong> Hygiene, Chocimska 24, 00-791 Warsaw,<br />
Poland; phone: +48 22 5421308; fax: +48 22 5421385; e-mail:kpancer@pzh.gov.pl
254<br />
were in developing countries (estimated 99%) (Nair<br />
et al., 2010).<br />
RSV was not found as a potential agent <strong>of</strong> severe<br />
infections in adults until 1970s, when outbreaks <strong>of</strong> RSV<br />
infections in long-term care facilities were recognized<br />
(Falsey et al., 1992). Next studies showed that RSV<br />
should be treated as an important cause <strong>of</strong> illness <strong>of</strong><br />
elderly people (+ 65 y.) especially in community-dwelling<br />
(nursing houses, hospitals etc.) (Falsey et al., 2005).<br />
The mortality rate due to RSV infections is dependent<br />
on the age <strong>of</strong> patient and presence <strong>of</strong> risk factors.<br />
Among younger children hospitalized with RSV infection<br />
– without additional risk factors- the mortality rate<br />
is less than 1%. High-risk mortality rate occurs among:<br />
1. infants with chronic lung disease (e.g. bronchopulmonary<br />
dysplasia), congenital heart disease, prematurity,<br />
low birth weight, artificial nutrition – 3–5%<br />
(Black, 2003; Krilov, http://emedicine.medscape.co./<br />
article/971488; Sullender, 2000)<br />
2. immunocompromised patients, elderly people<br />
with underlying disease – 8% <strong>of</strong> hospitalized (Falsey<br />
et al., 1992).<br />
Data regarding RSV infections in Poland are rather<br />
modest or/and incomplete (Belino-Studzińska and<br />
Pancer, 2008; Światły, 2001; Tranda et al., 2000). The<br />
majority <strong>of</strong> publications on RSV infection in Poland<br />
were based on results <strong>of</strong> serological examinations<br />
(Tranda et al., 2000; Łuczak et al., 2003). The problems<br />
<strong>of</strong> serological diagnosis <strong>of</strong> RSV infection were discussed<br />
previously (Pancer et al., 2010b). Briefly the problems<br />
<strong>of</strong> interpretation <strong>of</strong> specific to RSV IgM or IgG level<br />
determinations, especially among the youngest children<br />
(< 6 months), may be connected with necessity <strong>of</strong> cut<strong>of</strong>f<br />
value correction. Moreover the most <strong>of</strong> researches<br />
in Poland were focused only on one group <strong>of</strong> high risk<br />
<strong>of</strong> RSV infection – young children.<br />
The aim <strong>of</strong> this study was to analyze the frequency<br />
<strong>of</strong> RSV infections in two selected high risk groups:<br />
young children and adults with chronic respiratory<br />
tract diseases.<br />
Experimental<br />
Material and Methods<br />
Clinical specimens. Nasopharyngeal swabs from<br />
patients with viral respiratory tract infection (lower<br />
respiratory tract infection or upper respiratory tract<br />
infection or both) were collected and stored at –70°C.<br />
Selection <strong>of</strong> patients, based on clinical symptoms <strong>of</strong><br />
infection, was done by clinicians. All patients or their<br />
parents were informed about the project (subject,<br />
scientific targets, limits) and they agreed to partici-<br />
pate in this study (according to decision <strong>of</strong> The Bioethics<br />
Committee in the Military Institute <strong>of</strong> Medicine,<br />
Pancer K. et al. 3<br />
n° 87/WIM/2006, and decision <strong>of</strong> The Bioethics Committee<br />
in The Children’s Memorial Health Institute,<br />
n° 100/KBE/2007).<br />
The samples were collected in the period from October<br />
2008 to March 2010. In total 352 nasopharyngeal<br />
swabs were collected, among them – 254 from children<br />
and 98 – from adults. Eighteen samples were excluded<br />
because <strong>of</strong> use for nasopharyngeal specimen collection<br />
out <strong>of</strong> the procedure. Finally, 334 samples were examined<br />
(228 from children and 96 from adults).<br />
There were two groups <strong>of</strong> high risk <strong>of</strong> RSV infection<br />
formed:<br />
1. Young children – aged from 1 day <strong>of</strong> life to 5 y.<br />
with acute viral respiratory infection hospitalized in<br />
the Children’s Memorial Health Institute. Sixty percent<br />
<strong>of</strong> the children were ≤ 6 months old. The majority<br />
<strong>of</strong> young patients (84%) were admitted to the hospital<br />
because <strong>of</strong> acute viral respiratory infections, in 16%<br />
<strong>of</strong> children viral respiratory infection was recognized<br />
during hospitalization.<br />
2. Adult patients with chronic respiratory diseases<br />
– aged from 27 y. to 87 y., half <strong>of</strong> them (54%) were<br />
≥ 60 y. The samples were collected from the outpatients<br />
<strong>of</strong> the Immunology and Clinical Allergology Department,<br />
Military Institute <strong>of</strong> Medicine. They visited their<br />
doctor because <strong>of</strong> acute respiratory infection or exacerbation<br />
<strong>of</strong> the symptoms <strong>of</strong> respiratory tract disease.<br />
Classical RT-PCR. RNA was isolated from samples<br />
using QIAamp Viral RNA Mini kit (Qiagen) and<br />
stored at –70°C. Classical nested RT-PCR (Pancer et al.,<br />
2010a; Roca et al., 2001) for detecting viral RNA was<br />
performed in all clinical specimens (nasopharyngeal<br />
swabs). Briefly, nested RT-PCR reaction was done using<br />
Access RT-PCR System kit (Promega), at the C1000<br />
Thermal Cycler (Biorad). The primers and conditions<br />
<strong>of</strong> reactions for the first and second step <strong>of</strong> nested PCR<br />
were described previously (Roca et al., 2001).<br />
Detection <strong>of</strong> RSV antigen. The immunochromatografic<br />
test for qualitative detection <strong>of</strong> RSV antigen<br />
(Biotrin RSV Solo Assay, Ireland) was used for examination<br />
<strong>of</strong> 125/334 samples (collected from 57 children<br />
and 68 adults).<br />
Statistical analysis. The Statgraphic Centurion v.XV<br />
was used for analysis <strong>of</strong> correlation between obtained<br />
results and data <strong>of</strong> age, gender, onset date.<br />
Results<br />
In total, the genome <strong>of</strong> RSV was detected in 151 swab<br />
samples (45.2%). The frequency <strong>of</strong> detected RSV RNA<br />
was higher among children (53%) than among adults<br />
(25%). Genome <strong>of</strong> RSV was found in 50% <strong>of</strong> samples<br />
obtained from children in 2008; 43.8% in 2009 and in<br />
68.5% in the first quarter <strong>of</strong> 2010. Among adults posi-
3 Frequency <strong>of</strong> RSV infections<br />
255<br />
Fig. 1. Determination <strong>of</strong> RSV genome (PCR) and RSV antigen (Ag) in children and adults by quarter <strong>of</strong> onset<br />
in comparison to final diagnosis <strong>of</strong> RSV infection (RSV-pos).<br />
tive PCR samples were determined in 0%; 36.7% and<br />
5.9% respectively, but only few samples collected from<br />
adults were examined in 2008.<br />
Detection <strong>of</strong> RSV antigen by immunochromatografic<br />
test (RSV Ag) in selected 125 swab samples<br />
(57 chil dren, 68 adults) was performed. Among<br />
125 samples 64 were positive (51.2%) in total. The frequency<br />
<strong>of</strong> RSV Ag positive samples in children and<br />
adults were similar: 54.4% and 50%. Among 64 examined<br />
samples 36 (56%) were RSV Ag positive in 2009<br />
and 28/59 (47.5%) in the first 3 months <strong>of</strong> 2010.<br />
The final laboratory diagnosis <strong>of</strong> RSV infection<br />
was posed on the base <strong>of</strong> both results <strong>of</strong> examinations:<br />
RT-PCR and RSV Ag. Among 334 patients 182 cases<br />
<strong>of</strong> RSV infection (54.5%) were confirmed by RNA<br />
PCR and/or presence <strong>of</strong> RSV antigen, among them<br />
138 children and 44 adults. The relation <strong>of</strong> results by<br />
RT-PCR or RSV Ag to final RSV diagnosis are presented<br />
in figure 1. As it was shown, the highest percentage <strong>of</strong><br />
RSV(+) diagnosis was obtained by RT-PCR method.<br />
The analysis <strong>of</strong> gender <strong>of</strong> patients and detection<br />
<strong>of</strong> RSV genome/antigen showed lack <strong>of</strong> influence<br />
<strong>of</strong> sex on the RSV infection in all examined people<br />
(Po = 0.1434), as well as in adults and children (respectively<br />
Po = 0.2076 and Po = 0.2762). RSV infection was<br />
found in 67% <strong>of</strong> examined boys and 57% <strong>of</strong> girls and<br />
53% <strong>of</strong> examined men and 39% women.<br />
An analysis <strong>of</strong> age <strong>of</strong> RSV infected patients was<br />
also performed. There was no correlation between<br />
the age <strong>of</strong> patients and detection <strong>of</strong> RSV infection<br />
(Po = 0.0903), also among children (Po = 0.1486) and<br />
adults (Po = 0.2889). The highest frequency <strong>of</strong> RSV<br />
positive samples (65.0%) was found among the youngest<br />
children (≤ 6 months). In this group the diagnosis<br />
<strong>of</strong> RSV infection was mainly based on RT-PCR results<br />
(60.7%). In the second high risk group to RSV infection,<br />
≥ 60 y., the frequency <strong>of</strong> RSV infections was 43.3%,<br />
positive results by RSV-PCR were obtained in 19.2%<br />
<strong>of</strong> 96 patients, but by RSV Ag test as much as 50%<br />
<strong>of</strong> 68 persons. The number <strong>of</strong> patients from the first<br />
group <strong>of</strong> risk was two times higher than number <strong>of</strong><br />
elder patients. The RNA PCR results and final RSV<br />
diagnosis by age groups and number <strong>of</strong> patients are<br />
presented in figure 2.<br />
The significant correlations between detection <strong>of</strong><br />
RSV infection by RT-PCR method, time <strong>of</strong> samples<br />
collection and time <strong>of</strong> onset were found: by quarter; by<br />
months and by weeks (Po = 0.0000 – 0.0015). The highest<br />
percentage <strong>of</strong> positive results were in March (30.5%<br />
<strong>of</strong> all positive), February (28.5%), January (14.6%),<br />
December and April (both 9%). Only 8.4% <strong>of</strong> all positive<br />
RT-PCR samples were found in other seasons/<br />
months. However, there were some differences depending<br />
on the particular years <strong>of</strong> testing. RSV was found
256<br />
Fig. 2. Percentage <strong>of</strong> RSV positive samples by RT-PCR method<br />
(PCR+) and final RSV diagnosis (final RSV pos) by age group and<br />
number <strong>of</strong> examined patients.<br />
Fig. 3. Differences in frequency <strong>of</strong> RSV-positive samples<br />
(by RT-PCR) in two RSV epidemic seasons<br />
(2008–2009 and 2009–2010).<br />
in 48.5% <strong>of</strong> swabs collected in 2008; 41.5% in 2009 and<br />
50.8% <strong>of</strong> samples collected in the first three months <strong>of</strong><br />
2010 year. In the first season (December 2008 – March<br />
2009) the increased percentage <strong>of</strong> positive RSV swabs<br />
was observed in December, but peak <strong>of</strong> RSV infections<br />
was in March 2009. In the second season there were no<br />
RT-PCR positive samples collected in December 2009.<br />
The percentage <strong>of</strong> positive results slowly rose during<br />
January but a high level <strong>of</strong> infections was observed in<br />
March 2010 (74% positive samples) (Fig. 3).<br />
Discussion<br />
RSV is one <strong>of</strong> the most widespread viruses. The high<br />
risk factors <strong>of</strong> RSV infection are indicated: prematurity,<br />
especially birth at less than 35 weeks gestation; multiple<br />
Pancer K. et al. 3<br />
birth; chronic lung disease (bronchopulmonary dysplasia,<br />
cystic fibrosis); congenital heart diseases, especially<br />
with increased pulmonary blood flow; primary immunodeficiency,<br />
including symptomatic HIV infections,<br />
immunocompromised treatment (Iwane et al., 2004;<br />
Krilov http://emedicine.medscape.co./article/971488;<br />
Belino-Studzińska and Pancer, 2008). However, the<br />
other risk factors <strong>of</strong> RSV infections are: attendance at<br />
daycare centers, crowded living conditions, living in<br />
community-dwelling, presence <strong>of</strong> school-age siblings at<br />
home and smoking habit or exposure to passive smoking<br />
(Black, 2003).<br />
Clinical symptoms <strong>of</strong> RSV infection in general are<br />
not specific. Common RSV infections start usually as<br />
upper respiratory tract infections and during 1–2 days<br />
progress to diffuse small airway disease: cough, coryza,<br />
wheezing and rales and moderate fever (38°C and<br />
below) (Black, 2003; Krilov http://emedicine.medscape.<br />
co./article/971488) In more advanced stage cyanosis<br />
and higher fever may be observed. Reinfections <strong>of</strong> RSV<br />
occur throughout life, but they are mainly limited to<br />
upper respiratory tract infections, like common cold<br />
(7–10 days <strong>of</strong> illness) (Black, 2003; Falsey et al., 2005).<br />
<strong>No</strong>nspecific symptoms, usually limited to upper respiratory<br />
tracts, caused that the diagnosis <strong>of</strong> RSV infection<br />
was performed only in patients <strong>of</strong> high group <strong>of</strong> risk.<br />
Moreover, problems <strong>of</strong> diagnosis <strong>of</strong> RSV infection are<br />
also connected to time <strong>of</strong> sample collection, transport<br />
and store conditions, choice <strong>of</strong> laboratory methods.<br />
Detection <strong>of</strong> RSV genome in clinical samples from<br />
patients suspected to have RSV infections is limited<br />
only to a short period after onset (until 3–6 days), due<br />
to very fast degradation <strong>of</strong> RNA (Schultzle et al., 2008).<br />
This is a reason why we were able to found very significant<br />
correlation between the time <strong>of</strong> onset, time <strong>of</strong><br />
sample collection and results <strong>of</strong> PCR with reverse transcriptase<br />
step method (RT-PCR), especially in examinations<br />
<strong>of</strong> children. The sensitivity <strong>of</strong> this method was<br />
very high (3–5 Units/ml). However, RT-PCR method is<br />
not able to differentiate between productive and abortive<br />
infection <strong>of</strong> RSV, because both, RNA <strong>of</strong> infectious<br />
as well as defective RSV particles, was detected.<br />
Antigen <strong>of</strong> RSV was found in clinical samples<br />
through longer time from onset than virus RNA. Generally,<br />
the immunochromatographic tests for RSV Ag<br />
are not such sensitive as RT-PCR method is (Jaguś et al.,<br />
2010; Mahony, 2008; Mills et al., 2010). In our study,<br />
100–1000 times differences in examinations performed<br />
with reference RSV strains were found. This test was<br />
less sensitive than RT-PCR, but no abortive infections<br />
were found.<br />
Finally, only 23.2% among the 125 samples examined<br />
by RT-PCR and RSV Ag test were positive by both<br />
methods (52% were positive in RT-PCR, 36% in RSV<br />
Ag assay). Agreement <strong>of</strong> positive results obtained in
3 Frequency <strong>of</strong> RSV infections<br />
257<br />
RT-PCR and RSV Ag detection method was observed<br />
in 19% <strong>of</strong> samples from adults and 28% from children.<br />
Detection <strong>of</strong> RSV infection among children was<br />
mainly based on positive results <strong>of</strong> RT-PCR. The predominance<br />
<strong>of</strong> positive results obtained by this method<br />
was very high in that group. In opposite, the method<br />
based on RSV antigen detection was better for identification<br />
<strong>of</strong> infections among adults, caused by this virus.<br />
It was especially visible in the first three-month period<br />
<strong>of</strong> 2010. This phenomenon might be explained by space<br />
<strong>of</strong> time between onset and sample collection. The children<br />
were hospitalized, thus nasopharyngeal swabs<br />
were collected in a few days after onset. The majority<br />
<strong>of</strong> adults were outpatients and the time <strong>of</strong> swab collection<br />
depended on scheduled <strong>of</strong> medical examinations<br />
by the specialist.<br />
Our results indicated that the frequency <strong>of</strong> RSV<br />
infection among children and adults with chronic<br />
respiratory diseases was really high (60.5% and 45.8%,<br />
respectively), especially in epidemic seasons. High frequency<br />
<strong>of</strong> RSV infection among young children hospitalized<br />
with acute respiratory infection determined in<br />
our study, correspond to data <strong>of</strong> other authors (Ivane<br />
et al., 2004; Black, 2003; Krilov http://emedicine.medscape.co./article/971488;<br />
Olsen et al., 2010; Nair et al.,<br />
2010). RSV infection was found in 46.8% <strong>of</strong> children<br />
< 2 y. with respiratory symptoms visiting emergency<br />
department in Edinburgh in winter season 2008–2009<br />
(Mills, 2010). Also, RSV was the predominant etiological<br />
agent (61.3%) among children with bronchiolitis,<br />
during a three-years study in Madrid (Calvo<br />
et al., 2010). Moreover, RSV was also recognized as an<br />
important cause <strong>of</strong> community-acquired pneumonia<br />
among hospitalized adults (Murata and Falsey, 2007).<br />
Among adult patients, 4.4% in RSV season and 1.0% in<br />
<strong>of</strong>f-season were admitted with RSV infections <strong>of</strong> lower<br />
respiratory tract to the hospital in Ohio (Dowell et al.,<br />
1996). RSV was an etiological agent <strong>of</strong> pneumonia in<br />
16.7% <strong>of</strong> 1730 patients (adults and children) in Thailand<br />
(Olsen et al., 2010). Generally, it was estimated<br />
that 3–7% <strong>of</strong> healthy elderly people and 4–10% <strong>of</strong> highrisk<br />
adults develop every year infections caused by RSV<br />
in USA (Falsey et al., 1992; Falsey et al., 2005; Hashem<br />
and Hall, 2003).<br />
According to our analysis no difference in gender<br />
<strong>of</strong> patients with RSV infection was observed. However,<br />
other authors found that among hospitalized children<br />
frequency <strong>of</strong> boys was 2 – times higher than girls, but<br />
the difference was not significant (Black, 2003; Krilov<br />
http://emedicine.medscape.co./article/971488).<br />
The obtained results suggest no difference in the<br />
prevalence <strong>of</strong> RSV infections in the studied groups <strong>of</strong><br />
high risk: young children and adults with chronic respiratory<br />
tract infections. The peak <strong>of</strong> epidemic activity<br />
<strong>of</strong> RSV during 18 months <strong>of</strong> observation was the same<br />
in children and in adults. In Europe the season <strong>of</strong> RSV<br />
infections occurs in winter months, however, the peak<br />
<strong>of</strong> epidemic activity may be different. For example,<br />
in Greece the most <strong>of</strong> RSV infections were noted in<br />
February, in Italy in February during one season and<br />
in March in another season, in Croatia in January (one<br />
season) and April (another one) (Mlinaric-Galinovic<br />
et al., 2008). The season <strong>of</strong> RSV infection occurs in<br />
Poland in the winter months, usually from <strong>No</strong>vember<br />
to April. In both analyzed seasons the peak <strong>of</strong> epidemic<br />
activity <strong>of</strong> RSV was in March, however, there were<br />
some differences. In the first analyzed season number<br />
<strong>of</strong> RSV positive samples/patients increased slowly in<br />
<strong>No</strong>vember 2008 through December to one high peak<br />
in January 2009 and second peak in March 2009. In the<br />
second season (2009–2010) there were no positive RSV<br />
samples in December 2009 and suddenly the number<br />
<strong>of</strong> RSV (+) samples increased in January to the peak<br />
in March 2010. Such kind <strong>of</strong> seasonal variations were<br />
also described in <strong>No</strong>rway (Fjaerli et al., 2004) In the<br />
season 1998–99 the number <strong>of</strong> RSV positive samples<br />
increased very slowly from <strong>No</strong>vember to January and<br />
suddenly a very high peak <strong>of</strong> RSV (+) was in February.<br />
In another season, 1999–2000, two peaks were found:<br />
December 1999 – January 2000 and lower peak in<br />
April 2000. Results <strong>of</strong> our study show similarity rather<br />
to data obtained in Scandinavia and described by Fjaerli<br />
et al. (2004).<br />
Conclusions. The results <strong>of</strong> our study indicate that<br />
the contribution <strong>of</strong> RSV infections to spectrum <strong>of</strong><br />
respiratory tract diseases suspected to viral etiology in<br />
winter epidemic seasons (2008–2009 and 2009–2010)<br />
in Poland was even higher than expected. Diagnosis<br />
<strong>of</strong> RSV infection is further complicated by the concurrent<br />
influence <strong>of</strong> other common viral respiratory<br />
pathogens (especially influenza, parainfluenza, hMPV),<br />
which co-circulate with RSV during winter months.<br />
Analysis <strong>of</strong> RSV infections during subsequent seasons<br />
should be continued for better knowledge <strong>of</strong> epidemiological<br />
situation concerning the viral respiratory infections<br />
in Poland.<br />
Acknowledgments<br />
This study was supported by grants <strong>of</strong> <strong>Polish</strong> Ministry <strong>of</strong> Science<br />
and Education NN 404 165 534 (2008 – 2011) and NN 404 169 934<br />
(2008–2011).<br />
Literature<br />
Belino-Studzińska P. and Pancer K. 2008. Respiratory syncytial<br />
virus: as an etiological agent <strong>of</strong> respiratory tract infection in children<br />
and adults (in <strong>Polish</strong>). Przegl. Epidemiol. 62: 767–75.<br />
Black C.P. 2003. Systematic review <strong>of</strong> the biology and medical management<br />
<strong>of</strong> Respiratory syncytial virus infection. Respiratory Care<br />
48: 209–233.
258<br />
Calvo C., F. Pozo, M.L. Garcia-Garcia, M. Sanchez, M. Lopez-<br />
Valero, P. Pérez-Breña and I. Casas. 2010. Detection <strong>of</strong> new respiratory<br />
viruses in hospitalized infants with bronchiolitis: a three-year<br />
prospective study. Acta Paediatr. 99: 883–887.<br />
Dowell S.F., L.J. Anderson, H.E. Jr Gary, D.D. Erdman, J.F. Plouffe,<br />
T.M. Jr File, B.J. Marston and R.F. Breiman. 1996. Respiratory<br />
syncytial virus is an important cause <strong>of</strong> community-acquired lower<br />
respiratory infection among hospitalized adults. J. Infect. Dis. 174:<br />
456–462.<br />
Falsey A.R., P.A. Hennessey, M.A. Formica, M.S.C. Cox and<br />
E.E. Walsh. 2005. Respiratory syncytial virus infection in elderly and<br />
high-risk adults. N. Engl. J. Med. 352: 1749–1759.<br />
Falsey A.R., J.J. Treanor, R.F. Betts and E.E. Walsh. 1992. Viral<br />
respiratory infections in the institutionalized elderly: clinical and<br />
epidemiological findings. J. Am. Geriatr. Soc. 40: 115–119.<br />
Fjaerli H.O., T. Farstad and D. Bratlid. 2004. Hospitalizations<br />
for Respiratory syncytial virus bronchiolitis in Akershus, <strong>No</strong>rway,<br />
1993–2000: a population-based retrospective study. BMC Pediatric<br />
4: 25–31.<br />
Hashem M. and C.B. Hall. 2003. Respiratory syncytial virus in<br />
healthy adults: the cost <strong>of</strong> cold. J. Clin. Virol. 27: 14–21.<br />
Iwane M.K., K.M. Edwards, P.G. Szilagyi, S.G. Humiston, R. Barth,<br />
T. McInerny, L. Shone and B. Schwartz. 2004. Population-based<br />
surveillance for hospitalizations associated with Respiratory syncytial<br />
virus, Influenza virus, and Parainfluenza viruses among young<br />
children. Pediatrics 113: 1758–1764 updated 2010: http://www.pediatrics.org/cgi/content/full/113/6/1758.<br />
Jaguś P., J. Chorostowska-Wynimko and A. Roży. 2010. Diagnostics<br />
<strong>of</strong> some viral infections <strong>of</strong> respiratory tract (in <strong>Polish</strong>). Pneumonol.<br />
Alergol. Pol. 78: 47–53.<br />
Krilov L.R. Respiratory Syncytial Virus (RSV) infection. eMedicine<br />
Pediatrics. http://emedicine.medscape.com/article/971488.<br />
Lamb R.A. and G.D. Parks. 2007. Paramyxoviridae. The Viruses<br />
and their Replication. pp. 1449–1496 In: Knipe D.M, Howley P.M<br />
(eds.) Fields <strong>of</strong> virology Lippincott Williams& Wilkins, Wolters Kluwer<br />
Business.<br />
Łuczak G., E. Kozielska, J. Tyl, A. Borkowska, A. Galińska,<br />
W. Radys and Z. Bohdan. 2003. Role <strong>of</strong> Respiratory syncytial virus<br />
in respiratory tract infections pathogenesis in infants and small children.<br />
Med. Sci. Monit. 9: 44–47.<br />
Mahony J.B. 2008. Detection <strong>of</strong> respiratory viruses by molecular<br />
methods. Clin. Microbiol. Rev. 21: 716–747<br />
Mills J.M., J. Harper, D. Broomfield and K.E. Templeton. 2010.<br />
Rapid testing for Respiratory syncytial virus in a pediatric emergency<br />
department: benefits for infection control and bed management.<br />
J. Hosp. Infect. doi:10.1016/j.jhin.2010.11.019<br />
Pancer K. et al. 3<br />
Mlinaric-Galinovic G., R.C. Wellver, T. Vilibic-Cavlek, S. Ljubin-<br />
Sternak, V. Drazenovic, I. Galinovic and V. Tomic. 2008. The<br />
biennial cycle <strong>of</strong> Respiratory syncytial virus outbreaks in Croatia.<br />
Virology <strong>Journal</strong>. 5: 18–23.<br />
Murata Y. and A.R. Falsey. 2007. Respiratory syncytial virus infection<br />
in adults. Antivir. Ther. 12: 659–670.<br />
Nair H., D.J. <strong>No</strong>kes, B.D. Gessner, M. Dherani, S.A. Madhi,<br />
R.J. Singleton, K.L. O’Brien, A. Roca, P.F. Wright, N. Bruce and<br />
others. 2010. Global burden <strong>of</strong> acute lower respiratory infections<br />
due to Respiratory syncytial virus in young children: a systematic<br />
review and meta-analysis. Lancet 375: 1545–1555.<br />
Olsen S.J., S. Thamthitiwat, S. Chandra, M. Chittaganpitch,<br />
A.M. Fry, J.M. Simmerman, H.C. Baggett, T.C. Peret, D. Erdman,<br />
R. Benson and others. 2010. Incidence <strong>of</strong> respiratory pathogens in<br />
persons hospitalized with pneumonia in two provinces in Thailand.<br />
Epidemiol. Infect. 21: 1–12.<br />
Pancer K., A. Panasik, W. Gut, B. Lipka, D. Puchta, B. Milewska-<br />
Bobula, D. Dzierżanowska and B. Litwińska. 2010a. Infections<br />
caused by RSV – problems <strong>of</strong> diagnostic based on serological examinations.<br />
pp. 115–122. In: M. Polz-Dacewicz (ed.) Viral Infectiondiagnostics,<br />
prevention and control. The role <strong>of</strong> viral infection in public<br />
health. Uniwersytet Medyczny w Lublinie, Polskie Towarzystwo<br />
Wirusologiczne, DA Studio<br />
Pancer K., A. Panasik, A. Makówka, P. Belino-Studzińska,<br />
W. Gut, D. Puchta, D. Dzierżanowska and B. Litwińska. 2010b.<br />
The influence <strong>of</strong> preanalytical factors on detection <strong>of</strong> RNA viruses<br />
by reverse transcription – polymerase chain reaction (RT-PCR).<br />
pp. 105–113. In: M. Polz-Dacewicz (ed.) Viral Infection-diagnostics,<br />
prevention and control. The role <strong>of</strong> viral infection in public health.<br />
Uniwersytet Medyczny w Lublinie, Polskie Towarzystwo Wirusologiczne,<br />
DA Studio.<br />
Roca A., M.P. Loscertales, L. Quintó, P. Pérez-Breña, N. Vaz,<br />
P.L. Alonso and J.C. Saiz. 2001. Genetic variability among group A<br />
and B Respiratory syncytial viruses in Mozambique: identification <strong>of</strong><br />
a new cluster <strong>of</strong> group B isolates. J. Gen. Virol. 82: 103–11.<br />
Schutzle H., J. Weigl, W. Puppe, J. Forster and R. Berner. 2008.<br />
Diagnostic performance <strong>of</strong> a rapid antigen test for RSV in comparison<br />
with a 19-valent multiplex RT-PCR ELISA in children with<br />
acute respiratory tract infections. Eur. J. Pediatr. 167: 745–749.<br />
Sullender W.M. 2000. Respiratory syncytial virus genetic and antigenic<br />
diversity. Clin. Microbiol. Rew. 13: 1–15.<br />
Światły A. 2001. Acute bronchitis (in <strong>Polish</strong>). Przew Lek. 4: 6, 89–91.<br />
Tranda I., J. Wilczyński, M. Wróblewska-Kałużewska and<br />
E. Torbicka. 2000. Epidemiology <strong>of</strong> respiratory tract acute viral<br />
infections in children during first two years (in <strong>Polish</strong>). Ped. Pol.<br />
75: 619–623.
<strong>Polish</strong> <strong>Journal</strong> <strong>of</strong> <strong>Microbiology</strong><br />
2011, Vol. 60, <strong>No</strong> 3, 259–263<br />
ORIGINAL PAPER<br />
Detection <strong>of</strong> Giardia intestinalis Assemblages A, B and D<br />
in Domestic Cats from Warsaw, Poland<br />
DOROTA JAROS* 1,2 , WOJCIECH ZYGNER 2 , SŁAWOMIR JAROS 3,4 and HALINA WĘDRYCHOWICZ 2,3<br />
1 Institute for Medical Biology <strong>of</strong> the <strong>Polish</strong> Academy <strong>of</strong> Sciences, Łódź, Poland<br />
2 Division <strong>of</strong> Parasitology and Parasitic Diseases, Department <strong>of</strong> Preclinical Sciences, Faculty <strong>of</strong> Veterinary Medicine,<br />
Warsaw University <strong>of</strong> Life Sciences, Warsaw, Poland<br />
3 Laboratory <strong>of</strong> Molecular Parasitology, W. Stefanski Institute <strong>of</strong> Parasitology PAS, Warsaw, Poland<br />
4 Laboratory <strong>of</strong> Molecular Biology, Mabion Ltd., Łódź, Poland<br />
Received 7 February 2011, revised 30 June 2011, accepted 10 July 2011<br />
Introduction<br />
The protozoan parasite Giardia intestinalis infects<br />
vertebrates including humans, domestic and wild animals.<br />
This parasite can cause gastrointestinal infections<br />
ranging from mild to severe as well as chronic diseases.<br />
Giardia is one <strong>of</strong> the most common causes <strong>of</strong> diarrhoea<br />
in humans and the most frequent parasite <strong>of</strong> companion<br />
animals. Usually symptoms occur in six to fifteen<br />
days after infection. In the acute stage symptoms can<br />
last from two to four days, and after that a chronic phase<br />
can appear and can last from a few weeks to several<br />
years. However the disease is usually self-limiting and<br />
asymptomatic infections are common (Flanagan, 1992;<br />
Farthing, 1997; Singer and Nash, 2000; Adam, 2001).<br />
The potential health risk to humans from gastrointestinal<br />
parasites remains a significant problem throughout<br />
the world (Schantz, 1994). The main origin <strong>of</strong> infection<br />
is water contaminated with Giardia cysts (Karanis et al.,<br />
2007). However, food, especially raw vegetables, may be<br />
also contaminated with Giardia cysts. In addition, infection<br />
may be transmitted by direct person-to-person or<br />
person-to-animal contact, especially in communities<br />
Abstract<br />
Giardia intestinalis is a complex species divided into 7 assemblages (A – G). Two <strong>of</strong> them (A and B) are infective for both humans and<br />
animals. In cats four assemblages can occur: A, B, D, and F. Assemblages A and B infect either cats, dogs and humans, assemblage D infects<br />
cats and dogs and assemblage F only cats. The purpose <strong>of</strong> this study was to determine the prevalence and genotypes <strong>of</strong> G. intestinalis in cats<br />
from Warsaw. From <strong>No</strong>vember 2006 to March 2007 a hundred sixty samples <strong>of</strong> stool were collected and examined by light microscopy.<br />
G. intestinalis cysts were detected in 3.75% <strong>of</strong> samples. DNA extracted from positive samples was used as template for PCR-RFLP using<br />
Giardia specific primers and the amplicons were sequenced. A comparison <strong>of</strong> the obtained DNA sequences with the Giardia sequences in<br />
the GeneBank database revealed assemblage A in 1.25% <strong>of</strong> the investigated cats, assemblage B in 1.25% and D in 1.25%.<br />
K e y w o r d s: Giardia intestinalis, assemblage in cats, genotype, PCR-RFLP, zoonosis<br />
with poor standards <strong>of</strong> hygiene (Hunter and Thompson,<br />
2005). The prevalence <strong>of</strong> human giardiosis in the world<br />
ranges from 0.004% to almost 100%, and the most<br />
prevalent infections are detected in children < 2 years in<br />
developing countries. The mean prevalence in Europe,<br />
<strong>No</strong>rth America and Australia is 0–32%, depending<br />
on region and age group. In Poland the prevalence <strong>of</strong><br />
Giardia infection observed in humans is 0.04–9%, but<br />
children are infected more frequently than adults. In<br />
cats the prevalence <strong>of</strong> infection observed in the world<br />
is 0.6 to 80%, but in Poland the prevalence is rather low<br />
(1.3%). However only a few studies were performed<br />
(Zygner and Wędrychowicz 2008; Bajer et al., 2009).<br />
The species G. intestinalis includes seven assemblages<br />
A-G, that can be characterized using, for<br />
example, the glutamate dehydrogenase (gdh), smallsubunit<br />
(SSU) rRNA, and triosephosphate isomerase<br />
(tpi) genes (Monis et al., 1999; van Keulen et al., 2002;<br />
Read et al., 2004; Caccio et al., 2005; Papini et al., 2007).<br />
Assemblages A and B infect humans and other hosts,<br />
including cats (Monis et al., 1998; Monis et al., 1999;<br />
Thompson et al., 2000; van Keulen et al., 2002; Monis<br />
et al., 2003). Assemblage C infects only dogs, D infects<br />
* Corresponding author: D. Jaros, Division <strong>of</strong> Parasitology and Parasitic Diseases, Department <strong>of</strong> Preclinical Sciences, Faculty <strong>of</strong><br />
Veterinary Medicine, Warsaw University <strong>of</strong> Life Sciences; Ciszewskiego Str. 8, 02-786 Warsaw, Poland; phone +48 22 5936044; fax +48 22 593648;<br />
e-mail: djaros@cbm.pan.pl
260<br />
dogs and cats and assemblage F infects cats alone<br />
(Santíni et al., 2006; Souza et al., 2007; Palmer et al.,<br />
2008). Zoonotic transmission <strong>of</strong> G. intestinalis is still<br />
under consideration despite increasing knowledge <strong>of</strong><br />
the molecular identification <strong>of</strong> Giardia from different<br />
hosts (Monis et al., 2003; Thompson, 2004; Hunter and<br />
Thompson, 2005). Although Majewska (1994) showed<br />
zoonotic potential <strong>of</strong> Giardia, the reservoir <strong>of</strong> infection<br />
for humans is still unknown. In Poland assemblages A<br />
and B were detected in faecal samples from humans.<br />
However, in that study Giardia cysts were not detected<br />
in humans who had had permanent contact with animals<br />
(Solarczyk et al., 2010).<br />
The aim <strong>of</strong> this study was to analyse the genetic<br />
diversity <strong>of</strong> Giardia isolates from clinical cases among<br />
cats in Warsaw, Poland by gdh PCR-(RFLP) assay and<br />
the single gdh gene PCR assays. The different sequences<br />
were used to construct a database so it was possible to<br />
compare the result <strong>of</strong> this study with sequences previously<br />
published and available in the GenBank database.<br />
Experimental<br />
Materials and Methods<br />
Giardia cysts were identified in the Division <strong>of</strong><br />
Parasitology and Parasitic Diseases, Faculty <strong>of</strong> Veterinary<br />
Medicine, Warsaw University <strong>of</strong> Life Sciences.<br />
Fecal samples were collected from <strong>No</strong>vember 2006 to<br />
May 2007 in the Small Animal Clinic, Department <strong>of</strong><br />
Clinical Sciences, Faculty <strong>of</strong> Veterinary Medicine, Warsaw<br />
University <strong>of</strong> Life Sciences. In total 160 cat stool<br />
samples were collected. Giardiosis was diagnosed by<br />
detection <strong>of</strong> cysts in fecal samples using Meridian<br />
MeriFluor® Cryptosporidium/Giardia test according to<br />
manufacturer procedure (Meridian Diagnostics Inc.).<br />
DNA was extracted from all positive fecal samples<br />
using a stool extraction kit (QIAamp DNA stool kit,<br />
QIAGEN). A DNA fragment (about 770 bp) <strong>of</strong> the gdh<br />
gene was amplified using PCR-RFLP with primer GDH1<br />
(5’ ATC TTC GAG AGG ATG CTT GAG 3’) and<br />
GDH4 (5’ AGT ACG CGA CGC TGG GAT ACT 3’)<br />
as reported Homan et al. (1998). This method allowed<br />
to distinguish between assemblages A and B by RFLP<br />
analysis. Amplification was performed on a total reaction<br />
volume <strong>of</strong> 50 μl, containing template DNA and the<br />
following PCR mixture: 10 × Taq Reaction buffer, 2 mM<br />
MgCl 2 , 0.2 mM dNTPs, 1.25 units <strong>of</strong> Taq DNA polymerase<br />
(Fermentas) and 0.5 μM <strong>of</strong> each primer. The<br />
conditions <strong>of</strong> PCR were as follows: initially 94°C for<br />
3 min, then 35 cycles <strong>of</strong> 94°C for 30 s, 56°C for 30 s and<br />
72°C for 60 s, and finally, after these cycles, 72°C for<br />
10 min (Homan et al., 1998). The reactions were performed<br />
in a PTC 200 Thermal Cycler (MJ Research).<br />
Jaros D. et al. 3<br />
The PCR products were visualized by electrophoresis<br />
in 1% agarose gel with ethidium bromide. In all cases,<br />
the PCR products were gel purified using a gel extraction<br />
kit (Macherey – Nagel), and sequenced using an<br />
AbiPrism 3100 and GeneScan Analysis S<strong>of</strong>tware. The<br />
PCR products were sequenced in both directions using<br />
either GDH1 or GDH4 primers. Results were compared<br />
with sequences available in the GenBank database.<br />
The PCR products were purified using a gel extraction<br />
kit (Macherey – Nagel), and then digested with<br />
DdeI in a reaction mixture <strong>of</strong> 2 μl <strong>of</strong> 10 × buffer, 1 μl <strong>of</strong><br />
DdeI, 5 μl purified PCR products and distilled water<br />
to a final volume <strong>of</strong> 20 μl at 37°C for 1 hr. The digested<br />
mixtures were analysed by electrophoresis in 2% agarose<br />
gel with ethidium bromide (Homan et al., 1998).<br />
To be able to amplify and distinguish all assemblages,<br />
a distinct fragment <strong>of</strong> the gdh gene (220 bp) was<br />
amplified. The gdh gene fragment was amplified using<br />
the forward primer GDHF3 (5’-TCC ACC CCT CTG<br />
TCA ACC TTT C-3’) and the reverse primer GDHB5<br />
(5’-AAT GTC GCC AGC AGG AAC G-3’) as reported<br />
Itagaki et al. (2005). PCR reaction mixtures consisted<br />
<strong>of</strong> 0.5 μM <strong>of</strong> each primer, 0.2 mM <strong>of</strong> each dNTP, 2 mM<br />
MgCl 2 , 1 unit <strong>of</strong> Taq DNA polymerase (Fermentas) and<br />
10 × Taq Reaction buffer (Fermentas). The reactions<br />
were performed on a total reaction volume <strong>of</strong> 25 μl. The<br />
conditions <strong>of</strong> the PCR were as follows: initially 94°C for<br />
3 min, then 35 cycles <strong>of</strong> 94°C for 30 s, 59°C for 30 s and<br />
72°C for 30 s, and finally, after all these cycles, 72°C for<br />
10 min (Itagaki et al., 2005). The reactions were performed<br />
in a PTC 200 Thermal Cycler (MJ Research).<br />
The products <strong>of</strong> PCR were visualized by electrophoresis<br />
in 2% agarose gel with ethidium bromide. The PCR<br />
products were gel purified using the same kit mentioned<br />
above and sequenced using an AbiPrism 3100<br />
and GeneScan Analysis S<strong>of</strong>tware. PCR products were<br />
sequenced in both directions using either GDHF3 or<br />
GDHB5. The results were compared with sequences<br />
available in the GenBank database.<br />
Results<br />
Microscopic analysis <strong>of</strong> the 160 samples proved<br />
that only 6 (3.75%) were positive for Giardia cysts. In<br />
PCR-RFLP 770 bp products were obtained (Fig. 1a) in<br />
4 cases. After RFLP analysis two <strong>of</strong> them were recognized<br />
as assemblage A and another two as assemblage B<br />
(Fig. 1b). A comparison <strong>of</strong> all four sequences from<br />
PCR-RFLP with those from the GeneBank database<br />
allowed to identify them as fragments <strong>of</strong> G. intestinalis<br />
gdh gene and confirmed RFLP analysis. The sequencing<br />
and genotyping <strong>of</strong> two amplicons (220 bp) obtained<br />
from PCR using starters GDHF3 and GDHB5 revealed<br />
assemblage D (Fig. 1c).
3 Detection <strong>of</strong> G.intestinalis in cats<br />
261<br />
Discussion<br />
Fig. 1A. Detection <strong>of</strong> Giardia<br />
ghd gene by PCR-RFLP with<br />
primers GDH1 and GDH4.<br />
Lanes: M – 1 kb molecular weight<br />
marker (Fermentas); 1–4 – cat<br />
samples 770 bp.<br />
Fig. 1C. Restriction patterns <strong>of</strong> gdh<br />
gene amplified with GDH1 and GDH4.<br />
Lanes: M, 1 kb molecular weight marker<br />
(Fermentas); lane 1 izolate (B) from cat.<br />
The potential risk to human health from G. intestinalis<br />
infections remains a meaningful problem all over<br />
the world. Recent studies on parasites <strong>of</strong> dogs and cats<br />
have demonstrated that the levels <strong>of</strong> Giardia infections<br />
were higher than expected (Johnson and Gasser, 1993;<br />
Bugg et al., 1999; Itoh et al., 2006). Previous studies on<br />
feline giardiosis suggested a significant problem for<br />
human health because <strong>of</strong> the potential risk for zoonotic<br />
transmission (Robertson et al., 2000; Thompson<br />
et al., 2000; van Keulen et al., 2002; Read et al., 2004;<br />
Thompson, 2004). However, many scientists claimed<br />
that most cat infections were caused by assemblages<br />
D or F, non-pathogenic for human (Monis et al., 1998;<br />
Monis et al., 1999; van Keulen et al., 2002; Monis et al.,<br />
2003). In European countries, the genotypic characterization<br />
<strong>of</strong> G. intestinalis infections in cats has received<br />
little attention and very few isolates have been characterized<br />
(Berrilli et al., 2004; Lalle et al., 2005; Papini<br />
et al., 2007). In this study, four out <strong>of</strong> six Giardia positive<br />
cats had assemblages A or B potentially pathogenic<br />
for human. Therefore, the results <strong>of</strong> this study suggest<br />
that the population <strong>of</strong> Warsaw cats may pose a risk to<br />
Fig. 1B. Restriction patterns <strong>of</strong><br />
gdh gene amplified with GDH1<br />
and GDH4.<br />
Lanes: M, 1 kb molecular weight<br />
marker (Fermentas); lane 1, izolate<br />
(B) from cat.<br />
human health because <strong>of</strong> the possibility <strong>of</strong> zoonotic<br />
transmission.<br />
Feline giardiosis has been found all over the world<br />
and detection rates in particular regions fluctuate from<br />
0.58% to 60%. In USA, 0.58% <strong>of</strong> cats out <strong>of</strong> 631021<br />
examined possessed Giardia infection (De Santis-Kerr<br />
et al., 2006), in Japan 40% <strong>of</strong> cats were infected out <strong>of</strong><br />
600 examined (Itoh et al., 2006), in Turkey 22.4% <strong>of</strong> cats<br />
had it out <strong>of</strong> 100 examined (Cirak and Bauer, 2004). The<br />
prevalence may depend to a high degree on the method<br />
used for diagnosis. For instance, in Australia 5.6% or<br />
60% <strong>of</strong> cats out <strong>of</strong> 40 were reported to be infected,<br />
using PCR and ELISA respectively (McGlade et al.,<br />
2003). Also, in the Czech Republic 0.74% or 56.9% out<br />
<strong>of</strong> 107 investigated cats were found to be infected using<br />
conventional microscopic techniques or ELISA, respectively<br />
(Svobodova et al., 1995). These differences result<br />
from the different specificity and sensitivity <strong>of</strong> the tests.<br />
Last study showed that specificity and sensitivity <strong>of</strong> an<br />
ELISA test compared with fluorescent antibody test<br />
amounted 0.96 and 0.51 respectively. However, positive<br />
predictive value was rather poor at prevalence rates 10%<br />
or less (Rishniw et al., 2010). Thus, it is highly probable<br />
that the results <strong>of</strong> that test may be false positive rather<br />
than true positive. Moreover, Cirak and Bauer (2004)<br />
showed that another ELISA test was more <strong>of</strong>ten positive<br />
in microscopically Giardia-negative fecal samples<br />
in which Isospora spp. oocysts were detected than in<br />
samples without any parasites. This result may indicate<br />
cross-reactions in ELISA tests used in animals.<br />
The sensitivity and specificity <strong>of</strong> light microscopy<br />
used in this study highly depends on the experience<br />
and knowledge <strong>of</strong> technician or researcher, but PCR<br />
tests are more objective, highly sensitive and specific<br />
(Prichard and Tait 2001; Barr, 2006; Allenspach and<br />
Gaschen, 2008). Nantavisai et al. (2007) showed that<br />
the sensitivity and specificity <strong>of</strong> PCR method for detection<br />
<strong>of</strong> Giardia DNA is 97.3% (95% confidence interval,<br />
87.9–99.9%) and 100% (95% confidence interval,
262<br />
91.3–100%), respectively. However, sensitivities <strong>of</strong> different<br />
PCR tests are also variable. This depends on primers<br />
used for amplification <strong>of</strong> different target gene locus.<br />
Nantavisai et al. (2007) showed that PCR test with primers<br />
compatible for SSU rRNA gene fragment detected<br />
Giardia DNA in concentration <strong>of</strong> 10 pg/µl DNA per<br />
PCR mixture while PCR test with primers compatible<br />
for Triosephosphate isomerase gene fragment detected<br />
Giardia DNA in minimal concentration <strong>of</strong> 1000 pg/µl.<br />
The primers compatible for glutamate dehydrogenase<br />
gene fragment used in this study were moderately sensitive.<br />
This primer set allows to detect Giardia DNA in<br />
minimal DNA concentration <strong>of</strong> 1000 pg/µl, but minimal<br />
Giardia cyst concentration detected by this primer<br />
set was 337 cysts/ml <strong>of</strong> fecal sample, while primers<br />
compatible for Triosephosphate isomerase gene fragment<br />
allowed to detect Giardia DNA when minimal<br />
cyst concentration was 3368 cysts/ml.<br />
The results <strong>of</strong> this study differ from the results <strong>of</strong><br />
previous studies. In Japan and Australia all or all but<br />
one cats were infected with non-pathogenic for humans<br />
assemblage F (Itagaki et al., 2005, Palmer et al., 2008).<br />
However, in Brazil 42.1% Giardia infections were caused<br />
by assemblage A, and the remaining cats were infected<br />
with assemblage F (Souza et al., 2007). In Italy Papini<br />
et al. (2007) detected only assemblage A in all examined<br />
samples <strong>of</strong> cat feces. These differences can result from<br />
the fact that there are few researches on genotyping <strong>of</strong><br />
G. intestinalis infections in cats. The importance <strong>of</strong> Warsaw<br />
cats in the transmission <strong>of</strong> G. intestinalis to humans<br />
cannot be finally evaluated because <strong>of</strong> the small number<br />
<strong>of</strong> positive samples. However, the results <strong>of</strong> this work<br />
and that from Brazil (Souza et al., 2007) show there<br />
is a potential risk <strong>of</strong> human infection. Therefore, it is<br />
necessary to assume that a cat infected with Giardia<br />
possesses potentially zoonotic assemblages.<br />
Literature<br />
Adam R.D. 2001. Biology <strong>of</strong> Giardia lamblia. Clin. Microbiol. 14:<br />
447–475.<br />
Allenspach K. and F.P. Gaschen 2008. Small Intestinal Disease,<br />
pp.187–202. In: Steiner J.M. (ed). Small Animal Gastroenterology.<br />
Schlütersche Verlagsgesellschaft mbH & Co.KG, Hannover.<br />
Bajer A., M. Bednarska and E. Siński. 2009. Twenty years <strong>of</strong><br />
Crypto sporidium spp. and Giardia spp. investigations in Poland (in<br />
<strong>Polish</strong>). Wiad Parazytol 55: 301–304.<br />
Barr S.C. 2006. Giardiasis, pp. 736–742. In: Greene C.E. (ed). Infectious<br />
Diseases <strong>of</strong> the Dog and Cat. Saunders Elsevier, St. Louis, M.O.<br />
Berrilli F., D. Di Cave, C. D’Orazi, P. Orecchia, L. Xhelilaj,<br />
D. Bejko, P. Caça, D. Bebeci, F. Cenko, D. Donia and others. 2004.<br />
Prevalence and genotyping <strong>of</strong> human isolates <strong>of</strong> Giardia duodenalis<br />
from Albania. Parasitol. Int. 55: 295–297.<br />
Bugg R.J., I.D. Robertson, A.D. Elliot and R.C.A. Thompson.<br />
1999. Gastrointestinal parasites <strong>of</strong> urban dogs in Perth, Western<br />
Australia. Vet. J. 157: 295–301.<br />
Jaros D. et al. 3<br />
Caccio S.M., R.C.A. Thompson, J. McLaughlin and H.V. Smith.<br />
2005. Unravelling Cryptosporidium and Giardia epidemiology.<br />
Trends. Parasitol. 21: 430–437.<br />
Cirak V.Y. and C. Bauer. 2004. Comparison <strong>of</strong> conventional coproscopical<br />
methods and commercial coproantigen ELISA kits for the<br />
detection <strong>of</strong> Giardia and Cryptosporidium infections in dogs and<br />
cats. Berl. Munch. Tierarztl. Wochenschr. 117: 410–413.<br />
De Santis-Kerr A.C., M. Raghavan, N.W. Glickman, R.J. Caldanaro,<br />
G.E. Moore, H.B. Lewis, P.M. Schantz and L.T. Glickman.<br />
2006. Prevalence and risk factors for Giardia and coccidia species<br />
<strong>of</strong> pet cats in 2003–2004. J. Feline. Med. Surg. 8: 292–301.<br />
Farthing M.J. 1997. The molecular pathogenesis <strong>of</strong> giardiasis.<br />
J. Pediatr. Gastroenterol. Nutr. 24: 79–88.<br />
Flanagan P.A. 1992. Giardia – diagnosis, clinical course and epidemiology.<br />
Epidemiol. Infect. 109: 1–22.<br />
Homan W.L., M. Gilsing, H. Bentala, L. Limper and F. van Knapen.<br />
1998. Characterization <strong>of</strong> Giardia duodenalis by polymerase-chainreaction<br />
fingerprinting. Parasitol. Res. 84: 707–714.<br />
Hunter P.R. and R.C.A. Thompson. 2005. The zoonotic transmission<br />
<strong>of</strong> Giardia and Cryptosporidium. Int. J. Parasitol. 35: 1–10.<br />
Itagaki T., S. Kinoshita, M. Aoki, N. Itoh, H. Saeki, N. Sato, J. Uetsu ki,<br />
S. Izumiyama, K. Yagita and T. Endo. 2005. Genotyping <strong>of</strong> Giardia<br />
intestinalis from domestic and wild animals in Japan using glutamete<br />
dehydrogenase gene sequencing. Vet. Parasitol. 144: 283–287.<br />
Itoh N., N. Muraoka, J. Kawamata, M. Aoki and T. Itagaki. 2006.<br />
Prevalence <strong>of</strong> Giardia intestinalis infection in household cats <strong>of</strong><br />
Tohoku District in Japan. Parasitology 68: 161–163.<br />
Johnson J. and R.B. Gasser. 1993. Copro-parasitological survey <strong>of</strong><br />
dogs in South-Victoria. Aust. Vet. Pract. 23: 127–131.<br />
Karanis P., C. Kourenti and H. Smith. 2007. Waterborne transmission<br />
<strong>of</strong> protozoan parasites: a worldwide review <strong>of</strong> outbreaks and<br />
lessons learnt. J. Water. Health. 5: 1–38.<br />
Lalle M., E. Pozio, G. Capelli, F. Bruschi, D. Crotti and S.M. Cacciò.<br />
2005. Genetic heterogeneity at the beta-giardin locus among<br />
human and animal isolates <strong>of</strong> Giardia duodenalis and identification<br />
<strong>of</strong> potentially zoonotic subgenotypes. Int. J. Parasitol. 35: 207–213.<br />
Majewska A.C. 1994. Successful experimental infections <strong>of</strong> a human<br />
volunteer and Mongolian gerbils with Giardia <strong>of</strong> animal origin.<br />
Trans. R. Soc. Trop. Med. Hyg. 88: 360–362.<br />
McGlade T.R., I.D. Robertson, A.D. Elliot and R.C. Thompson.<br />
2003. High prevalence <strong>of</strong> Giardia detected in cats by PCR. Vet. Parasitol.<br />
110: 197–205.<br />
Monis P.T., R.H. Andrews, G. Mayrh<strong>of</strong>er, J. Mackrill, J. Kulda,<br />
J.L. Isaac-Renton and P.L. Ey. 1998. <strong>No</strong>vel lineages <strong>of</strong> Giardia intestinalis<br />
identified by genetic analysis <strong>of</strong> organisms isolated from dogs<br />
in Australia. Parasitology 116: 7–19.<br />
Monis P.T., R.H. Andrews, G. Mayrh<strong>of</strong>er and P.L. Ey. 1999. Molecular<br />
systematics <strong>of</strong> the parasitic protozoan Giardia duodenalis. Mol.<br />
Biol. Evol. 16: 1135–1144.<br />
Monis P.T., P.T. Andrews, G. Mayrh<strong>of</strong>er and P.L. Ey. 2003. Genetic<br />
diversity within the morphological species Giardia intestinalis and<br />
its relationship to host origin. Infect. Genet. Evol. 3: 29–38.<br />
Nantavisai K., M. Mungthin, P. Tan-ariya, R. Rangsin, T. Naaglor<br />
and S. Leelayoova. 2007. Evaluation <strong>of</strong> the Sensitivities <strong>of</strong> DNA<br />
Extraction and PCR Methods for Detection <strong>of</strong> Giardia duodenalis<br />
in Stool Specimens. J. Clin. Microbiol. 45: 581–583.<br />
Papini R., G. Cardini, B. Paoletti and A. Giangaspero. 2007.<br />
Detection <strong>of</strong> Giardia assemblage A in cats in Florence, Italy. Parasitol.<br />
Res. 100: 653–656.<br />
Palmer C.S., R.J. Traub, I.D. Robertson, G. Devlin, R. Rees and<br />
R.C. Thompson. 2008. Determining the zoonotic significance <strong>of</strong><br />
Giardia and Cryptosporidium in Australian dogs and cats. Vet. Parasitol.<br />
154: 142–147.<br />
Prichard R. and A. Tait. 2001. The role <strong>of</strong> molecular biology in<br />
veterinary parasitology. Vet Parasitol 98: 169–194.
3 Detection <strong>of</strong> G.intestinalis in cats<br />
263<br />
Read C.M., P.T. Monis and R.C.A. Thompson. 2004. Discrimination<br />
<strong>of</strong> all genotypes <strong>of</strong> Giardia duodenalis at the glutamate dehydrogenase<br />
locus using PCR-RFLP. Infect. Genet. Evol. 4: 125–130.<br />
Rishniw M., J. Liotta, M. Bellosa, D. Bowman and K.W. Simpson.<br />
2010. Comparison <strong>of</strong> 4 Giardia Diagnostic Tests in Diagnosis <strong>of</strong><br />
Naturally Acquired Canine Chronic Subclinical Giardiasis. J. Vet.<br />
Intern. Med. 24: 293–297.<br />
Robertson I.D., P.J. Irwin, A.J. Lymbery and R.C. Thompson.<br />
2000. The role <strong>of</strong> companion animals in the emergence <strong>of</strong> parasitic<br />
zoonoses. Int. J. Parasitol. 30: 1369–1377.<br />
Santíni M., J.M. Trout, J.A. Vecino, J.P. Dubey and R. Fayer. 2006.<br />
Cryptosporidium, Giardia and Enterocytozoon bieneusi in cats from<br />
Bogota (Colombia) and genotyping <strong>of</strong> isolates. Vet. Parasitol. 141:<br />
334–339.<br />
Schantz P.M. 1994. Of worms, dogs and human hosts: continuing<br />
challenges for veterinarians in prevention <strong>of</strong> human disease. J. Am.<br />
Vet. Med. Assoc. 204: 1023–1028.<br />
Singer S.M. and T.E. Nash. 2000. The role <strong>of</strong> normal flora in Giardia<br />
lamblia infection in mice. J. Infect. Dis. 181: 1510–1512.<br />
Solarczyk P., A. Werner and A.C. Majewska. 2010. Genotyping hu-<br />
man isolates from west-central Poland. Wiad. Parazytol. 56: 171–177.<br />
Souza S.L.P., S.M. Gennari, L.J. Richtzenhain, H.F. Pena,<br />
M.R. Funada, A. Cortez, F. Gregori and R.M. Soares. 2007. Molecular<br />
identification <strong>of</strong> Giardia duodenalis isolates from humans, dogs,<br />
cats and cattle from the state <strong>of</strong> São Paulo, Brazil, by sequence analysis<br />
<strong>of</strong> fragments <strong>of</strong> glutamate dehydrogenase (gdh) coding gene. Vet.<br />
Parasitol. 149: 258–264.<br />
Svobodova V., M. Svoboda and J. Konvalinova. 1995. Comparison<br />
<strong>of</strong> the detection <strong>of</strong> Giardia intestinalis cysts with the presence <strong>of</strong><br />
specific antibodies in dogs and cats. Vet. Med. 40: 141–146.<br />
Thompson R.C.A., R.M. Hopkins and W.L. Homan. 2000. <strong>No</strong>menclature<br />
and genetic groupings <strong>of</strong> Giardia infecting mammals. Parasitol<br />
Today 16: 210–213.<br />
Thompson R.C.A. 2004. The zoonotic significance and mole-<br />
cular epidemiology <strong>of</strong> Giardia and giardiasis. Vet. Parasitol. 126:<br />
15–35.<br />
van Keulen H., P.T. Macechko, S. Wade, S. Schaaf, P.M. Wallis and<br />
S.L. Erlandsen. 2002. Presence <strong>of</strong> human Giardia in domestic, farm<br />
and wild animals, and environmental samples suggests a zoonotic<br />
potential for giardiasis. Vet. Parasitol. 108: 97–107.<br />
Zygner W. and H. Wędrychowicz. 2008. Animals as giardiasis reservoir<br />
for humans (in <strong>Polish</strong>). Post. Mikrobiol. 47: 287–291.
<strong>Polish</strong> <strong>Journal</strong> <strong>of</strong> <strong>Microbiology</strong><br />
2011, Vol. 60, <strong>No</strong> 3, 265–268<br />
SHORT COMMUNICATION<br />
Evaluation <strong>of</strong> a Rapid Culture-Based Screening Test for Detection<br />
<strong>of</strong> Methicillin resistant Staphylococcus aureus<br />
BOUSHRA FWITY 1 , RALF LOBMANN 2 and ANDREAS AMBROSCH 1 *<br />
1 Institute <strong>of</strong> Laboratory Medicine and <strong>Microbiology</strong>, St.Joseph Hospital, Bremerhaven, Germany<br />
2 Dept. <strong>of</strong> Endocrinology, Diabetology and Geriatrics, Stuttgart General Hospital, Germany<br />
Received 22 <strong>No</strong>vember 2010, revised 4 May 2011, accepted 24 May 2011<br />
Active screening and compliance to appropriate<br />
infection control activities have been shown to play an<br />
important role in the control <strong>of</strong> MRSA (Kluytmans,<br />
2007). Rapid diagnostic tests have the potential to make<br />
efforts even more effective. Thus, infection prevention<br />
has taken a step forward with the introduction <strong>of</strong> various<br />
tests for rapid identification <strong>of</strong> MRSA carriers and<br />
infections (Harbarth et al., 2006). However, a variety <strong>of</strong><br />
increasingly sophisticated DNA-based tests have been<br />
developed to detect MRSA more rapidly (Francois et al.,<br />
2003; Huletsky et al., 2004). Most <strong>of</strong> these assays are<br />
based on the detection <strong>of</strong> Staphylococcus aureus specific<br />
sequences and the mecA gene. Despite the technical<br />
improvements in molecular based assays, their<br />
high cost and relatively high operator skill requirement<br />
remains obstacle to their widespread routine use. In<br />
addition, in a metaanalysis <strong>of</strong> ten studies on the effect<br />
<strong>of</strong> MRSA detection by rapid molecular screening tests<br />
compared to culture alone, no evidence was found on<br />
the effect <strong>of</strong> rapid testing on hospital-acquired MRSA<br />
infections and acquisition rate (Tacconelli et al., 2009).<br />
However, one problem might be the high sensitivity<br />
by amplification <strong>of</strong> bacterial sequences leading to an<br />
overestimation <strong>of</strong> MRSA colonization. This is assay<br />
immanent, since bacterial sequences were detected and<br />
not viable strains.<br />
The present study describes the evaluation <strong>of</strong> a commercially<br />
available rapid culture based test – the Baclite<br />
Rapid MRSA test – which has been developed to detect<br />
Abstract<br />
The performance <strong>of</strong> a culture based assay, BacLite Rapid MRSA for the rapid detection (5 hours) <strong>of</strong> methicillin resistant Staphylococcus<br />
aureus (MRSA) from specimens (n = 377) obtained from nares, throat, wounds and perineum was investigated. Compared to culture based<br />
reference methods (chromogenic MRSA ID (bioMerieux)), selective enrichment broth, PBP2’ latex agglutination (Oxoid) and VITEK 2<br />
identification (bioMerieux), an overall sensitivity <strong>of</strong> 71% with a 82% specificity and a negative predictive value (NPV) <strong>of</strong> 95% was provided.<br />
The Baclite test is rapid and easy to use and has the advantage <strong>of</strong> a culture-based detection method for MRSA.<br />
K e y w o r d s: Baclite Rapid MRSA test, chromogenic agar, test evaluation<br />
cipr<strong>of</strong>loxacin resistant MRSA strains within 5 hours.<br />
This new test was compared to a second generation<br />
chromogenic agar media combined with a selective<br />
enrichment broth for detection <strong>of</strong> viable MRSA. Sensitivities<br />
and specificities <strong>of</strong> the reference method were<br />
nearly that found for molecular methods (Perry et al.,<br />
2004; Reverdy et al., 2005).<br />
The Baclite Rapid MRSA test measures Adenylate<br />
Kinase (AK) activity, which is an essential house<br />
keeping enzyme found inside all cells, which regulates<br />
energy provision by catalyzing the equilibrium reaction<br />
<strong>of</strong> ATP + AMP → 2 ADP. By supplying purified ADP in<br />
vitro, the reaction can be driven to generate up to thousands<br />
ATP molecules per minute. The amplified levels<br />
<strong>of</strong> ATP produced during minutes can then be measured<br />
using the bioluminescence reaction <strong>of</strong> firefly luciferase.<br />
In the present assay, AK detection is combined with<br />
selective broth enrichment, magnetic microparticle<br />
extraction and selective lyse <strong>of</strong> S. aureus to add target<br />
organism specificity. In the extraction step, paramagnetic<br />
micro-particles coupled with a mouse anti-<br />
Staphylococcus aureus monoclonal antibody are used<br />
to capture MRSA. The unbound fraction is removed<br />
by washing procedures. Capture and washing occur as<br />
automated steps inside the automated wash module.<br />
In the lyses step, a reagent containing lysostaphin and<br />
ADP is added and the S. aureus in the sample lysed to<br />
release AK. The AK then catalyses the conversion <strong>of</strong><br />
ADP to ATP (Squirrel et al., 2002).<br />
* Corresponding author: A. Ambrosch, Institute <strong>of</strong> Laboratory Medicine and <strong>Microbiology</strong>, Wienerstr. 1, 27568 Bremerhaven;<br />
phone: 0049-471-4805539; fax: 0049-471-4805668; e-mail dr.ambrosch@josephhospital.de
266<br />
←<br />
←<br />
←<br />
Up to now, only a few studies were done with the<br />
Baclite Rapid MRSA assay. One study has dealt with<br />
its reliability to discriminate MRSA from a well characterized<br />
S. aureus strain collection (Von Eiff et al.,<br />
2007), and two others analyzing the clinical performance<br />
for nasal and groin swabs (O’Hara et al., 2007;<br />
Johnson et al., 2006). However, no data exists on the<br />
overall sensitivity and specificity <strong>of</strong> this new assay for<br />
the detection <strong>of</strong> MRSA from swabs obtained from the<br />
perineum and the side <strong>of</strong> chronic wound infection.<br />
This is <strong>of</strong> interest, since national hygiene guidelines<br />
for the surveillance <strong>of</strong> MRSA also provide swabbing<br />
<strong>of</strong> the perineum and chronic ulcers as potential sides<br />
<strong>of</strong> MRSA colonization. These sides have the diagnostic<br />
disadvantage <strong>of</strong> a high density <strong>of</strong> multiple microbial<br />
bystanders potentially interfering with the sensitivity<br />
or specificity <strong>of</strong> culture based MRSA tests.<br />
In the present study, swabs were collected from the<br />
anterior nares (n = 143), the throat (43), the perineum<br />
(113) and chronic ulcers (78). All swabs (cotton swabs<br />
with non-charcoal Amies transport medium, bioMerieux,<br />
La Balme Les Grottes, France) were taken as part<br />
<strong>of</strong> routine screening for MRSA colonization or infection<br />
according to the German national guideline for<br />
the infection control policies (www.rki.de). Specimens<br />
were transported rapidly and tested on the same day <strong>of</strong><br />
sampling. Two single swabs from each site were elected,<br />
one for the Baclite Rapid MRSA assay and the second<br />
one for the culture reference methods.<br />
A flow diagram <strong>of</strong> the processing protocol for swabs<br />
is depicted in Fig. 1: one swab sample was first spread<br />
on chromogenic MRSA ID medium (bioMerieux) and<br />
then washed out in a selective MRSA-Ident bouillon<br />
containing cefoxitine/sulbactam (Heipha). After incubation<br />
at 37°C for 18–24 hours, green colonies on MRSA<br />
agar were regarded as presumptive S. aureus isolates.<br />
Fwity B. et al. 3<br />
←<br />
←<br />
←<br />
Fig. 1. The diagnostic algorithm for the identification <strong>of</strong> MRSA: inoculation <strong>of</strong> swabs to Baclite Rapid MRSA assay<br />
compared to chromogenic MRSA ID agar and the subsequent procedure.<br />
The selective broth was plated on chromogenic MRSA<br />
ID and then incubated for an addition 24 h to increase<br />
sensitivity for detection <strong>of</strong> MRSA. S. aureus isolates<br />
were confirmed and identified using the PBP2’ latex<br />
agglutination test (Oxoid), a coagulase test (Oxoid) and<br />
the Vitek 2 identification and resistance testing system<br />
(GP card and AST-P554 card, bioMerieux).<br />
The second set <strong>of</strong> swabs was processed by the<br />
Baclite Rapid method according to the manufactures<br />
instructions. MRSA plates were inoculated first followed<br />
by the Baclite Rapid MRSA assay within 2 hours<br />
to avoid processing delay. Positive and negative control<br />
strains (MRSA and MSSA) were included as procedural<br />
controls in each run. Swab samples were vortexed in<br />
the proprietary Baclite selective broth (containing cipr<strong>of</strong>loxacin<br />
(6 mg/L) for two times and followed by an<br />
incubation period for 2.5 h at 37°C. Before the assay<br />
procedure was continued, the selective broth was subcultured<br />
on MRSA ID. This was done to evaluate the<br />
selectivity <strong>of</strong> the broth and to confirm the results <strong>of</strong> the<br />
rapid MRSA assay. However, following the manufactures<br />
instructions, MRSA were captured and washed<br />
in the Baclite sample processor. The bound fraction<br />
was resuspended in the selective broth and aliquots<br />
<strong>of</strong> each sample were placed into two adjacent wells <strong>of</strong><br />
a 96 well assay plate. One well <strong>of</strong> each sample was used<br />
to determine a baseline signal in the Baclite reader.<br />
After a further incubation period <strong>of</strong> 2 hours at 37°C,<br />
the second well for each sample was processed in the<br />
same way. The result was determined by subtraction the<br />
second from the first result and scored automatically as<br />
positive or negative to a s<strong>of</strong>tware embedded algorithm.<br />
Of the 377 surveillance specimens, S. aureus MRSA<br />
was isolated and confirmed from 49 samples by the reference<br />
methods. By the Baclite MRSA test, 89 <strong>of</strong> the<br />
samples were positive and 288 were detected as nega-
3 Short communication<br />
267<br />
Table I<br />
Comparison <strong>of</strong> Baclite Rapid MRSA test results with those obtained by reference methods.<br />
Baclite Rapid MRSA/ref.<br />
methods<br />
<strong>No</strong> <strong>of</strong> positive<br />
samples<br />
All swabs (n=377) 89/49 288/328 71 82 36 95<br />
From nares / throat (n=186) 38/27 148/159 70 84 43 93<br />
From chronic wounds (n=78) 25/13 53/65 69 74 33 94<br />
Perineum (n=113) 26/9 87/104 77 81 27 98<br />
tive. Since 35 out <strong>of</strong> the 49 confirmed MRSA samples<br />
were detected by the Baclite assay, 14 results were<br />
defined as false negative and 40 as false positive. From<br />
these data, a diagnostic sensitivity <strong>of</strong> 71%, a specificity<br />
<strong>of</strong> 82%, positive and negative predictive values (PPV<br />
and NPV) <strong>of</strong> 47% and 95%, respectively, were calculated<br />
from all sample results (Table I). Specificity, sensitivity,<br />
PPV and NPV for nares, chronic wounds and<br />
perineum were also calculated and given in Table I. The<br />
statistical performance <strong>of</strong> the test did not depend on<br />
the side <strong>of</strong> swabbing.<br />
However, in 12 samples defined as MRSA negative<br />
by the reference methods, MRSA was confirmed,<br />
when the enriched Baclite broth was subcultured onto<br />
MRSA ID agar. When these samples were included in<br />
the statistical performance <strong>of</strong> the Baclite MRSA test,<br />
an overall sensitivity <strong>of</strong> 77% with a specificity <strong>of</strong> 87%<br />
was calculated for the new MRSA assay.<br />
Hospitals and other health care facilities across<br />
the world are faced with alarming rates <strong>of</strong> infections<br />
caused by MRSA. Continuous spread <strong>of</strong> this pathogen<br />
requires efficient strategies for infection control,<br />
moreover since a 16-times higher transmission rate<br />
was suggested for MRSA carriers which are not subjected<br />
to contact isolation (Jernigan et al., 1996). However,<br />
conventional screening methods – as shown in<br />
the present study – require prolonged incubation and<br />
confirmatory testing up to 48 hours. During this time<br />
MRSA negative patients may be held in unnecessary<br />
isolation, whereas unidentified MRSA-positive individuals<br />
remain a hidden reservoir for cross-infection.<br />
To reduce the time taken for this evaluation, wards were<br />
selected (e.g. patients with previously reported MRSA<br />
in the last 3 months, chronic ulcers, antibiotic use in the<br />
last month) thus increasing the apparent prevalence <strong>of</strong><br />
MRSA in the hospital. In this context, rapid identification<br />
or exclusion <strong>of</strong> MRSA colonization is essential for<br />
the effective control <strong>of</strong> MRSA. The majority <strong>of</strong> MRSA<br />
screening is carried out in clinical microbiological laboratories<br />
using culture based methods with or without<br />
prior broth enrichment. Broth based enrichment<br />
media enhance test sensitivity (Nahimana et al., 2006;<br />
<strong>No</strong>nh<strong>of</strong>f et al., 2009), but adds an extra day to testing.<br />
As in the present study, the chromogenic MRSA ID<br />
<strong>No</strong> <strong>of</strong> negative<br />
samples<br />
PPV – positive predictive value; NPV – negative predictive value<br />
Sensitivity<br />
(%)<br />
Specificity<br />
(%)<br />
PPV<br />
(%)<br />
NPV<br />
(%)<br />
agar medium supplemented with 4 mg <strong>of</strong> cefoxitin/L is<br />
a widely used screening medium for MRSA. Although<br />
there is no one solid medium that is clearly superior,<br />
MRSA ID has demonstrated specificities and sensitivities<br />
<strong>of</strong> > 90% when compared to mecA PCR (Perry<br />
et al., 2004; Reverdy et al., 2005). Since an additional<br />
broth enrichment was used, the sensitivity and specificity<br />
<strong>of</strong> the reference methods is suggested to be similar<br />
to PCR methods.<br />
Compared to the reference methods, a high NPV<br />
(95%) <strong>of</strong> the Baclite Rapid MRSA test was obtained<br />
allowing negative results to be confidently reported<br />
within 5 h. In this view, our results are in line with<br />
the assay evaluation by Johnson et al. (2006) reaching<br />
a NPV <strong>of</strong> 98.7% for nasal screening swabs using mannitol<br />
salt agar plates containing oxacillin (MSAO agar)<br />
as a reference method. The diagnostic specificity and<br />
sensitivity for nasal swabs in our study was given with<br />
70 and 84%, respectively, and therefore lower (94.6%<br />
and 96.9%, respectively) as published by O’Hara et al.<br />
(2007). However, as negative samples make up the vast<br />
majority <strong>of</strong> MRSA screening tests particular in wards<br />
with a low MRSA prevalence, the high NPV evaluated<br />
for the Bacliteassay might represent a significant benefit<br />
to laboratories and the hygiene management. In<br />
contrast, in clinical settings with a high MRSA pressure,<br />
screening methods with a higher sensitivity and PPV<br />
should be used.<br />
A useful feature <strong>of</strong> the assay is that it has been<br />
designed to retain a sample <strong>of</strong> the broth containing<br />
enriched MRSA from which to perform direct sensitivity<br />
tests and confirm presumptive positive or negative<br />
results. However, there were 12 Baclite MRSA positive<br />
samples confirmed by MRSA ID from the enriched<br />
selective Baclite broth, which were negative by the reference<br />
method. Although they were classified as “false<br />
positive” as the results were distinct from the reference<br />
method, they could not be considered as false positive<br />
in the usual sense <strong>of</strong> the term. When these samples were<br />
included in the statistical performance <strong>of</strong> the Baclite<br />
MRSA test, an overall sensitivity <strong>of</strong> 77% with a specificity<br />
<strong>of</strong> 87% was calculated for the new MRSA assay. The<br />
better performance <strong>of</strong> the Baclite test in these samples<br />
compared to the reference might be due to two major
268<br />
reasons: 1) an overgrowth <strong>of</strong> commensal organisms on<br />
the selective reference broth might mask the presence<br />
<strong>of</strong> MRSA as also discussed with regard to the selective<br />
MSAO agar used by Johnson et al. (2006). 2) Distinctive<br />
quality <strong>of</strong> swabbing could also be reasonable for test<br />
variations when two methods are compared (Kljakovic,<br />
1992; Kingsley and Winfield-Davies, 2003).<br />
As observed by Johnson et al. (2006) cipr<strong>of</strong>loxacin<br />
sensitivity <strong>of</strong> Staphylococcus aureus usually found<br />
in community acquired MRSA (CA-MRSA) could be<br />
a reason for the failed detection by the Baclite assay.<br />
However, the frequency <strong>of</strong> CA-MRSA was 1.74% <strong>of</strong> all<br />
MRSA isolates in a German study, and therefore far<br />
less than reported from the USA (Witte et al., 2007).<br />
In general, cipr<strong>of</strong>loxacin supplemented medium seem<br />
to be a useful method for the detection <strong>of</strong> cipr<strong>of</strong>loxacin<br />
resistant MRSA. As shown by Davies and Zadik (1996),<br />
cipr<strong>of</strong>loxacin (8 mg/L) supplemented Baird-Parker<br />
medium (BPC) demonstrated a higher sensitivity for<br />
selection <strong>of</strong> MRSA than methicillin-supplemented<br />
mannitol salt agar (MMSA).<br />
The material costs <strong>of</strong> the Baclite are near to 15 EURO<br />
per single test, which is higher than a culture based<br />
method (around 1 EURO), but lower than commercial<br />
molecular based tests (> 20 EURO) (Tacconelli et al.,<br />
2009). The Baclite test requires a relative low level <strong>of</strong><br />
expertise and can be performed by a trained laboratory<br />
assistant, whereas the skill mix required to operate<br />
a PCR system may not be readily available in the<br />
diagnostic laboratory.<br />
Taken together, we report a non molecular MRSA<br />
screening test, which is useful for the detection <strong>of</strong> MRSA<br />
from nares, throat, chronic wounds and perineum<br />
within 5 h and retains the advantages <strong>of</strong> a culture-based<br />
method. However, since the test has a high NPV <strong>of</strong> 95%<br />
but is less sensitive and specific for the detection <strong>of</strong> cipr<strong>of</strong>loxacin<br />
resistant MRSA, the Baclite Rapid MRSA<br />
test seems to be more useful for wards with a low MRSA<br />
prevalence.<br />
Literature<br />
Davies S. and P.M. Zadik. 1997. Comparison <strong>of</strong> methods for the<br />
isolation <strong>of</strong> methicillin resistant Staphylococuus aureus. J. Clin.<br />
Pathol. 50: 257–258.<br />
Diederen B.M.W., M.L. van Leest, I. van Duijn, P. Wilemse,<br />
P.H.J. van Keulen and J.A. Kluytmans. 2006. Performance <strong>of</strong><br />
MRSA ID, a new chomogenic medium for detection <strong>of</strong> methicillinresistant<br />
Staphylococcus aureus. J. Clin. Microbiol. 44: 568–588.<br />
Francois P., D. Pitet, M. Bento, B. Pepey, P. Vaudaux, D. Lew and<br />
J. Schrenzel. 2003. Rapid detection <strong>of</strong> methicillin-resistant Stapyhlococcus<br />
aureus directly from sterile or non-sterile clinical samples by<br />
a new molecular assay. J. Clin. Microbiol. 41: 254–260.<br />
Gurran C., M.G. Holliday, J.D. Perry, M. Ford, S. Morgan and<br />
K.E. Orr. 2002. A novel selective medium for the detection <strong>of</strong> methicillin-resistant<br />
Staphylococcus aureus enabling result reporting in<br />
under 24 h. J. Hosp. Infect. 52: 148–151.<br />
Fwity B. et al. 3<br />
Harbarth S., C. Masuet-Aumatell and J. Schrenzel. 2006. Evaluation<br />
<strong>of</strong> rapid screening and pre-emptive contact isolation for detecting<br />
and controlling methicillin-resistant Staphylococcus aureus in<br />
critical care: an interventional cohort study. Crit. Care 10: R25.<br />
Huletsky A., R. Giroux, V. Rossbach, M. Gagnon, M. Vaillancourt,<br />
M. Bernier and F. Gagnon. 2004. New real time PCR assay<br />
for rapid detection <strong>of</strong> methicillin resistant Staphylococcus aureus<br />
directly from specimens. J. Clin. Microbiol. 42: 1875–1884.<br />
Jernigan J.A, M.G. Titus, D.H. Gröschel, S. Getchell-White and<br />
B.M. Farr. 1996. Effectiveness <strong>of</strong> contact bisolation during hospital<br />
outbreak <strong>of</strong> methicillin-resistant Staphylococcus aureus. Am. J. Epidemiol.<br />
143: 496–504.<br />
Johnson G., M.R. Millar, S. Matthews, M. Skyrme, P. Marsh,<br />
E. Barringer, S.O’Hara and M. Wilks. 2006. Evaluation <strong>of</strong> BacLite<br />
Rapid MRSA, a rapid culture based screening test for the detection<br />
<strong>of</strong> cipr<strong>of</strong>loxacin and methicillin resistant S. aureus (MRSA) from<br />
screening swabs. BMC <strong>Microbiology</strong> 6: 83–88.<br />
Kingsley A.M. and A. Winfield-Davies. 2003. Audit <strong>of</strong> wound<br />
swab sampling: why protocols could improve practice. Pr<strong>of</strong>. Nurse<br />
18: 338–343.<br />
Kljakovic M. 1992. The quality <strong>of</strong> a laboratory test in general practice:<br />
the throat swab example. N.Z. Med. J. 105: 355–357.<br />
Kluytmans J. 2007. Control <strong>of</strong> methicillin-resistant Staphylococcus<br />
aureus (MRSA) and the value <strong>of</strong> rapid tests. J. Hosp. Infect. 65:<br />
Suppl. 2, 100–104.<br />
Nahimana I., P. Francioli and D.S. Blanc. 2006. Evaluation <strong>of</strong> three<br />
chromogenic media (MRSA-ID, MRSA-select and CHROMagar<br />
MRSA) and ORSAB for surveillance cultures <strong>of</strong> methicillin-resistant<br />
Staphylococcus aureus. Clin. Microbiol. Infect. 12: 1168–74.<br />
<strong>No</strong>nh<strong>of</strong>f C., O. Denis, A. Brenner, P. Buidin, C. Thiroux,<br />
M. Dramaix and M.J. Struelens. 2009. Comparison <strong>of</strong> three chromogenic<br />
media and enrichment broth media for the detection <strong>of</strong><br />
methicillin-resistant Staphylococcus aureus from mucocutaneus<br />
screening specimens: comparison <strong>of</strong> MRSA chromogenic media.<br />
Eur. J. Clin. Microbiol. Inf. Dis. 28: 363–9.<br />
O’Hara S., S. Gregory and D. Taylor. 2007. Evaluation <strong>of</strong> the 3M<br />
Baclite Rapid MRSA test for the direct detection <strong>of</strong> MRSA from<br />
nasal and groin surveillance specimens. Abstract <strong>of</strong> the Annual<br />
Meeting <strong>of</strong> the Infectious Disease Society <strong>of</strong> America, San Diego,<br />
CA, A540, 162–163.<br />
Perry J.D., A. Davies, L.A. Butterworth, A.L.J. Hopley, A. Nicholson<br />
and F. K. Gould. 2004. Development and evaluation <strong>of</strong> a chromogenic<br />
agar medium for methicillin-resistan)t Staphylococcus<br />
aureus. J. Clin. Micobiol. 4: 4519–4523.<br />
Reverdy M.E., S. Orenga, J.M. Roche, S. Delorme and J. Etienne.<br />
2005. Multiresistant bacteria screening: clinical evaluation <strong>of</strong> MRSA ID,<br />
a new chromogenic medium for the screening <strong>of</strong> methicillin-resistant<br />
Staphylococcus aureus. abstr. P1383, 15 th European Congress<br />
Clin. Microbiol. Infec. Dis. 2005, ECCMID Copenhagen Denmark<br />
Squirrel D.J., M.J. Murphy, R.L. Leslie and J.C.D. Green. 2002.<br />
A comparison <strong>of</strong> ATP and adenylate kinase as bacterial cell markers:<br />
correlation with agar plate counts pp. 115–.123. In: R.A. Stanley and<br />
L.J. Kricka (eds). 2002. Bioluminescence and chemiluminescence<br />
progress and current applications. John Wiley and Sons.<br />
Tacconelli E, G. De Angelis, M.A. Cataldo, G. La Torre and<br />
R. Cauda. 2009. Rapid screening tests for methicillin-resistant<br />
Staphylococcus aureus at hospital admission: a systematic review<br />
and meta-analysis. Lancet Inf. Dis. 9: 546–54.<br />
Von Eiff C., D. Maas, G. Sander, A.W. Friedrich, G. Peters and<br />
K. Becker. 2007. Microbial evaluation <strong>of</strong> a new growth based<br />
approach for rapid detection <strong>of</strong> methicillin resistant Staphylococcus<br />
aureus. J. Antimicrob. Chemother. 61: 1277–1280.<br />
Witte W., C. Braulke and B. Strommenger. 2007. Methicillin resistant<br />
Staphylococcus aureus containing the Panton-Valentine leucocidin<br />
gene in Germany in 2005 and 2006. J. Antimicrob. Chemotherap.<br />
60: 1258–1263.
<strong>Polish</strong> <strong>Journal</strong> <strong>of</strong> <strong>Microbiology</strong><br />
2011, Vol. 60, <strong>No</strong> 3, 269–272<br />
SHORT COMMUNICATION<br />
Inhibition <strong>of</strong> Fibroblast Apoptosis by Borrelia afzelii, Coxiella burnetii<br />
and Bartonella henselae<br />
TOMASZ CHMIELEWSKI* and STANISŁAWA TYLEWSKA-WIERZBANOWSKA<br />
Laboratory <strong>of</strong> Rickettsiae, Chlamydiae and Spirochetes, National Institute <strong>of</strong> Public Health<br />
– Natonal Institute <strong>of</strong> Hygiene, Warsaw, Poland<br />
Apoptosis is a genetically controlled mechanism <strong>of</strong><br />
cell death involved in the regulation <strong>of</strong> tissue homeostasis.<br />
It has been found that some viral, bacterial and<br />
parasitic pathogens affect the viability <strong>of</strong> the host cell,<br />
inhibiting or promoting apoptosis (Carmen et al., 2006;<br />
Clifton et al., 1998; Fischer et al., 2004; Radulovic et al.,<br />
2002). In this process, activation <strong>of</strong> mediators called<br />
caspases plays a key role in the destruction phase <strong>of</strong><br />
cell apoptosis. At least 13 different caspases have been<br />
identified, which belong to three different subfamilies,<br />
depending on their substrate specificity.<br />
Caspase 3 is a cytosolic protein found in cells as an<br />
inactive 32 kDa proenzyme, and it is activated by various<br />
death signals into 20 kDa (p20) and 11 kDa (p11)<br />
active subunits. Both subunits contribute to substrate<br />
binding and catalysis. This protein cleaves and activates<br />
caspases 6, 7, and 9; moreover the protein itself is processed<br />
by caspases 8, 9, and 10 (Gołąb 2009).<br />
The aim <strong>of</strong> our studies was to investigate the influence<br />
<strong>of</strong> Borrelia afzelii, Coxiella burnetii, and Bartonella<br />
henselae bacteria on apoptosis measured as the level <strong>of</strong><br />
caspase 3 activity in human fibroblast cells.<br />
A suspension <strong>of</strong> B. henselae bacterial cells (ATCC<br />
49882) used for evaluations was obtained by growing<br />
on chocolate agar containing 5% defibrinated sheep<br />
blood in a humid atmosphere with 5% CO 2 at 35°C<br />
and harvested after 5 days when bacterial growth was<br />
sufficient. A final inoculum <strong>of</strong> 10 6 cfu/spot was used<br />
for inoculation in HEL-299 (Dörbecker et al., 2006).<br />
Received 2 June 2011, accepted 10 July 2011<br />
Abstract<br />
Apoptosis is a genetically controlled mechanism <strong>of</strong> cell death involved in the regulation <strong>of</strong> tissue homeostasis. The aim <strong>of</strong> this study was to<br />
investigate the influence <strong>of</strong> Borrelia afzelii, Coxiella burnetii, and Bartonella henselae bacteria on apoptosis measured as the level <strong>of</strong> caspase 3<br />
activity in human fibroblast cells HEL-299. Our findings show that C. burnetii bacteria may inhibit the process <strong>of</strong> apoptosis in the host cells<br />
for a long time. This can permit intracellular survival in the host and mediatingthe development <strong>of</strong> chronic disease.<br />
Key words: Borrelia afzelii, Coxiella burnetii, Bartonella henselae, fibroblasts, apoptosis<br />
Borrelia afzelii strain VS 461 (ATCC 51567) was grown<br />
at 35°C in BSK-H Medium Complete (Sigma-Aldrich,<br />
USA) to a cell density <strong>of</strong> 10 7 /ml (Pollack et al., 1993).<br />
C. burnetii (strain Henzerling) was cultured in<br />
HEL-299 (ATCC-CCL-137) human fibroblast cells<br />
in shell-vials containing 5 ml <strong>of</strong> Eagle’s Minimum<br />
Essential Medium (EMEM) medium with Earle’s BSS,<br />
2 mM L-glutamine and supplemented with 5% fetal<br />
bovine serum for 14 days. Cells were infected with<br />
the supernatant containing C. burnetii to a fresh monolayer<br />
and incubated in 5% CO 2 atmosphere at 35°C<br />
(Raoult et al., 1990).<br />
HEL-299 – human fibroblasts cells (ATCC-CCL-137)<br />
were cultured in shell-vials (Bibby Sterilin, Staffordshire,<br />
United Kingdom) containing 2 ml <strong>of</strong> EMEM with<br />
Earle’s BSS, 1 mM sodium pyruvate, 2 mM L-glutamine<br />
(ATCC, Manassas, Canada) and supplemented with<br />
5% fetal bovine serum. After two days the cells were<br />
infected with 100 μl C. burnetii, B. henselae and B. afzelii<br />
cultures. As a control, uninfected HEL299 cells were<br />
tested. Both infected and uninfected cells were incubated<br />
in 5% CO 2 atmosphere at 35°C.<br />
The course <strong>of</strong> human fibroblast apoptosis was evaluated<br />
by determination <strong>of</strong> caspase-3 activity at the same<br />
time in infected cell cultures after six hours post infection,<br />
on 7 th , 14 th 21 st and 28 th day <strong>of</strong> infection. All tests<br />
were run in triplicate.<br />
The presence <strong>of</strong> enzyme activity in cells lysates was<br />
determined with a Human Caspase-3 Instant ELISA<br />
* Corresponding author: T. Chmielewski, National Institute <strong>of</strong> Public Health – National Institute <strong>of</strong> Hygiene, ul. Chocimska 24,<br />
00-791 Warszawa; phone: 022-5421261; e-mail: tchmielewski@pzh.gov.pl
270<br />
(Bender MedSystems, Austria) according to the manufacturer’s<br />
protocol. Infected and uninfected cells adhering<br />
to cover slips in shell-vials were washed twice with<br />
PBS. Cells were incubated 60 minutes at room temperature<br />
with gentle shaking in lysing buffer (Lysis buffer,<br />
Bender MedSystems, Austria), then centrifuged<br />
at 1000 g for 15 minutes. Supernatants were stored at<br />
–80°C and assayed at the same time. Absorbance <strong>of</strong><br />
each sample was measured in duplicate on spectrophotometer<br />
at wavelength 450 nm. Concentration was<br />
calculated from a standard curve, created by plotting<br />
the mean absorbance for each standard concentration.<br />
Data were compared with the Mann-Whitney’s statistical<br />
test, and p-value less than 0.05 (level <strong>of</strong> significance)<br />
was considered statistically significant. Calculations<br />
were performed using the statistical package R<br />
Development Core Team, 2011 (Vienna, Austria).<br />
Caspase 3 activity in HEL299 cell line infected with<br />
B. afzelii, B. henselae and C. burnetii was compared.<br />
During 28 days a slight increase from 0.43 to 0.48 ng/ml<br />
was detected in uninfected cells.<br />
In cells infected with B. afzelii strain, the initial level<br />
<strong>of</strong> caspase 3 activity was 0.43 ng/ml. It showed a steady<br />
increase from 0.41 ng/ml, 0.44 ng/ml, 0.55 ng/ml to<br />
0.56 ng/ml on 7 th , 14 th , 21 st and 28 th days after infection,<br />
respectively.<br />
In cell cultures infected with B. henselae strain,<br />
a decrease <strong>of</strong> caspase-3 activity was observed, from<br />
0.45 ng/ml on the first day <strong>of</strong> infection to 0.34 ng/ml<br />
and 0.36 ng/ml after 7 and 14 days, followed by an<br />
increase to 0.48 ng/ml and 0.49 ng/ml after 21 and<br />
28 days <strong>of</strong> incubation.<br />
In cell culture inoculated with C. burnetii a decrease<br />
in the level <strong>of</strong> the enzyme activity from 0.45 ng/ml on<br />
the 1 st day to the level <strong>of</strong> 0.35 ng/ml on 7 th day and<br />
0.31 ng/ml on 14 th day was observed. After 21 and<br />
Chmielewski T. and Tylewska-Wierzbanowska S. 3<br />
Table I<br />
Levels <strong>of</strong> caspase 3 activity (ng/ml) in cultures HEL 299 infected<br />
with Bartonella henselae, Borrelia afzelii, Coxiella burnetii<br />
28 days the level stabilized at 0.34 ng/ml and 0.35 ng/<br />
ml (Table I).<br />
Comparing caspase 3 activity levels on the 1 st and<br />
28 th day, a 17% increase in B. afzelii infected HEL299<br />
cultures (p = 0.1) and 2% increase in cell cultures<br />
infected with B. henselae (p = 0.4) was observed, compared<br />
to uninfected HEL-299.<br />
In cell culture infected with Coxiella burnetii a 27%<br />
decrease in caspase 3 activity was detected (p = 0.1).<br />
The p-values greater than 0.05 and equal or less than<br />
0.10 may be treated as the border <strong>of</strong> statistical significance<br />
due to the small number <strong>of</strong> tests.<br />
In the present studies, the process <strong>of</strong> apoptosis on<br />
the basis <strong>of</strong> caspase 3 activity in human fibroblasts in<br />
vitro was monitored. In C. burnetii infected HEL 299<br />
caspase activity decreased after 7 days and was 22%<br />
less after 28 days than the initial level on the first day<br />
<strong>of</strong> infection. Inhibition was observed throughout the<br />
incubation period. At the same time, caspase 3 activity<br />
increased during four weeks <strong>of</strong> incubation in uninfected<br />
cell culture and in cells infected with B. azelii and<br />
B. henselae (Fig. 1).<br />
Several reports have described interactions between<br />
B. burgdorferi bacteria and various host cells. It has<br />
been shown that the spirochetes can enter mammalian<br />
immune cells and other cells as well as tick tissue. This<br />
process allows the pathogen to survive in host tissues,<br />
to infect them and to escape the host defense (Hu and<br />
Klempner, 1997; Klempner et al., 1993; Linder et al.,<br />
2001; Peters and Benach, 1997; Sigal 1997; Szczepanski<br />
et al., 1990; Thomas and Comstock 1989). Our study<br />
reveals that B. afzelii bacteria have the ability to inhibit<br />
apoptosis only for a short period <strong>of</strong> time compared to<br />
C. burnetii. Electron microscopic studies have revealed<br />
the consecutive steps <strong>of</strong> the B. burgdorferi life cycle<br />
in vitro. The spirochetes penetrate into fibroblasts.<br />
Caspase 3 activity measured in ng/ml with standard Caspase 3 activity<br />
Day<br />
deviation in cultures HEL 299 infected with<br />
Bartonella Borrelia Coxiella<br />
measured in ng/ml<br />
in uninfected<br />
henselae afzelii burnetii HEL 299 culture<br />
1 0.45 ± 0.04 0.39 ± 0.04 0.45 ± 0.04 0.43 ± 0.047<br />
7 0.34 ± 0.04 0.43 ± 0.07 0.35 ± 0.03 0.41 ± 0.04<br />
( 17%)* ( 5%)* ( 15%)*<br />
14 0.36 ± 0.06* 0.44 ± 0.03 0.31± 0.03 0.43 ± 0.04<br />
( 18%) ( 2%)* ( 28%)*<br />
21 0.48 ± 0.04 0.55 ± 0.04 0.34 ± 0.02 0.46 ± 0.04<br />
( 4%)* ( 20%)* ( 26%)*<br />
28 0.49 ± 0.03 0.56 ± 0.04 0.35 ± 0.03 0.48 ± 0.04<br />
( 2%)* ( 17%)* ( 27%)*<br />
←<br />
←<br />
→<br />
→<br />
* percentage <strong>of</strong> increase ( ) or decrease ( ) <strong>of</strong> caspase 3 activity levels calculated as a ratio<br />
<strong>of</strong> the levels in infected to uninfected HEL299 cells<br />
→<br />
→<br />
→ →<br />
→<br />
←<br />
←<br />
← ←<br />
←
3 Short communication<br />
271<br />
Fig. 1. Caspase 3 activity in uninfected HEL-299 cells and in cells<br />
infected with B. henselae, B. afzelii and C. burnetii<br />
They have been observed in the fibroblasts and after<br />
48 hours they are released to the extracellular space.<br />
This indicates that they stay in a cell only a short time<br />
(Chmielewski and Tylewska-Wierzbanowska, 2010).<br />
Thus, their ability to inhibit apoptosis is limited.<br />
Bacteria <strong>of</strong> the genus Bartonella, in the human body<br />
attach to epithelial cells and in the process <strong>of</strong> phagocytosis,<br />
they penetrate into the cells and multiply<br />
inside. They have an ability to form large aggregates.<br />
This structure creates perfect conditions for bacterial<br />
replication, protecting them from the host immune<br />
defense and degrading enzymes, present in lysosomes.<br />
Next, these organisms are released into the cytoplasm,<br />
in which produce and secrete factors stimulatinge cell<br />
proliferation, activation <strong>of</strong> pro-inflammatory factors<br />
and inhibiting apoptosis. After 4 days <strong>of</strong> infection,<br />
bacteria are released to the blood stream and penetrate<br />
into the erythrocytes and multiply intracellularly (Guz<br />
and Goroszkiewicz, 2009; Kordick et al., 1999). Ability<br />
to inhibit apoptosis in fibroblast culture in vitro, was<br />
observed especially between 7 to 14 days <strong>of</strong> infection.<br />
C. burnetii after successfully evading host defense<br />
mechanisms is able to inhibit apoptosis to survive and<br />
to multiply inside the cells. Inhibition <strong>of</strong> apoptosis has<br />
been observed among intracellular pathogens with<br />
characteristic slow multiplication to establish a productive<br />
infection. (Carmen et al., 2006; Clifton et al.,<br />
1998; Fischer et al., 2004). C. burnetii infection affects<br />
the expression <strong>of</strong> multiple apoptosis-related genes and<br />
resulting in increased synthesis <strong>of</strong> the antiapoptotic<br />
proteins such as A1/Bfl-1 and c-IAP2, prosurvival<br />
kinases Akt and Erk1/2 (extracellular signal-regulated<br />
kinases 1 and 2). C. burnetii infection <strong>of</strong> THP-1<br />
human macrophage-like cells caused increased levels <strong>of</strong><br />
phosphorylated c-Jun, Hsp27, Jun N-terminal protein<br />
kinase, and p38 protein. This pathogen can interfere<br />
with the intrinsic cell death pathway during infection<br />
by producing proteins that either directly or indirectly<br />
prevent release <strong>of</strong> cytochrome c from mitochondria.<br />
To summarize, these results indicate the importance <strong>of</strong><br />
C. burnetii modulation <strong>of</strong> host signaling in successful<br />
intracellular parasitism and maintenance <strong>of</strong> host cell<br />
viability (Voth et al., 2007; Voth and Heinzen, 2009;<br />
Lührmann and Roy 2007).<br />
C. burnetii is the one <strong>of</strong> the obligate intracellular<br />
pathogens that can infect mammalian monocytes and<br />
macrophages in vivo and can grow in Vero, fibroblast<br />
and macrophagelike cells in vitro. Our findings show<br />
that C. burnetii bacteria may inhibit the process <strong>of</strong><br />
apoptosis in the host cells for a long time. It can be<br />
the crucial pathogenic mechanism which permits the<br />
pathogen to survive intracellularly in the host and to<br />
mediate the development <strong>of</strong> chronic disease.<br />
C. burnetii has to inhibit host cell death to provide<br />
a stable, intracellular niche for the course <strong>of</strong> the pathogen’s<br />
infectious cycle. In cultures C. burnetii-infected<br />
cells can be maintained for weeks.<br />
Literature<br />
Carmen J.C., L. Hardi and A.P. Sinai. 2006. Toxoplasma gondii<br />
inhibits ultraviolet light-induced apoptosis through multiple interactions<br />
with the mitochondrion-dependent programmed cell death<br />
pathway. Cell Microbiol. 8: 301–315.<br />
Chmielewski T. and S. Tylewska-Wierzbanowska. 2010. Interactions<br />
between Borrelia burgdorferi and mouse fibroblasts. Pol.<br />
J. Microbiol. 59: 157–160.<br />
Clifton D.R., R.A. Goss, S.K. Sahni, D. van Antwerp, R.B. Baggs,<br />
V.J. Marder, D.J. Silverman and L.A. Sporn. 1998. NF-kappa<br />
B-dependent inhibition <strong>of</strong> apoptosis is essential for host cell survival<br />
during Rickettsia rickettsii infection. Proc. Natl. Acad. Sci. USA<br />
95: 4646–4651.<br />
Dörbecker C., A. Sander, K. Oberle and T. Schülin-Casonato.<br />
2006 In vitro susceptibility <strong>of</strong> Bartonella species to 17 antimicrobial<br />
compounds: comparison <strong>of</strong> Etest and agar dilution. J. Antimicrob.<br />
Chemother. 58: 784–788.<br />
Fischer S.F., J. Vier, S. Kirschnek, A. Klos, S. Hess, S. Ying and<br />
G. Häcker. 2004. Chlamydia inhibit host cell apoptosis by degradation<br />
<strong>of</strong> proapoptotic BH3-only proteins. J. Exp. Med. 200: 905–916.<br />
Gołąb J. 2009. Immunologia. (in <strong>Polish</strong>) Wydawnictwo Naukowe<br />
PWN, Warszawa<br />
Guz K. and W. Goroszkiewicz. 2009. Biology ecology and pathogenesis<br />
<strong>of</strong> Bartonella sp. (in <strong>Polish</strong>). Post. Mikrobiol. 48, 43–54.<br />
Hu L.T. and M.S. Klempner. 1997. Host-pathogen interactions<br />
in the immunopathogenesis <strong>of</strong> Lyme disease. J. Clin. Immunol. 17:<br />
354–365.<br />
Klempner M.S., R. <strong>No</strong>ring and R.A. Rogers. 1993. Invasion <strong>of</strong><br />
human skin fibroblasts by the Lyme disease spirochete, Borrelia<br />
burgdorferi. J. Infect. Dis. 167: 1074–1081.<br />
Kordick D.L., T.T. Brown, K. Shin and E.B. Breitschwerdt. 1999.<br />
Clinical and pathologic evaluation <strong>of</strong> chronic Bartonella henselae<br />
or Bartonella clarridgeiae infection in cats. J. Clin. Microbiol. 37:<br />
1536–1547.
272<br />
Linder S., C. Heimerl, V. Fingerle, M. Aepfelbacher and B. Wilske.<br />
2001. Coiling phagocytosis <strong>of</strong> Borrelia burgdorferi by primary<br />
human macrophages is controlled by CDC42Hs and Rac 1 and<br />
involves recruitment <strong>of</strong> Wiskott-Aldrich syndrome protein and<br />
Arp2/3 complex. Infect. Immun. 69: 1739–46.<br />
Lührmann A. and C.R. Roy. 2007. Coxiella burnetii inhibits activation<br />
<strong>of</strong> host cell apoptosis through a mechanism that involves<br />
preventing cytochrome c release from mitochondria. Infect. Immun.<br />
75: 5282–5289.<br />
Peters J.D. and J.L. Benach. 1997. Borrelia burgdorferi adherence<br />
and injury to undifferentiated and differentiated neural cells in vitro.<br />
J. Infect. Dis. 176: 470–477.<br />
Pollack R.J., S.R. Teleford III and A. Spielman. 1993. Standardization<br />
<strong>of</strong> medium for culturing Lyme disease spirochetes. J. Clin.<br />
Microbiol. 31: 1251–1255.<br />
Radulovic S., Price P.W., Beier M.S., Gaywee J., Macaluso J.A., and<br />
Azad A. 2002. Rickettsia-macrophage interactions: host cell responses<br />
to Rickettsia akari and Rickettsia typhi. Infect. Immun. 70: 2576–2582.<br />
Chmielewski T. and Tylewska-Wierzbanowska S. 3<br />
Raoult D., G. Vestris and M. Enea. 1990. Isolation <strong>of</strong> 16 strains <strong>of</strong><br />
Coxiella burnetii from patients by using a sensitive centrifugation<br />
cell culture system and establishment <strong>of</strong> the strains in HEL cells.<br />
J. Clin. Microbiol. 28(11): 2482–2484.<br />
Sigal L.H. 1997. Lyme disease: a review <strong>of</strong> aspects <strong>of</strong> its immunology<br />
and immunopathogenesis. Ann. Rev. Immunol. 15: 63–92.<br />
Szczepanski A., M.B. Furie, J.L. Benach, B.P. Lane and B. Fleit.<br />
1990. Interaction between Borrelia burgdorferi and endothelium in<br />
vitro. J. Clin. Invest. 85: 1637–1647.<br />
Thomas D.D. and L.E. Comstock. 1989. Interaction <strong>of</strong> Lyme disease<br />
spirochetes with cultured eucaryotic cells. Infect. Immun. 57:<br />
1324–1326.<br />
Voth D.E. and R.A. Heinzen. 2009. Sustained activation <strong>of</strong> Akt and<br />
Erk1/2 is required for Coxiella burnetii antiapoptotic activity. Infect.<br />
Immun. 77: 205–213.<br />
Voth D.E., D. Howe and R.A. Heinzen. 2007. Coxiella burnetii<br />
inhibits apoptosis in human THP-1 cells and monkey primary<br />
alveolar macrophages. Infect. Immun. 75: 4263–4271.
<strong>Polish</strong> <strong>Journal</strong> <strong>of</strong> <strong>Microbiology</strong><br />
2011, Vol. 60, <strong>No</strong> 3, 273<br />
Dear Editor,<br />
I have read the article with great interest by Abou-<br />
Dobara et al. in the third issue 2010 <strong>Polish</strong> <strong>Journal</strong> <strong>of</strong><br />
<strong>Microbiology</strong>, about antibiotic susceptibility and genotype<br />
patterns <strong>of</strong> Escherichia coli, Klebsiella pneumoniae<br />
and Pseudomonas aeruginosa isolated from patients<br />
with urinary tract infection (UTI) (Abou-Dobara<br />
et. al., 2010). UTIs are among the most frequent bacterial<br />
diseases both in community-acquired and nosocomial<br />
infections with high morbidity and mortality rates.<br />
Gram negative bacilli including E. coli, K. pneumoniae<br />
and P. aeruginosa are encountered as the leading causative<br />
agents in this disease (Thomas J.G., 2000). The<br />
antimicrobial resistance patterns <strong>of</strong> these bacteria are<br />
important so as to start an appropriate empirical treatment<br />
in order to avoid complications. In the present<br />
study although Abou-Dobara et al. aimed to examine<br />
the antimicrobial susceptibility <strong>of</strong> the isolates, but there<br />
are some points conflicting with our classical micro-<br />
biology knowledge:<br />
In the article, Abou-Dobara et al. separated P. aeruginosa<br />
isolates into three patterns; 1. Resistant to amikacin,<br />
piperacillin/tazobactam, nitr<strong>of</strong>urantoin (NF), cefotaxime,<br />
norfloxacin and trimethoprim-sulfametoxazole<br />
(SXT); 2. Resistant to NF, cefotaxime, norfloxacin and<br />
SXT; 3. Resistant to NF and SXT. The authors stated that<br />
they have examined the susceptibility <strong>of</strong> SXT and NF<br />
for P. aeruginosa in order to classify this species according<br />
to antibiotic resistance patterns. However, P. aeruginosa<br />
is already resistant to SXT due to MexAB-OprM<br />
porin (Livermore D.M., 2002). Likewise, NF has no<br />
effect on Pseudomonas spp. (Joseph D.C., et al., 2003).<br />
In addition, the authors noted that they evaluated the<br />
antimicrobial susceptibility tests according to National<br />
Committee for Clinical Laboratory Standards. This<br />
institution is currently named as “Clinical and Laboratory<br />
Standards Institute-(CLSI)”, has no recommendations<br />
for P. aeruginosa about SXT and NF susceptibility<br />
break points. (CLSI, 2008) On this account SXT and<br />
NF susceptibilty should not be tested for P. aeruginosa.<br />
Thereby, the antibiotic pattern classification <strong>of</strong> P. aeruginosa<br />
would be in two patterns.<br />
LETTER TO THE EDITOR<br />
This letter has been sent to the Editorial Office on January 2011. It concerns with the article <strong>of</strong> Abou-Dobara MI,<br />
Deyab MA, Elsawy EM, Mohamed HH. “Antibiotic susceptibility and genotype patterns <strong>of</strong> Escherichia coli,<br />
Klebsiella pneumoniae and Pseudomonas aeruginosa isolated from urinary tract infected patients”, published in<br />
<strong>No</strong> 3/2010 <strong>Polish</strong> <strong>Journal</strong> <strong>of</strong> <strong>Microbiology</strong>. It has been passed imediately to the authors <strong>of</strong> disccussed article asking<br />
them to respond to the comments. We have never got an answer.<br />
Secondly, the authors denoted that the have used<br />
some methods including Gram staining in the division<br />
<strong>of</strong> bacterial isolates into three groups – E. coli isolates<br />
as group 1, K. pneumoniae isolates as group 2, and<br />
P. aeruginosa isolates as group 3. Owing to the fact that<br />
all these three species are Gram negative bacilli, Gram<br />
staining method can not be performed for the differention<br />
<strong>of</strong> these bacteria (Ayers L.W. 2000).<br />
Thirdly, ideally, type cultures <strong>of</strong> E. coli, K. pneumoniae<br />
and P. aeruginosa should be used for such<br />
a study so as to standardize the identification and antimicrobial<br />
susceptibility tests <strong>of</strong> these bacteria.<br />
References<br />
1. Abou-Dobara M.I., Deyab M.A., Elsawy E.M. and Mohamed H.H.<br />
2010. Antibiotic susceptibility and genotype patterns <strong>of</strong> Escherichia<br />
coli, Klebsiella pneumoniae and Pseudomonas aeruginosa<br />
isolated from urinary tract infected patients. Pol. J. Microbiol.<br />
59(3): 207–12.<br />
2. Ayers L.W. 2000. Microscopic examination <strong>of</strong> infected materials,<br />
pp. 261–280. In: Mahon C.R., Manuselis G. (eds). Textbook <strong>of</strong><br />
Diagnostic <strong>Microbiology</strong>. 2 nd ed. W.B. Saunder Company, USA.<br />
3. Clinical Laboratory Standarts Institute. 2008. Performance<br />
Standards for Antimicrobial Susceptibility Testing; Eighteenth<br />
Informational Supplement. CLSI document M100–S18. Pennsylvania,<br />
USA.<br />
4. Joseph D.C., Yao and Robert C., Moellering J.R. 2003. Antibacterial<br />
agents, pp. 1039–1073. In: Murray P.R., Baron E.J., Jorgensen<br />
J.H., Pfaller MA., Yolken RH.(eds). Manual <strong>of</strong> Clinical<br />
<strong>Microbiology</strong>. 8 th ed. ASM Press, Washington, D.C.<br />
5. Livermore DM., 2002. Multiple Mechanisms <strong>of</strong> Antimicrobial<br />
Resistance in Pseudomonas aeruginosa: our worst nightmare?<br />
Clin. Infect. Dis. 34(5): 634–40.<br />
6. Thomas J.G. 2000. Urinary Tract Infections, pp. 1011–1032. In:<br />
Mahon C.R., Manuselis G. (eds). Textbook <strong>of</strong> Diagnostic <strong>Microbiology</strong>.<br />
2 nd ed. W.B. Saunder Company, USA.<br />
Adress for corespondance:<br />
Malatya State Hospital<br />
Central <strong>Microbiology</strong> Laboratory<br />
44100 Malatya-TURKIYE<br />
E-mail: selbir@hacettepe.edu.tr<br />
Phone: 0 90 505 488 13 04<br />
Fax: 090 422 325 34 38<br />
Sibel AK, MD<br />
Clinical Microbiologist