bis-13-587-continual-vocational-training-survey-cvts4
bis-13-587-continual-vocational-training-survey-cvts4
bis-13-587-continual-vocational-training-survey-cvts4

You also want an ePaper? Increase the reach of your titles
YUMPU automatically turns print PDFs into web optimized ePapers that Google loves.
Size of Enterprise<br />
Continuing Vocational Training Survey<br />
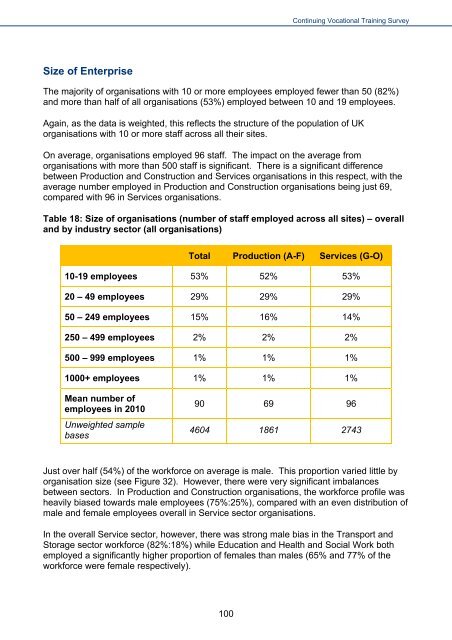
The majority of organisations with 10 or more employees employed fewer than 50 (82%)<br />
and more than half of all organisations (53%) employed between 10 and 19 employees.<br />
Again, as the data is weighted, this reflects the structure of the population of UK<br />
organisations with 10 or more staff across all their sites.<br />
On average, organisations employed 96 staff. The impact on the average from<br />
organisations with more than 500 staff is significant. There is a significant difference<br />
between Production and Construction and Services organisations in this respect, with the<br />
average number employed in Production and Construction organisations being just 69,<br />
compared with 96 in Services organisations.<br />
Table 18: Size of organisations (number of staff employed across all sites) – overall<br />
and by industry sector (all organisations)<br />
10-19 employees<br />
20 – 49 employees<br />
50 – 249 employees<br />
250 – 499 employees<br />
500 – 999 employees<br />
1000+ employees<br />
Mean number of<br />
employees in 2010<br />
Unweighted sample<br />
bases<br />
Total Production (A-F) Services (G-O)<br />
53% 52% 53%<br />
29% 29% 29%<br />
15% 16% 14%<br />
2% 2% 2%<br />
1% 1% 1%<br />
1% 1% 1%<br />
90 69 96<br />
4604 1861 2743<br />
Just over half (54%) of the workforce on average is male. This proportion varied little by<br />
organisation size (see Figure 32). However, there were very significant imbalances<br />
between sectors. In Production and Construction organisations, the workforce profile was<br />
heavily biased towards male employees (75%:25%), compared with an even distribution of<br />
male and female employees overall in Service sector organisations.<br />
In the overall Service sector, however, there was strong male bias in the Transport and<br />
Storage sector workforce (82%:18%) while Education and Health and Social Work both<br />
employed a significantly higher proportion of females than males (65% and 77% of the<br />
workforce were female respectively).<br />
100