2 Kinematics - BC Science Physics 11
2 Kinematics - BC Science Physics 11
2 Kinematics - BC Science Physics 11

Create successful ePaper yourself
Turn your PDF publications into a flip-book with our unique Google optimized e-Paper software.
2 <strong>Kinematics</strong><br />
By the end of this chapter, you should be able to do the following:<br />
➢ Apply knowledge of the relationships between<br />
time, displacement, distance, velocity, and speed to<br />
situations involving objects in one dimension<br />
• differentiate between scalar and vector quantities<br />
• construct displacement-versus-time graphs,<br />
based on data from various sources<br />
• use a displacement-versus-time graph to<br />
determine<br />
– displacement and distance<br />
– average velocity and speed<br />
– instantaneous velocity and speed<br />
• solve problems involving<br />
– displacement<br />
– time<br />
– average velocity<br />
• construct velocity-versus-time graphs, based on<br />
data from various sources<br />
• use velocity-versus-time graphs to determine<br />
– velocity<br />
– displacement<br />
– average velocity<br />
By the end of this chapter, you should know the meaning to these key terms:<br />
• acceleration<br />
• average velocity<br />
• constant acceleration<br />
• displacement<br />
• distance<br />
• final velocity<br />
• initial velocity<br />
• instantaneous velocity<br />
• projectile motion<br />
• scalar quantity<br />
• speed<br />
• vector quantity<br />
• velocity<br />
By the end of the chapter, you should be able to use and know when to use<br />
the following formulae:<br />
v = ∆d<br />
∆t<br />
v = v+v 0<br />
2<br />
a = ∆v<br />
∆t<br />
d = v 0 t + 1<br />
2 at 2<br />
d = vt v = v 0 + at<br />
v 2 = v 2 0 + 2 ad<br />
➢ Apply knowledge of the relationships between time,<br />
velocity, displacement, and acceleration to situations<br />
involving objects in one dimension<br />
• use velocity-versus-time graphs to determine<br />
acceleration, given appropriate data<br />
• solve a range of problems for objects with<br />
constant acceleration involving<br />
– displacement<br />
– initial velocity<br />
– final velocity<br />
– acceleration<br />
– time<br />
• recognize that a projectile experiences a constant<br />
downward acceleration due to gravity if friction is<br />
ignored<br />
• solve projectile motion problems involving<br />
– displacement<br />
– initial velocity<br />
– final velocity<br />
– acceleration due to gravity<br />
– time<br />
A roller coaster is an exciting<br />
example of kinematics in action.<br />
© Edvantage Interactive 2012 ISBN 978-0-9864778-3-6 Chapter 2 <strong>Kinematics</strong> 37
2.1 Speed and Velocity<br />
Warm Up<br />
Imagine you are on a hike from a parking lot to a waterfall 2 km away. Is there a way you could describe to<br />
someone that the hike was 4 km long and 0 km long? Explain your answer.<br />
The Study of Motion<br />
Distance and<br />
Displacement<br />
How far did it travel? How long did it take? How fast did it move? Did it speed up or slow<br />
down? These are typical questions one might ask about any object that moves, whether it<br />
is a car, a planet, an electron, or a molecule. All of these questions fall under the heading<br />
of kinematics: the study of the motion of objects, without reference to the cause of<br />
the motion. In kinematics, we learn how to describe the motion of objects in terms of<br />
measurable variables such as time, distance, speed, and acceleration.<br />
When you take a trip a road sign will tell you the distance you have to travel to reach<br />
your destination. This distance is usually measured in kilometres. Other distances you are<br />
familiar with include metres, centimeters, and millimetres. Each of these measurement<br />
units tells you how far two points are apart. Because magnitude, or amount of distance<br />
covered, and not distance is stated, distance is a scalar quantity. The symbol for distance<br />
is d.<br />
In the vector section of Chapter 1, two methods for determining direction were<br />
described. The first method involved the use of positive (+) and negative (–) signs to<br />
indicate direction. Any motion right or up is usually considered positive. Any motion left<br />
or down is usually considered negative. The second method uses compass points. North<br />
and east are usually considered positive, and west and south are negative. Sometimes this<br />
can change depending on the question. For example if all the motion is downward, you<br />
may consider using down as positive so the math calculations do not involve negative<br />
signs.<br />
When a direction is added to a distance, the position of an object or person is<br />
described. For example, if you are 5 km [east] of your home you are describing your<br />
position. Position is the shortest distance between the origin and where the person or<br />
object is located. Position is a vector quantity and includes magnitude and direction. The<br />
symbol for position is d → .<br />
If you change your position by moving another position 5 km [east] of your original<br />
position, then you have a displacement. Displacement is a change in position and is<br />
a straight line between initial and final positions. It includes magnitude and direction.<br />
The symbol for displacement is ∆d → . It is calculated by determining the change from one<br />
position to another. Or put mathematically:<br />
∆d → = d →<br />
f – d→ 0<br />
38 Chapter 2 <strong>Kinematics</strong> © Edvantage Interactive 2012 ISBN 978-0-9864778-3-6
The ∆ sign is important because it indicates a change. In this situation,<br />
displacement is defined as the change between the initial position and final position, not<br />
the displacement from the origin, which is your home.<br />
Sample Problem 2.1.1 — Calculating Displacement<br />
A person is 2.0 m to the left of a viewpoint sign enjoying the view. She moves 4.5 m to the right of the sign to get a<br />
better view. What is the person’s displacement?<br />
What to Think About<br />
1. Assume right is positive<br />
and identify the positions.<br />
2. Find the displacement.<br />
How to Do It<br />
→<br />
d0<br />
= 2.0 m [left] = – 2.0 m<br />
→<br />
d f = 4.5 m [right] = 4.5 m<br />
∆d → = d →<br />
f<br />
∆d →<br />
– d→<br />
0<br />
= 4.5 m – 2.0 m<br />
= 2.5 m<br />
The person’s displacement is 2.5 m [right]<br />
Practice Problems 2.1.1 — Calculating Displacement<br />
1. A woman walking her dog travels 200 m north, then 400 m west, then 500 m south.<br />
(a) What was the total distance she travelled?<br />
(b) What was the magnitude of her displacement for the entire trip?<br />
Continued on the next page<br />
© Edvantage Interactive 2012 ISBN 978-0-9864778-3-6 Chapter 2 <strong>Kinematics</strong> 39
Practice Problems 2.1.1 — Calculating Displacement (Continued)<br />
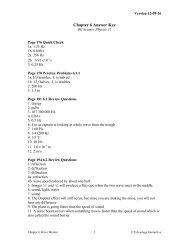
2. The diagram below shows the displacements of a golf ball caused by a rookie golfer attempting to reach<br />
hole number 7 on Ocean View Golf and Country Club. The golfer requires six shots to put the ball in the hole.<br />
The diagram shows the six displacements of the ball.<br />
�����<br />
���������������<br />
�����<br />
����<br />
�����<br />
����<br />
����<br />
(a) What is the total distance the golf ball travelled while the golfer was playing the seventh hole?<br />
(b) What is the resultant displacement of the ball?<br />
3. What is the total distance and displacement the dog takes after it leaves the front porch?<br />
Speed<br />
���<br />
���<br />
���<br />
������<br />
�����<br />
��� ���<br />
����<br />
���<br />
���<br />
The speed of an object such as a car is defined as the distance it travels in a unit of time.<br />
For highway traffic, speeds are measured in kilometres per hour (km/h). Typical highway<br />
speed limits are 80 km/h, 100 km/h, and 120 km/h. Within city limits, speed limits may<br />
be 60 km/h, 50 km/h, or 30 km/h (school zone or playground). The average speed of an<br />
athlete in a 100 m dash might be approximately 9.0 m/s. The speed of sound is 330 m/s,<br />
while the speed of light is approximately 300 000 000 m/s or 300 000 km/s.<br />
40 Chapter 2 <strong>Kinematics</strong> © Edvantage Interactive 2012 ISBN 978-0-9864778-3-6
Quick Check<br />
If you make a long journey by car, you might be interested in calculating your<br />
average speed for the trip. For example, if you travel a distance of 450 km in a time of<br />
6.0 h, you would calculate your average speed by dividing the total distance by the total<br />
time.<br />
average speed =<br />
total distance<br />
total time<br />
© Edvantage Interactive 2012 ISBN 978-0-9864778-3-6 Chapter 2 <strong>Kinematics</strong> 41<br />
= 450 km<br />
6.0 h<br />
= 75 km/h<br />
The symbol used for speed is v, and for average speed, v. Note that it is a line above<br />
the v is not an arrow. The formula for calculating average speed from distance (d) and<br />
time (t) is therefore:<br />
v _ = d<br />
t<br />
If you are driving along the highway and spot a police car parked beside the road<br />
with its radar aimed at your car, you will be less interested in your average speed and<br />
more concerned with your instantaneous speed. That is how fast your car is going at this<br />
instant in time! Your speedometer will indicate what your instantaneous speed is.<br />
1. (a) What is the difference between average speed and instantaneous speed?<br />
(b) Under what condition may average speed and instantaneous speed be the same?<br />
2. A tourist travels 320 km in 3.6 h. What is her average speed for the trip?<br />
3. A trucker travels 65 km at an average speed of 85 km/h. How long does the trip take?<br />
4. If your car averages 92 km/h for a 5.0 h trip, how far will you go?
The Difference<br />
Between Speed and<br />
Velocity<br />
Position-Time<br />
Graphs<br />
You learned that speed is distance travelled in a unit of time. Average speed is total<br />
distance divided by time, and instantaneous speed is the speed of an object at a<br />
particular instant. If an object moves along at the same speed over an extended period of<br />
time, we say its speed is uniform or constant.<br />
Uniform speed is uncommon, but it is possible to achieve nearly uniform speed<br />
in some situations. For example, a car with “cruise control” may maintain fairly constant<br />
speed on the highway. Usually, however, a vehicle is making small changes in speed and<br />
direction all the time.<br />
If an object is not travelling in a straight line all the time, then its direction becomes<br />
important and must be specified. When both the size and the direction of a speed are<br />
specified, we call the two properties (speed and direction) the velocity of the object. The<br />
symbol for velocity is v → . If you say your car is moving 80 km/h, then you are describing<br />
your car’s speed. If you say your car is travelling 80 km/h in a northerly direction, then you<br />
are describing your car’s velocity. The difference between speed and velocity becomes<br />
important in situations where direction changes during a trip. For example, when a ball<br />
is thrown into the air, both its speed and its direction change throughout its trajectory,<br />
therefore velocity is specified in this situation. Velocity is calculated by finding the<br />
displacement of an object over a period of time. Mathematically this is represented by:<br />
→<br />
v =<br />
∆d →<br />
∆t<br />
d→ f – d→ 0<br />
=<br />
∆t<br />
Speed and velocity can be graphically represented. The slope of a position-time graph<br />
gives the velocity of the moving object. A positive slope indicates positive velocity. A<br />
negative slope indicates negative velocity. When an object is not moving, the position<br />
does not change, so the slope is zero. That is, the line is horizontal.<br />
Sometimes it can be confusing to determine the direction and the sign to use. It is<br />
important to remember what point of view or frame of reference you are using to observe<br />
the action. For example, if you are riding a bike toward your friend at a velocity of<br />
10 km/h [west], your friend sees you coming at 10 km/h [east]. Both of you observe the<br />
same situation, it’s just the direction that is different. That is why it is important to know<br />
which direction is positive and which direction is negative before you start. Usually, if all<br />
the motion is in one direction, positive values will be used unless indicated. That will be<br />
the case in this book.<br />
The next sample problem describes how the motion of a skateboarder can be<br />
solved mathematically and graphically and the velocity of the skateboarder determined.<br />
42 Chapter 2 <strong>Kinematics</strong> © Edvantage Interactive 2012 ISBN 978-0-9864778-3-6
Sample Problem 2.1.2 — Solving Motion Problems Mathematically<br />
You are on a skateboard and moving to the right covering 0.5 m each second for 10 s. What is your velocity?<br />
What to Think About<br />
1. Motion is uniform so the velocity is the<br />
same for each time interval. Right will<br />
be positive.<br />
2. Solve for velocity.<br />
3. Include direction in the answer, which<br />
is right since the answer is positive.<br />
How to Do It<br />
∆d →<br />
0 = 0.0 m<br />
∆d →<br />
f = 0.5 m<br />
∆t = 1.0 s<br />
d→ –<br />
f d→ 0<br />
=<br />
v → = ∆d→<br />
∆t ∆t<br />
= 0.5 m – 0.0 m<br />
1.0s<br />
= 0.5 m/s<br />
v → = 0.5 m/s [right]<br />
Sample Problem 2.1.3 —Solving Motion Problems Graphically<br />
You are on a skateboard and moving to the right covering 0.5 m each second for 10 s. What is your velocity?<br />
What to Think About<br />
1. Collect data and record in<br />
table. Moving right will be<br />
considered positive.<br />
2. Graph data and draw best<br />
fit line.<br />
3. Find slope as it is equal<br />
to the velocity of the<br />
skateboarder.<br />
4. The slope is positive, so the<br />
direction is to the right.<br />
How to Do It<br />
�������������<br />
d (m) 0 0.5 1.0 1.5 2.0 2.5 3.0 3.5 4.0 4.5 5.0<br />
t (s) 0 1.0 2.0 3.0 4.0 5.0 6.0 7.0 8.0 9.0 1.0<br />
������������<br />
����������������<br />
�����������������<br />
�<br />
�<br />
�<br />
�<br />
�<br />
�<br />
� �� �� �� �� �� �� �� �� �� �� ��<br />
��������<br />
= d→<br />
f – d →<br />
0<br />
slope = ∆d→<br />
∆t ∆t<br />
v → =<br />
5.0 m – 0.0 m<br />
10 s<br />
= 0.5 m/s<br />
v → = 0.5 m/s [right]<br />
© Edvantage Interactive 2012 ISBN 978-0-9864778-3-6 Chapter 2 <strong>Kinematics</strong> 43<br />
= v →
Practice Problems 2.1.3 —Solving Motion Problems Graphically<br />
1. Describe the motion represented in each of the following position-time graphs.<br />
���<br />
���<br />
���<br />
� �<br />
� �<br />
� �<br />
��<br />
��<br />
��<br />
2. Sketch a graph of each of the following situations.<br />
(a) A golf ball is rolling towards a cup at 1.5 m/s [west].<br />
(b) A person is watching from the view of the cup and seeing the ball roll 1.5 m/s [east].<br />
(c) A person is traveling at 1.5 m/s [west] watching the cup roll towards the hole.<br />
3. (a) Fill in the data table if a car is traveling at 30 km/h through a school zone.<br />
Time (s) 1.0 2.0 3.0 4.0 5.0 6.0 7.0 8.0<br />
Distance (m)<br />
(b) Graph this data on a distance vs. time graph.<br />
44 Chapter 2 <strong>Kinematics</strong> © Edvantage Interactive 2012 ISBN 978-0-9864778-3-6
Investigation 2-1 Measuring the Speed of a Model Car<br />
Purpose<br />
To measure the speed of a model car, such as a radio-controlled vehicle<br />
Procedure<br />
1. Remove a 5.0 m length of ticker tape from a roll. Pass one end of it through a recording timer, and then tape it to<br />
a battery-powered toy car. (Figure 2.3)<br />
����������������<br />
�������<br />
����������<br />
�����<br />
Figure 2.1.1 Step 1<br />
2. Turn on the timer and let the car travel at its full speed until all the tape has passed through the timer.<br />
3. Every six dots is one-tenth of a second. Mark off the time intervals in one-tenth of a second on your tape<br />
4. Measure the distance traveled in each tenth of a second. Record your data in a table similar to Table 2.1.1.<br />
Table 2.1.1 Data Table for Investigation 2-1<br />
Time (s) 0.0 0.1 0.2 0.3 0.4 0.5 0.6 0.7 0.8 0.9 1.0 1.0 1.1 …<br />
Distance per<br />
interval (cm)<br />
Total distance<br />
(cm) …<br />
5. Create a distance vs. time graph. On the y-axis, use total distance and on the x-axis, use time. Draw a best-fit line<br />
on your graph.<br />
6. Find the slope of your graph and record it along with the appropriate units.<br />
Concluding Questions<br />
1. What does the slope of a distance-time graph represent?<br />
2. Find the average speed of the toy car over five 1 s intervals of the trip.<br />
3. Compare your slope of the distance-time graph with your average speed over the five 1 s intervals.<br />
4. Why might the average speed of the car during the first 1 s intervals be less than the average speed later in the<br />
trip?<br />
© Edvantage Interactive 2012 ISBN 978-0-9864778-3-6 Chapter 2 <strong>Kinematics</strong> 45<br />
…
2.1 Review Questions<br />
1. Can objects with the same speed have different<br />
velocities? Why or why not?<br />
2. What are two ways of describing the direction of an<br />
object’s motion?<br />
3. If you run with an average speed of 12.0 km/h, how<br />
far will you go in 3.2 min?<br />
4. If the average speed of your private jet is<br />
8.0 × 10 2 km/h, how long will it take you to<br />
travel a distance of 1.8 × 10 3 km?<br />
5. A red ant travels across a driveway, which is 3.5 m<br />
wide, at an average speed of 2.6 cm/s. How long<br />
will the ant take to cross the driveway? Express your<br />
answer (a) in seconds and (b) in minutes.<br />
46 Chapter 2 <strong>Kinematics</strong> © Edvantage Interactive 2012 ISBN 978-0-9864778-3-6
6. If your car moves with a steady speed of 122 km/h<br />
for 20.0 min, then at a steady speed of 108 km/h for<br />
30.0 min, what is the average speed of your car for<br />
the entire trip?<br />
7. A car moves with a steady speed of 84 km/h for<br />
45 min, then 96 km/h for 20 min.<br />
(a) What was the total distance travelled during the<br />
whole trip?<br />
(b) What is its average speed for the whole trip?<br />
8. An object is moving with uniformly increasing<br />
speed. Its speed at time zero is 0 m/s.<br />
(a) If its average speed during the first second is<br />
14 m/s, at what time will its instantaneous speed<br />
be 14 m/s?<br />
(b) What is its instantaneous speed at the end of the<br />
first second?<br />
© Edvantage Interactive 2012 ISBN 978-0-9864778-3-6 Chapter 2 <strong>Kinematics</strong> 47
2.2 Acceleration<br />
Warm Up<br />
Below are two blank speed-time graphs.<br />
On graph (a), sketch the slope that represents a sports car traveling at constant speed.<br />
On graph (b), sketch the slope of the same car starting from rest and speeding up at a constant rate.<br />
�����<br />
���<br />
Changing Velocity<br />
��������������<br />
����<br />
48 Chapter 2 <strong>Kinematics</strong> © Edvantage Interactive 2012 ISBN 978-0-9864778-3-6<br />
�����<br />
���<br />
��������������<br />
����<br />
Whenever the velocity of an object changes, the object experiences acceleration.<br />
Acceleration is a change in velocity over a period of time:<br />
acceleration = change in velocity<br />
change in time<br />
The symbol for acceleration is a. Velocity has the same symbol as speed, which is v.<br />
If the velocity at the start of the time interval is v 0 , and at the end of the time interval is v f ,<br />
then the change in velocity will be v f – v 0 . If the time at the beginning of the time interval<br />
is t 0 , and the time at the end of the time interval is t f , then the change in time, the time<br />
interval, is t f – t 0 . Using these symbols, acceleration can be defined as:<br />
a = v f – v 0<br />
t f – t 0<br />
or a = ∆v<br />
∆t<br />
where the ∆ symbol is shorthand for “change in” or “interval.”<br />
Since velocity has two aspects to it, both speed and direction, acceleration can<br />
occur under three conditions:<br />
(a) if speed changes,<br />
(b) if direction changes or<br />
(c) if both speed and direction change.<br />
The standard unit for expressing acceleration is m/s 2 . An object is accelerating at a<br />
rate of 1 m/s 2 if its speed is increasing at a rate of 1 m/s each second.
Sample Problem 2.2.1 — Calculating Acceleration<br />
A runner racing in a 100 m dash accelerates from rest to a speed of 9.0 m/s in 4.5 s. What was his average<br />
acceleration during this time interval?<br />
What to Think About<br />
1. Determine the correct formula.<br />
2. Solve for acceleration. Note that<br />
runner’s average acceleration was<br />
2.0 m/s/s, which is usually written<br />
2.0 m/s 2<br />
How to Do It<br />
a = ∆v<br />
∆t = v f – v 0<br />
t f – t 0<br />
= 9.0 m/s – 0 m/s<br />
4.5 s – 0 s<br />
a = 2.0 m/s2 Practice Problems 2.2.1 — Calculating Acceleration<br />
1. What is the average acceleration for the following?<br />
(a) A car speeds up from 0 km/h to 60.0 km/h in 3.00 s.<br />
(b) A runner accelerates from rest to 9.00 m/s in 3.00 s.<br />
The runner’s average acceleration was 2.0 m/s 2 .<br />
2. What is the average acceleration of a truck that accelerates from 45.0 km/h to 60.0 km/h in 7.50 s?<br />
3. A car travelling 120 km/h brakes hard to avoid hitting a deer on the road, slowing to 60 km/h in 4.0 s. What is<br />
its acceleration? Why is it negative?<br />
© Edvantage Interactive 2012 ISBN 978-0-9864778-3-6 Chapter 2 <strong>Kinematics</strong> 49
Negative<br />
Acceleration<br />
Graphing<br />
Acceleration<br />
���������������<br />
����<br />
����<br />
����<br />
����<br />
����<br />
����<br />
����<br />
����<br />
���������������<br />
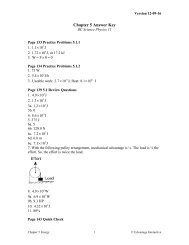
Sometimes you will find a situation where the acceleration is negative. You may think this<br />
implies that an object is slowing downing, but that is not always the case. Consider the<br />
situations shown in Figure 2.2.1.<br />
� �<br />
50 Chapter 2 <strong>Kinematics</strong> © Edvantage Interactive 2012 ISBN 978-0-9864778-3-6<br />
� �<br />
� � � �<br />
��� ��� ��� ���<br />
Figure 2.2.1 The vectors represent the velocity and acceleration of a car in different situations.<br />
In (a) and (b) the velocity of the car and the acceleration are in the same direction.<br />
This means the car is speeding up, even though the acceleration is negative in (b). In (c)<br />
and (d) the velocity and acceleration are in opposite directions and the car is slowing<br />
down. We can summarize that this way:<br />
When the velocity and acceleration are in the same direction, the object is speeding<br />
up, even if the acceleration is negative. When the velocity and acceleration are in<br />
opposite directions, the object is slowing down.<br />
In Figure 2.2.2, fictitious data is used to show how your results from Investigation 2-1<br />
might have been graphed. In this figure, the average speed of the cart is plotted on the<br />
y-axis, since it is the dependent variable. Time is on the x-axis, because it is the<br />
independent variable.<br />
Notice that in Figure 2.2.1 the speeds are plotted halfway through each time<br />
interval. For example, the average speed of <strong>11</strong> cm/s, which occurs in the first time interval<br />
of the sample tape, would be plotted at 0.05 s, not at 0.10 s. This is because the average<br />
speed during the interval will occur halfway through it, not at the end of the interval.<br />
This assumes, of course, that the speed is increasing at a constant rate and therefore<br />
acceleration is constant. The average speed for<br />
���������������������������������������<br />
�������������������<br />
���������������������<br />
�������������������<br />
�<br />
�<br />
�� ����� ����� ����� ����� ����� ����� ����� ����� ����� ����<br />
�����������<br />
Figure 2.2.1 An example of a graph showing acceleration<br />
�����<br />
�������������������������<br />
��������������<br />
� �<br />
each interval is the same as the instantaneous<br />
speed half way through the interval, if<br />
acceleration is constant.<br />
The graph you see in Figure 2.2.1 is, in fact,<br />
a graph of the instantaneous speed of the cart<br />
vs. time, although average speeds were used to<br />
obtain it. To write an equation describing the<br />
line in this graph, you need to know the<br />
y-intercept and the slope.<br />
� �
By inspection, the y-intercept, b, equals 7.0 cm/s. The slope m is found by using the<br />
points (0 s, 7.0 cm/s) and (0.80 s, 62 cm/s). Notice that the “rise” of the line is equal to the<br />
change in the speed of the cart, ∆v, and ∆v = v f – v 0 . The “run” of the graph is the change<br />
in time ∆t, and ∆t = t f – t 0 .<br />
slope = m = ∆v<br />
∆t = v f – v 0<br />
t f – t 0<br />
© Edvantage Interactive 2012 ISBN 978-0-9864778-3-6 Chapter 2 <strong>Kinematics</strong> 51<br />
= 62.0 cm/s – 7.0 cm/s<br />
0.80 s – 0 s<br />
= 55.0 cm/s<br />
0.80 s<br />
= 69 cm/s 2<br />
Notice that the slope has units of acceleration. This is because the slope of the<br />
speed-time graph is acceleration! Remember that acceleration is equal to the change in<br />
speed of the cart per second. The slope m = ∆v/∆t, which is the acceleration of the cart.<br />
The equation for the line in Figure 2.2.1 will have the same form as the general<br />
equation for a straight line, which is y = mx + b. When describing experimental results<br />
from a graph, however, we substitute the specific symbols for the variables used in the<br />
experiment. We also use the numerical values for the y-intercept and slope, complete<br />
with their measuring units. The equation for the line in Figure 2.2.1 is therefore<br />
where v is the speed of the cart at any time t.<br />
v = (69 cm/s 2 )t + 7.0 cm/s
2.2 Review Questions<br />
1. A policeman travelling 60 km/h spots a speeder<br />
ahead, so he accelerates his vehicle at a steady rate<br />
of 2.22 m/s 2 for 4.00 s, at which time he catches up<br />
with the speeder.<br />
(a) How fast was the policeman travelling in m/s?<br />
(b) How fast is the police car travelling after 4.00 s?<br />
Give your answer in both m/s and km/h.<br />
(c) If the speeder has a constant velocity, sketch the<br />
motion of both the speeder and police car on a<br />
speed vs. time graph below.<br />
2. A motorbike accelerates at a constant rate from a<br />
standing start. After 1.2 s, it is travelling 6.0 m/s. How<br />
much time will have elapsed (starting from rest)<br />
before the bike is moving with a speed of 15.0 m/s?<br />
3. The graph below shows lines representing speed<br />
vs. time for an accelerating aircraft, prepared by<br />
observers at two different locations on the runway.<br />
52 Chapter 2 <strong>Kinematics</strong> © Edvantage Interactive 2012 ISBN 978-0-9864778-3-6<br />
��������������<br />
����<br />
����<br />
����<br />
����<br />
����<br />
����<br />
����<br />
��������������<br />
��� ���<br />
�<br />
�<br />
�� ����� ����� ����� ����� ����� ����<br />
�����������<br />
(a) What is the equation for line (a)?<br />
(b) What is the equation for line (b)?<br />
(c) What is the acceleration of the aircraft according<br />
to line (a)?<br />
(d) What is the acceleration of the aircraft according<br />
to line (b)?<br />
(e) Explain why the y-intercept for line (b) is<br />
different than the intercept for line (a).
4. A racing motorbike’s final velocity is 38 m/s in 5.5 s<br />
with an acceleration of 6.0 m/s 2 . What was the initial<br />
velocity of the motorbike?<br />
5. While starting your car, which is a standard gearshift,<br />
you coast downhill getting to a speed of 2.0 m/s<br />
before the engine starts. You accelerate back<br />
uphill moving at 5.5 m/s. This takes a total of 3.0 s.<br />
If downhill is the positive direction, what is the<br />
average acceleration of your car?<br />
6. wo bugs are moving at a constant velocity of<br />
5.0 mm/s [west]. When t = 0 one bug is 10 m west<br />
of the origin and one bug is 10 m east. Sketch a<br />
velocity-time graph below, showing their motion for<br />
5.0 s.<br />
5. The graph below describes the motion of a vehicle<br />
whose acceleration changes twice. Find the<br />
acceleration of the vehicle for the parts of the graph<br />
labeled (a), (b) and (c), by finding the slope of each<br />
part of the graph.<br />
© Edvantage Interactive 2012 ISBN 978-0-9864778-3-6 Chapter 2 <strong>Kinematics</strong> 53<br />
��������������<br />
(a)<br />
(b)<br />
(c)<br />
��<br />
��<br />
��<br />
����������������������������������������<br />
���<br />
���<br />
���<br />
�<br />
�<br />
�� �� �� ��<br />
�����������<br />
�� ��
2.3 Uniform Acceleration<br />
Warm Up<br />
In your own words, describe the difference between average velocity, initial velocity, final velocity, and a change<br />
in velocity.<br />
Graphing<br />
Acceleration<br />
In a situation where the speed of a moving body increases or decreases at a uniform rate<br />
the acceleration is considered uniform. This motion can be graphed on a speed vs. time<br />
and will be linear (Figure 2.3.1). Since speed is the dependent variable, it is plotted on the<br />
y-axis. Time, the independent variable, will be on the x-axis.<br />
��������������<br />
� �<br />
� �<br />
�<br />
�<br />
����� ��<br />
��������������<br />
�����������<br />
54 Chapter 2 <strong>Kinematics</strong> © Edvantage Interactive 2012 ISBN 978-0-9864778-3-6<br />
����� ���<br />
Figure 2.3.1 This graph shows speed changing at a uniform rate.<br />
�<br />
� �����������������<br />
����������������������<br />
� ���������������<br />
The y-intercept for the speed-time graph is b = v0 , where v0 is the speed of the<br />
object at time t = 0. In Figure 2.3.1, the initial time is zero and the final time is t, so the<br />
time interval is simply ∆t = t – 0 = t.<br />
The slope of the graph is m = ∆v<br />
= a, since acceleration is change in speed divided<br />
∆t<br />
by change in time.<br />
If a = vf – v0 t<br />
Then at = vf – v0 and<br />
v f = v 0 + at<br />
This is a general equation for any object that accelerates at a uniform rate. It says<br />
that the final speed of the accelerating object equals the initial speed plus the change in<br />
speed (at).<br />
(1)
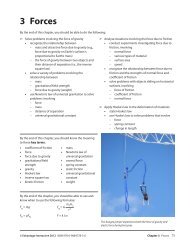
Sample Problem 2.3.1 — Determining Uniform Acceleration<br />
The graph below shows the uniform acceleration of an object, as it was allowed to drop off a cliff.<br />
(a) What was the acceleration of the object?<br />
(b) Write an equation for the graph.<br />
��������������<br />
����<br />
���<br />
���<br />
���<br />
���<br />
���<br />
���<br />
���<br />
���<br />
���<br />
��������������<br />
Δ�<br />
�<br />
� �� ����� ����� ����� ����� ����� ����� ����� ����� ����� �����<br />
�����������<br />
Δ�<br />
What to Think About<br />
(a)<br />
1. The acceleration is determined by finding the slope<br />
of the speed-time graph.<br />
(b)<br />
1. Determine the general equation for any straight<br />
line.<br />
2. For this line, the slope m is the acceleration.<br />
Inspection of the graph reveals that the y-intercept,<br />
b, is 2.0 m/s.<br />
3. Derive the specific equation for this line.<br />
Note that the final, specific equation for this graph<br />
includes the actual numerical values of the<br />
y-intercept and slope, complete with their<br />
measuring units. Once this equation is established,<br />
it can be used in place of the graph, since it<br />
describes every point on the graph.<br />
����������� ���������� How to Do It<br />
a = ∆v<br />
∆t =v f – v0 tf – t0 = 10.0 m/s – 2.0 m/s<br />
0.80 s – 0 s<br />
a = 1.0 × 101 m/s2 y = b + mx<br />
m = 1.0 × 10 1 m/s 2<br />
b = 2.0 m/s<br />
x = t<br />
y = v f<br />
= 8.0 m/s<br />
0.80 s<br />
v f = 2.0 m/s + (1.0 × 10 1 m/s 2 ).t<br />
© Edvantage Interactive 2012 ISBN 978-0-9864778-3-6 Chapter 2 <strong>Kinematics</strong> 55
Practice Problems 2.3.1 — Determining Uniform Acceleration<br />
��������������<br />
����<br />
����<br />
����<br />
����<br />
����<br />
����<br />
��������������<br />
�<br />
� �� ���� ���� ���� ���� ���� ���� ���� ���� ���� ������<br />
�����������<br />
1. (a) What is the y-intercept (v 0 ) for the graph shown above?<br />
(b) What is the slope of the graph?<br />
(c) What property of the moving object does this slope measure?<br />
(d) Write the specific equation for the graph, using symbols v for speed and t for time.<br />
2. The following equation describes the motion of a ball thrown straight down, by someone leaning out of the<br />
window of a tall building:<br />
v f = 5.0 m/s + (9.8 m/s 2 ) . t<br />
(a) At what speed was the ball initially thrown out of the window?<br />
(b) What was the acceleration of the ball?<br />
(c) How fast was the ball moving after 1.2 s?<br />
56 Chapter 2 <strong>Kinematics</strong> © Edvantage Interactive 2012 ISBN 978-0-9864778-3-6
Calculating Distance<br />
from Uniform<br />
Acceleration<br />
Consider an object that is accelerating uniformly from initial speed v 0 to a final speed v f<br />
in time t. as shown in Figure 2.3.2. How would you calculate the distance travelled by the<br />
object during this time?<br />
��������������<br />
����� ��<br />
��������������<br />
�����������<br />
© Edvantage Interactive 2012 ISBN 978-0-9864778-3-6 Chapter 2 <strong>Kinematics</strong> 57<br />
����� ���<br />
� �����������������<br />
���������������������<br />
� � ��������������<br />
Figure 2.3.2 This graph represents an object accelerating at a uniform rate.<br />
The total distance d travelled in time t will equal the average speed v – multiplied by<br />
time t. The average speed v – is just the average of the initial speed v 0 and the final speed<br />
v f , which is:<br />
v – = v 0 + v f<br />
2<br />
Distance travelled is d = v – or d = v0 + vf 2<br />
• t (2)<br />
However, it has already been shown that vf = v0 + at (1)<br />
Therefore, d = v0 + v0 + at<br />
2<br />
and d = 2v0 + at<br />
2<br />
Finally,<br />
d = v 0 t + 1<br />
2 at2<br />
• t<br />
• t = 2v0 + at2<br />
2<br />
Sometimes you encounter situations involving uniform acceleration where you<br />
have no information about the time interval, t, during which the motion occurred. If<br />
you know the initial speed v 0 and the final speed v f , you can still calculate the distance<br />
travelled if you know at what rate the object is accelerating.<br />
For uniform acceleration, d = v 0 + v f<br />
2<br />
Therefore, t = v f – v 0<br />
a<br />
Substituting for t in the first equation, d = v 0 + v f<br />
2<br />
Thus, 2ad = v 2 f = – v2 0<br />
Therefore,<br />
v2 f = –v2 0 + 2ad<br />
(3)<br />
• t, and v f = v 0 + at<br />
• v f – v 0<br />
a<br />
(4)
The Four Uniform<br />
Acceleration<br />
Equations<br />
Quick Check<br />
Four equations describing uniform acceleration were introduced above. These four<br />
equations are extremely useful in this course and in future courses you might take in<br />
physics. For your convenience, they are summarized here:<br />
(1) v f = v 0 + at<br />
(2) d = v0 + vf • t<br />
2<br />
(3) d = v0t + 1<br />
2 at2<br />
(4) v2 f = v2 0 + 2ad<br />
1. What is the initial velocity of a car accelerating east at 3.0 m/s 2 for 5.0 s and reaching a final velocity of<br />
25.0 m/s east?<br />
2. If we assume acceleration is uniform, how far does a plane travel when it lands at 16.0 m/s west and comes to<br />
rest in 8.0 s?<br />
3. What is the stopping distance of a car if it accelerates at –9.29 m/s 2 and has an initial velocity of 100 km/h.<br />
58 Chapter 2 <strong>Kinematics</strong> © Edvantage Interactive 2012 ISBN 978-0-9864778-3-6
Investigation 2-3 Measuring Acceleration<br />
Purpose<br />
To measure the uniform acceleration of an object<br />
Part 1<br />
Procedure<br />
1. Figure 2.3.3 shows one way to produce uniformly accelerated motion. (Your teacher may have a different<br />
method and will explain it to you.) Remove a 1-m piece of ticker tape from a roll. Pass the tape through a<br />
recording timer and tape it to a laboratory cart, as shown in the diagram. A 500 g mass is attached to the cart by<br />
a 1 m string that passes over a pulley. The force of gravity on the mass accelerates both the mass and the cart.<br />
2. For best results in this experiment, there should be no slack in the ticker tape before the cart is released. One<br />
partner should place the hanging mass over the pulley, and hold onto the cart so that it does not accelerate<br />
prematurely. When all is ready, simultaneously turn on the timer and release the cart.<br />
�����<br />
����<br />
���������<br />
��������<br />
��������<br />
Figure 2.3.3 Apparatus setup for Part 1<br />
������������ �����������<br />
����������<br />
����<br />
3. Your finished ticker tape record will look something like the one in Figure 2.3.4. Often there is a smudged<br />
grouping of dots at the start, so choose the first clear dot and label it the “0th” dot (Figure 2.3.4). On your<br />
tape, mark clearly the 0th dot, 6th dot, 12th dot, 18th dot, 24th dot, and so on until you have at least six time<br />
intervals. The timer has a frequency of 60 Hz. This means it makes 60 vibrations each second. The time interval<br />
between dots on your tape is 1/60 s. If you use a time interval of six dots, this is 6/60 s or 1/10 s. In other words,<br />
an interval of six dots is the same as 0.10 s.<br />
������� ������� �������� ���������<br />
���� ������ ������ ������<br />
� � � � � �<br />
Figure 2.3.4 The beginning of the tape may have a smudged group of dots.<br />
© Edvantage Interactive 2012 ISBN 978-0-9864778-3-6 Chapter 2 <strong>Kinematics</strong> 59
4. Carefully measure the distance the cart travelled during each successive 0.10 s time interval. For example, in the<br />
sample tape in Figure 2.3.4, the distance travelled during the interval between 0 and 0.10 s was 1.1 cm.<br />
Figure 2.3.5 shows how to measure the distance travelled during the second 0.10 s interval between 0.10 s and<br />
0.20 s. In the sample tape, the distance is 1.8 cm. Prepare a table like Table 2.3.1. Record the distances travelled<br />
in each of the recorded intervals in your table.<br />
������� ������� �������� ���������<br />
���� ������ ������ ������<br />
� � � � � � �<br />
Figure 2.3.5 How to measure the distance between 0.10 s and 0.20 s<br />
Table 2.3.1 Data for an Accelerating Cart<br />
Time Interval<br />
(s)<br />
0 to 0.10<br />
0.10 to 0.20<br />
0.20 to 0.30<br />
0.30 to 0.40<br />
0.40 to 0.50<br />
0.50 to 0.60<br />
Distance Travelled<br />
(cm)<br />
Average Speed for the<br />
Interval (cm/s)<br />
5. Your next task is to figure out the average speed of the cart during each of the 0.10 s time intervals. Since<br />
average speed is just the distance travelled during the time interval divided by the time interval, all you have<br />
to do is divide each measured distance by the time interval (0.10 s). During the first time interval on the sample<br />
tape, the cart moved a distance of 1.1 cm. The average speed of the cart during the first 0.10 s was therefore<br />
v – =<br />
1.1 cm<br />
0.10 s<br />
= <strong>11</strong> cm/s<br />
During the second time interval (between 0.10 s and 0.20 s), the cart moved a distance of 1.8 cm. Its average<br />
speed during the second interval was therefore<br />
v – 1.8 cm<br />
= = 18 cm/s<br />
0.10 s<br />
6. Using your own tape data, calculate the average speed of the cart during each of the time intervals and<br />
complete Table 2.3.1.<br />
60 Chapter 2 <strong>Kinematics</strong> © Edvantage Interactive 2012 ISBN 978-0-9864778-3-6
Concluding Questions<br />
1. (a) What was the average speed of the cart during the first 0.10 s time interval?<br />
(b) What was the average speed of the cart during the second 0.10 s interval?<br />
(c) By how much did the average speed of the cart increase between the first interval and the second interval?<br />
(d) Calculate the acceleration of the cart between the first interval and the second interval by dividing the<br />
increase in average speed by the time interval, which was 0.10 s.<br />
Example: On the sample tape, the average speed increased from <strong>11</strong> cm/s to 18 cm/s between the<br />
first and second time intervals. Therefore, the acceleration was:<br />
a =<br />
18 cm/s – <strong>11</strong> cm/s<br />
0.10 s<br />
© Edvantage Interactive 2012 ISBN 978-0-9864778-3-6 Chapter 2 <strong>Kinematics</strong> 61<br />
= 7 cm/s<br />
0.10 s<br />
= 70 cm/s2<br />
2. Calculate the acceleration of the cart between the second and third intervals, third and fourth intervals, fourth<br />
and fifth intervals, and fifth and sixth intervals. Allowing for slight variations due to experimental errors, is there<br />
any pattern to your results?<br />
Part 2<br />
Procedure<br />
1. Using your data table from Investigation 2-1 (Table 2.1.1), plot a graph of speed vs. time for the accelerating<br />
cart, like the example shown below in Figure 2.3.6. Remember that the speeds in the table are average speeds<br />
for each interval and should be plotted midway through each time interval.<br />
����<br />
����<br />
����<br />
����<br />
����<br />
����<br />
����<br />
��� ���<br />
�<br />
�<br />
�� ����� ����� ����� ����� ����� ����<br />
�����������<br />
Figure 2.3.6 This is an example of a speed-time graph like the one<br />
you will draw.<br />
��������������<br />
��������������<br />
2. Draw a single straight line through all the plotted points. If there are stray points due to experimental error, try<br />
to draw a line that leaves as many strays on one side of it as on the other. If a point is an obvious gross error,<br />
ignore it when drawing your “best-fit line.” If in doubt, ask your teacher for advice.<br />
3. Determine the y-intercept of your line. Also, figure out the slope of the line using the method outlined for<br />
Figure 2.2.1 in section 2.2.<br />
Concluding Questions<br />
1. What was the acceleration of your cart according to the slope of your graph?<br />
2. What is the equation for the speed-time graph you plotted for the cart?<br />
3. In Investigation 2-1, you figured out the acceleration of your cart simply by comparing average speeds of<br />
the cart in successive time intervals. Compare the acceleration you calculated in Investigation 2-1 with the<br />
acceleration you just obtained using the slope of your speed-time graph. Which method of finding the<br />
acceleration “averages out” the experimental errors better? Explain.
2.3 Review Questions<br />
1. Use the following graph to answer the questions<br />
below.<br />
��������������<br />
���<br />
���<br />
���<br />
���<br />
���<br />
���<br />
��������������<br />
�<br />
� �� ����� ����� ����� ����� ����� ����� ����� ����<br />
�����������<br />
(a) What is the y-intercept (v 0 ) of the speed-time<br />
graph shown above?<br />
(b) What is the acceleration of the moving object?<br />
(c) What is the specific equation for this graph?<br />
2. A cyclist coasting along a road allows her bike to<br />
come to rest with the help of a slight upslope in<br />
the road. The motion of the bike is described by the<br />
equation:<br />
v f = 6.6 m/s – (2.2 m/s 2 )• t<br />
(a) What was the initial speed of the bike?<br />
(b) At what rate did the bike accelerate while<br />
coming to rest?<br />
(c) How long did the bike take to come to rest?<br />
3. What is the rate of acceleration of a mountain bike,<br />
if it slows down from 12.0 m/s to 8.0 m/s in a time of<br />
3.25 s?<br />
4. A truck parked on a down slope slips its brakes and<br />
starts to coast downhill, accelerating from rest at a<br />
constant rate of 0.80 m/s 2 .<br />
(a) How fast will the truck be moving after 5.0 s?<br />
(b) How far will the truck coast during the 5.0 s?<br />
62 Chapter 2 <strong>Kinematics</strong> © Edvantage Interactive 2012 ISBN 978-0-9864778-3-6
5. An aircraft starts from rest and accelerates at a<br />
constant rate down the runway.<br />
(a) After 12.0 s, its speed is 36.0 m/s. What is its<br />
acceleration?<br />
(b) How fast is the plane moving after 15.0 s?<br />
(c) How far down the runway will the plane be after<br />
15.0 s?<br />
6. A truck is moving along at 80.0 km/h when it hits<br />
a gravel patch, which causes it to accelerate at<br />
–5.0 km/h/s. How far will the truck travel before it<br />
slows to 20.0 km/h?<br />
7. A very frustrated physics student drops a physics<br />
textbook off the top of the CN tower. If the tower<br />
is 5.3 × 10 2 m high, how long will the book take<br />
to reach the ground, assuming there is no air<br />
resistance?<br />
8. If an electron accelerates in a space of 5.0 cm<br />
from rest to 1/10 c, (where c is the speed of light,<br />
3.0 × 10 8 m/s), what is its acceleration?<br />
© Edvantage Interactive 2012 ISBN 978-0-9864778-3-6 Chapter 2 <strong>Kinematics</strong> 63
2.4 Acceleration of Bodies Due to Gravity<br />
Warm Up<br />
Take a piece of paper and book in each hand and raise them to about the height of your shoulder. Predict which<br />
one will hit the ground first if they are both dropped at the same time. Drop both and record results. Now<br />
crumple the same piece of paper and repeat. Describe and suggest reasons for any differences between the two<br />
events.<br />
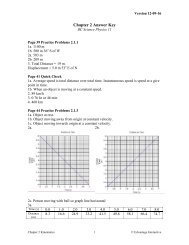
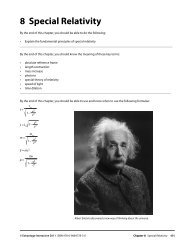
Free Fall<br />
Figure 2.4.1 These sky divers are in free fall until they<br />
open their parachutes to slow their descent.<br />
One of the most common situations involving uniform acceleration is the phenomenon<br />
known as free fall. For example, if a coin drops out of your pocket, it accelerates toward<br />
the ground. If the effects of air resistance are ignored, the acceleration of the coin toward<br />
the ground is uniform. The coin starts its downward fall with zero speed, but gains<br />
speed as it falls toward Earth. Since gravity is the cause of the acceleration, we call the<br />
acceleration during free fall the acceleration of gravity. The acceleration of gravity is<br />
given a special symbol, g.<br />
The magnitude of g depends on your location. At Earth’s<br />
surface, g is approximately 9.81 m/s 2 . At higher altitudes,<br />
g decreases. For our present purposes, g is assumed to be<br />
constant at Earth’s surface and to be 9.81 m/s 2 . On the Moon,<br />
the magnitude of g is approximately 1/6 of what it is here on<br />
Earth’s surface. A body in free fall near the Moon’s surface has<br />
an acceleration of gravity of only 1.60 m/s 2 .<br />
Of course, the four equations for uniform acceleration<br />
apply to free fall as well as other uniform acceleration<br />
situations. The symbol g may be substituted for a in those<br />
equations.<br />
64 Chapter 2 <strong>Kinematics</strong> © Edvantage Interactive 2012 ISBN 978-0-9864778-3-6
Sample Problem 2.4.1 — Free Fall<br />
A golf ball is dropped from the top of the CN tower. Assuming that the ball is in true free fall (negligible air<br />
resistance), answer these questions:<br />
(a) How fast will the ball be falling after 1.0 s?<br />
(b) How far down will the ball have fallen after 1.0 s?<br />
What to Think About<br />
(a)<br />
1. Determine initial conditions in the<br />
problem so you can choose the correct<br />
formula.<br />
2. Determine which formula to use.<br />
3. Solve.<br />
(b)<br />
1. Determine which formula to use.<br />
2. Solve.<br />
How to Do It<br />
The ball starts from rest, so v 0 = 0.0 m/s<br />
The rate of acceleration is g = 9.8 m/s 2<br />
The time of fall is t = 1.0 s<br />
The first uniform acceleration equation (1) applies to<br />
this question.<br />
v f = v 0 + at<br />
v f = 0 m/s + (9.8 m/s 2 )(1.0 s)<br />
v f = 9.8 m/s<br />
The ball will be falling 9.8 m/s after 1 s.<br />
The third uniform acceleration equation (3) applies<br />
to this question.<br />
d = v 0 t + 1 2 at2<br />
d = (0 m/s)(1.0 s) + 1 2 (9.8 m/s2 )(1.0 s)(1.0 s)<br />
d = 4.9 m<br />
The ball will have fallen 4.9 m after 1 s.<br />
Practice Problems 2.4.1 — Free Fall<br />
1. (a) How fast will the golf ball in the Sample Problem be moving after it has fallen a distance of 530 m,<br />
which is the height of the CN tower? (Assume free fall.)<br />
(b) Why does the ball not reach this speed when it hits the ground?<br />
© Edvantage Interactive 2012 ISBN 978-0-9864778-3-6 Chapter 2 <strong>Kinematics</strong> 65
Practice Problems 2.4.1 — Free Fall<br />
2. How high is the cliff if you toss a small rock off of it with an initial speed of 5.0 m/s and the rock takes 3.1 s<br />
to reach the water?<br />
3. (a) At the Pacific National Exhibition in Vancouver, one of the amusement park rides drops a person in free<br />
fall for 1.9 s. What will be the final velocity of the rider at the end of this ride?<br />
(b) What is the height of this ride?<br />
4. At an air show, a jet car accelerates from rest at a rate of 3g, where g is 9.81 m/s 2 . How far does the jet car<br />
travel down the runway in a time of 4.0 s?<br />
Projectiles<br />
There are different types of projectile motion. From throwing a ball up and having it land<br />
on your hand to a golf ball being hit off a tee to throwing a rock off a cliff. The golf ball<br />
and rock examples require analysis of motion using two dimensions and will be studied in<br />
later courses. The example of throwing a ball up in the air and having it land back in your<br />
hand is an example of projectile motion in one dimension. This type of projectile motion<br />
will be studied next.<br />
Recall that acceleration is a vector quantity with both magnitude and direction.<br />
In situations where the acceleration is caused by the force of gravity, the direction of<br />
acceleration is downward. This is a negative direction. In gravitational acceleration<br />
problems, therefore, you use a = − 9.81 m/s 2 .<br />
If a body is thrown into the air, it accelerates downward (a = − 9.81 m/s 2 ) at all times<br />
during the trajectory, whether the velocity is upward (+), zero, or downward (−).<br />
You throw a baseball straight up. It leaves your hand with an initial velocity of<br />
10.0 m/s. Figure 2.4.2 is a graph showing how the velocity of the ball varies with time,<br />
starting when you begin to throw the ball and ending when you finish catching it. At A,<br />
the ball has just left your hand. At C, the ball has just reached the glove in which you will<br />
catch the ball. Notice that between A and C, the velocity is changing at a uniform rate. If<br />
you take the slope of this graph, you will obtain the acceleration of the ball due to gravity<br />
alone.<br />
66 Chapter 2 <strong>Kinematics</strong> © Edvantage Interactive 2012 ISBN 978-0-9864778-3-6
Quick Check<br />
�����������������<br />
����<br />
�������������������������������������������������<br />
������������<br />
���<br />
���<br />
���<br />
���<br />
���<br />
���<br />
���<br />
���<br />
���<br />
�<br />
� ��<br />
����<br />
����<br />
����<br />
����<br />
����<br />
����<br />
����<br />
����<br />
����<br />
�����<br />
�<br />
���� ���� ����<br />
� �<br />
���� ���� ���� ���� ���� ���� ���� ���� ���<br />
�������������<br />
�����������<br />
Figure 2.4.2 This graph represents the velocity of a ball as a function of<br />
time, when you throw a ball straight up in the air.<br />
1. In Figure 2.4.2, what was the acceleration of the ball<br />
(a) while it was being thrown?<br />
(b) while it was in free fall?<br />
(c) while it was being caught?<br />
2. What point on the graph corresponds with the instant when the ball reached the “peak” of its flight? Explain<br />
how you know this.<br />
3. What altitude did the ball reach? Hint: The distance the ball travels equals the average speed multiplied by<br />
the time elapsed when it reaches its “peak” altitude. What property of the graph would give you d = v _ • t?<br />
© Edvantage Interactive 2012 ISBN 978-0-9864778-3-6 Chapter 2 <strong>Kinematics</strong> 67
2.4 Review Questions<br />
1. On a certain asteroid, a steel ball drops a distance<br />
of 0.80 m in 2.00 s from rest. Assuming uniform<br />
acceleration due to gravity on this asteroid, what is<br />
the value of g on the asteroid?<br />
2. The graph below represents the velocity of a ball<br />
thrown straight up by a strong pitcher as a function<br />
of time. In the first part of the graph ending at<br />
A, the ball is accelerated to 39.2 m/s in a time of<br />
0.20 s. After the ball leaves the pitcher’s hand, it<br />
experiences only the acceleration due to gravity<br />
until it is caught in a glove and brought to rest in the<br />
hand of the catcher.<br />
�����������������<br />
�����������������������������������������������<br />
�������������������<br />
��<br />
��<br />
��<br />
��<br />
�����������������<br />
�<br />
����<br />
���<br />
���<br />
���<br />
����������������������<br />
� �� ���� ���� ���� ���� ���� ���� ���� ���� ���� ����<br />
�����������<br />
�����������������<br />
(a) What is the acceleration of the ball while it is<br />
being thrown?<br />
(b) What is the acceleration of the ball after it leaves<br />
the pitcher’s hand? (A<strong>BC</strong>)<br />
(c) What is the acceleration of the ball while it is<br />
being caught? (CD)<br />
(d) What point on the graph (A, B, C, or D)<br />
corresponds with the instant when the ball is at<br />
the peak of its flight? Explain your answer.<br />
(e) Why is the slope of the graph negative as soon<br />
as the ball leaves the pitcher’s hand?<br />
(f) Why is the graph labelled velocity rather than<br />
speed?<br />
(g) How far up did the ball travel?<br />
(h) How far down did the ball fall?<br />
(i) What is the average velocity of the ball for the<br />
whole trip from pitcher’s hand to catcher’s<br />
hand?<br />
3. A body in free fall accelerates at a rate of 9.81 m/s 2 at<br />
your latitude. How far does the body fall during<br />
(a) the first second? (b) the second second? (Think<br />
first!)<br />
68 Chapter 2 <strong>Kinematics</strong> © Edvantage Interactive 2012 ISBN 978-0-9864778-3-6
Chapter 2 Review Questions<br />
1. What is the difference between velocity and speed?<br />
2. A traveller drives 568 km in 7.2 h. What is the<br />
average speed for the trip?<br />
3. The following distances and times, for consecutive<br />
parts of a trip made by a red ant, were recorded by<br />
different observers. There is considerable variation<br />
in the precision of their measurements.<br />
A. 4.56 m in 12 s B. 3.4 m in 6.89 s<br />
C. 12.8 m in 36.235 s<br />
(a) What total distance did the ant travel?<br />
(b) What was the total time for the trip?<br />
(c) What was the average speed of the ant?<br />
4. Light travels with a speed of 3.00 × 10 5 km/s. How<br />
long will it take light from a laser to travel to the<br />
Moon (where it is reflected by a mirror) and back to<br />
Earth? The Moon is 3.84 × 10 5 km from Earth.<br />
5. Under what condition can acceleration be<br />
calculated simply by dividing change in speed by<br />
change in time?<br />
6. A high-powered racing car accelerates from rest at a<br />
rate of 7.0 m/s 2 . How fast will it be moving after<br />
10.0 s? Convert this speed to km/h.<br />
© Edvantage Interactive 2012 ISBN 978-0-9864778-3-6 Chapter 2 <strong>Kinematics</strong> 69
7. The graph below is a speed-time graph for a vehicle.<br />
��������������<br />
����<br />
����<br />
����<br />
����<br />
����<br />
����<br />
��������������<br />
�<br />
� �� ���� ���� ���� ���� ���<br />
�����������<br />
(a) What was the acceleration of the vehicle?<br />
(b) What was the average speed of the vehicle<br />
during its 5.00 s trip?<br />
(c) What distance did the vehicle travel during the<br />
5.00 s?<br />
(d) Write a specific equation for this graph.<br />
8. A child on a toboggan slides down a snowy hill,<br />
accelerating uniformly at 2.8 m/s 2 . When the<br />
toboggan passes the first observer, it is travelling<br />
with a speed of 1.4 m/s. How fast will it be moving<br />
when it passes a second observer, who is 2.5 m<br />
downhill from the first observer?<br />
9. A space vehicle is orbiting the Earth at a speed of<br />
7.58 × 10 3 m/s. In preparation for a return to Earth,<br />
it fires retrorockets, which provide a negative<br />
acceleration of 78.4 m/s 2 . Ignoring any change in<br />
altitude that might occur, how long will it take the<br />
vehicle to slow down to 1.52 × 10 3 m/s?<br />
10. Snoopy is taking off in his World War I biplane. He<br />
coasts down the runway at a speed of 40.0 m/s, then<br />
accelerates for 5.2 s at a rate of 1/2 g, where g is the<br />
acceleration due to gravity (9.81 m/s 2 ). How fast is<br />
the plane moving after 5.2 s?<br />
70 Chapter 2 <strong>Kinematics</strong> © Edvantage Interactive 2012 ISBN 978-0-9864778-3-6
<strong>11</strong>. A woman biker (leader of the local chapter of Heck’s<br />
Angels) is driving along the highway at 80.0 km/h, in<br />
a 60.0 km/h speed zone. She sees a police car ahead,<br />
so she brakes and her bike accelerates at<br />
–8.0 km/h/s. How far along the road will she travel<br />
before she is at the legal speed limit?<br />
12. Spiderman is crawling up a building at the rate of<br />
0.50 m/s. Seeing Spiderwoman 56 m ahead of him,<br />
he accelerates at the rate of 2.3 m/s 2 .<br />
(a) How fast will he be moving when he reaches<br />
Spiderwoman?<br />
(b) How much time will he take to reach<br />
Spiderwoman?<br />
(c) When he reaches Spiderwoman, Spiderman<br />
discovers that she is a Black Widow and, as you<br />
know, Black Widows consume their mates! He<br />
is 200.00 m from the road below. How long will<br />
it take him to fall to the safety of the road, if he<br />
drops with an acceleration of g = 9.81 m/s 2 ?<br />
13. A stone is dropped from the top of a tall building. It<br />
accelerates at a rate of 9.81 m/s 2 . How long will the<br />
stone take to pass a window that is 2.0 m high, if the<br />
top of the window is 20.0 m below the point from<br />
which the stone was dropped?<br />
14. An aircraft, preparing for take-off, accelerates<br />
uniformly from 0 m/s to 20.0 m/s in a time of 5.00 s.<br />
(a) What is the acceleration of the aircraft?<br />
(b) How long will the plane take to reach its take-off<br />
speed of 36.0 m/s?<br />
© Edvantage Interactive 2012 ISBN 978-0-9864778-3-6 Chapter 2 <strong>Kinematics</strong> 71
15. At an air show, a jet car accelerates from rest at a<br />
rate of 3g, where g is 9.81 m/s 2 . How fast is the jet<br />
travelling after 0.25 km?<br />
16. To start a soccer game, the referee flips a coin that<br />
travels 50 cm into the air.<br />
(a) What was the coin’s initial speed?<br />
(b) How long was the coin in the air before landing<br />
back in the hand of the referee?<br />
17. A glider on an air track is made to accelerate<br />
uniformly by tilting the track at a slight angle. The<br />
distance travelled by the glider was measured at the<br />
end of each 0.10 s interval, resulting in the following<br />
data:<br />
DISTANCE d (cm) 0 0.025 0.100 0.225 0.400 0.625<br />
TIME t (s) 0 0.100 0.200 0.300 0.400 0.500<br />
(a) Plot a graph with distance d on the y-axis and<br />
time t on the x-axis.<br />
(b) Plot a second graph with distance d on the y-axis<br />
and t 2 on the x-axis.<br />
(c) Use the slope of your second graph to figure out<br />
the acceleration of the glider on the air track.<br />
HINT: Think about the third equation for uniform<br />
acceleration.<br />
72 Chapter 2 <strong>Kinematics</strong> © Edvantage Interactive 2012 ISBN 978-0-9864778-3-6
Chapter 2 Extra Practice<br />
1. The speed of light in space is 300 000 km/s. How far<br />
does light travel in:<br />
(a) 1 min?<br />
(b) 1 h?<br />
(c) 1 d?<br />
(d) 1 y?<br />
2. A jet aircraft travels a distance of 1867 km in a time<br />
of 3.0 h. What is its average speed for the trip?<br />
3. In a certain battery-powered circuit, an electron<br />
requires 2.0 × 10 5 s to travel only 2.0 m. What is the<br />
average speed of the electron in the circuit? Express<br />
your answer in millimetres per second (mm/s).<br />
4. Light from a laser requires 1.28 s to reach the Moon.<br />
If light travels with a speed of 3.00 × 10 5 km/s, how<br />
far is it to the Moon?<br />
5. A tourist averaged 82 km/h for a 6.5 h trip in her car.<br />
How far did she go?<br />
6. Use the following graph to answer the questions<br />
below.<br />
��������������<br />
����<br />
����<br />
����<br />
����<br />
���<br />
���<br />
���<br />
���<br />
��������������<br />
�<br />
� �� ���� ���� ���� ���� ����� ���� ���� ���� ���� ����� ���������<br />
�����������<br />
(a) What is the y-intercept of the above graph?<br />
(Include units.)<br />
(b) What is the slope of the above graph? (Include<br />
units.)<br />
(c) What is the equation for the above graph?<br />
(Use symbols v and t in the equation.)<br />
7. A certain airplane has an acceleration of 15.0 m/s 2 .<br />
(a) How fast will it be moving 2.5 s after it starts<br />
down the runway?<br />
(b) How far will it travel during the 2.5 s?<br />
(c) Minimum take-off speed is 60.0 m/s. What<br />
length must the runway be?<br />
8. (a) You are driving along the road at 80 km/h<br />
(22 m/s) when you see a moose 50.0 m in front<br />
of your car. Your reaction time is 0.40 s, and when<br />
you finally hit the brakes, your car accelerates at<br />
a rate of –6.4 m/s 2 . Will your car stop in time to<br />
avoid the moose?<br />
(b) If the road is wet and your car accelerates at a<br />
rate of just –4.8 m/s 2 , what will happen? Show<br />
your calculations.<br />
9. The CN Tower in Toronto is about 530 m high. If air<br />
friction did not slow it down, how long would it<br />
take a penny to fall from the top of the tower to the<br />
ground below? (g = 9.81 m/s 2 )<br />
10. A motocross rider is coasting at a speed of 2.00 m/s.<br />
He then decides to accelerate his bike at a rate of<br />
3.00 m/s 2 for a distance of 100.0 m.<br />
(a) How fast is the bike moving, in m/s, at the end of<br />
the 100.0 m stretch?<br />
(b) Convert your answer from m/s to km/h.<br />
<strong>11</strong>. A mountain bike rider, after coming down a steep<br />
hill, loses control of her bike while moving with a<br />
speed of 5.00 m/s. Fortunately, she collides with a<br />
haystack, which brings her to rest in a distance of<br />
0.625 m. What was the acceleration of the bike and<br />
rider while colliding with the haystack?<br />
12. A policeman on a mountain bike is cruising at a<br />
speed of 4.00 m/s, when he sees a wanted criminal<br />
standing on a corner, 100.0 m ahead of him. If the<br />
policeman accelerates at a rate of 2.00 m/s 2 , how<br />
much time will he take to reach the corner?<br />
© Edvantage Interactive 2012 ISBN 978-0-9864778-3-6 Chapter 2 <strong>Kinematics</strong> 73
13. The graph below shows how the speed of an aging<br />
physics teacher varies with time, as he tries to run<br />
up a hill.<br />
��������������<br />
���<br />
���<br />
���<br />
���<br />
��������������<br />
�<br />
� �� ���� ���� ���� ���� ����� ���� ���� ���� ���� ����� ���������� ���������<br />
�����������<br />
(a) What was the starting speed of the runner?<br />
(b) What was the acceleration of the runner?<br />
(c) What distance did the runner travel?<br />
(d) What is the specific equation for the graph?<br />
14. Equation 4 for uniform acceleration, v2 f = v2 0 + 2ad, can<br />
be used to show that a body thrown upward with a<br />
speed v will return to the same level with the same<br />
speed it had when it was thrown upward.<br />
(a) Show mathematically why the magnitude of vf equals the magnitude of v0 .<br />
(b) Will the ball have the same velocity when it<br />
comes down as when it was thrown up in the<br />
air? Explain your answer.<br />
15. A skateboarder accelerates uniformly down a hill,<br />
starting from rest. During the third 1 s interval from<br />
rest, the skateboarder travels 7.5 m. What is the<br />
acceleration of the skateboarder?<br />
74 Chapter 2 <strong>Kinematics</strong> © Edvantage Interactive 2012 ISBN 978-0-9864778-3-6