Getting Started in Logit and Ordered Logit Regression - Data and ...
Getting Started in Logit and Ordered Logit Regression - Data and ...
Getting Started in Logit and Ordered Logit Regression - Data and ...

Create successful ePaper yourself
Turn your PDF publications into a flip-book with our unique Google optimized e-Paper software.
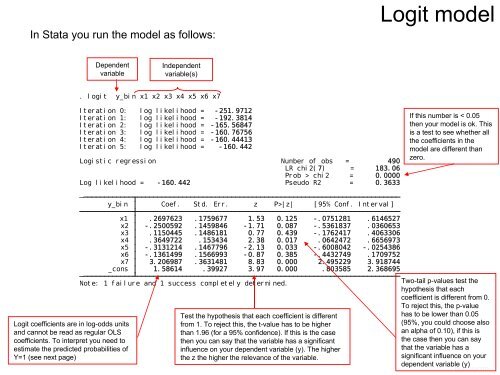
In Stata you run the model as follows:<br />
Dependent<br />
variable<br />
<strong>Logit</strong> coefficients are <strong>in</strong> log-odds units<br />
<strong>and</strong> cannot be read as regular OLS<br />
coefficients. To <strong>in</strong>terpret you need to<br />
estimate the predicted probabilities of<br />
Y=1 (see next page)<br />
Independent<br />
variable(s)<br />
. logit y_b<strong>in</strong> x1 x2 x3 x4 x5 x6 x7<br />
Iteration 0: log likelihood = -251.9712<br />
Iteration 1: log likelihood = -192.3814<br />
Iteration 2: log likelihood = -165.56847<br />
Iteration 3: log likelihood = -160.76756<br />
Iteration 4: log likelihood = -160.44413<br />
Iteration 5: log likelihood = -160.442<br />
Logistic regression Number of obs = 490<br />
LR chi2(7) = 183.06<br />
Prob > chi2 = 0.0000<br />
Log likelihood = -160.442 Pseudo R2 = 0.3633<br />
y_b<strong>in</strong> Coef. Std. Err. z P>|z| [95% Conf. Interval]<br />
x1 .2697623 .1759677 1.53 0.125 -.0751281 .6146527<br />
x2 -.2500592 .1459846 -1.71 0.087 -.5361837 .0360653<br />
x3 .1150445 .1486181 0.77 0.439 -.1762417 .4063306<br />
x4 .3649722 .153434 2.38 0.017 .0642472 .6656973<br />
x5 -.3131214 .1467796 -2.13 0.033 -.6008042 -.0254386<br />
x6 -.1361499 .1566993 -0.87 0.385 -.4432749 .1709752<br />
x7 3.206987 .3631481 8.83 0.000 2.495229 3.918744<br />
_cons 1.58614 .39927 3.97 0.000 .803585 2.368695<br />
Note: 1 failure <strong>and</strong> 1 success completely determ<strong>in</strong>ed.<br />
Test the hypothesis that each coefficient is different<br />
from 1. To reject this, the t-value has to be higher<br />
than 1.96 (for a 95% confidence). If this is the case<br />
then you can say that the variable has a significant<br />
<strong>in</strong>fluence on your dependent variable (y). The higher<br />
the z the higher the relevance of the variable.<br />
<strong>Logit</strong><br />
model<br />
If this number is < 0.05<br />
then your model is ok. This<br />
is a test to see whether all<br />
the coefficients <strong>in</strong> the<br />
model are different than<br />
zero.<br />
Two-tail p-values test the<br />
hypothesis that each<br />
coefficient is different from 0.<br />
To reject this, the p-value<br />
has to be lower than 0.05<br />
(95%, you could choose also<br />
an alpha of 0.10), if this is<br />
the case then you can say<br />
that the variable has a<br />
significant <strong>in</strong>fluence on your<br />
dependent variable (y)<br />
PU/DSS/OTR