A SHORT COURSE IN THE MODELING OF CHEMOTAXIS
A SHORT COURSE IN THE MODELING OF CHEMOTAXIS
A SHORT COURSE IN THE MODELING OF CHEMOTAXIS
SHOW LESS

Create successful ePaper yourself
Turn your PDF publications into a flip-book with our unique Google optimized e-Paper software.
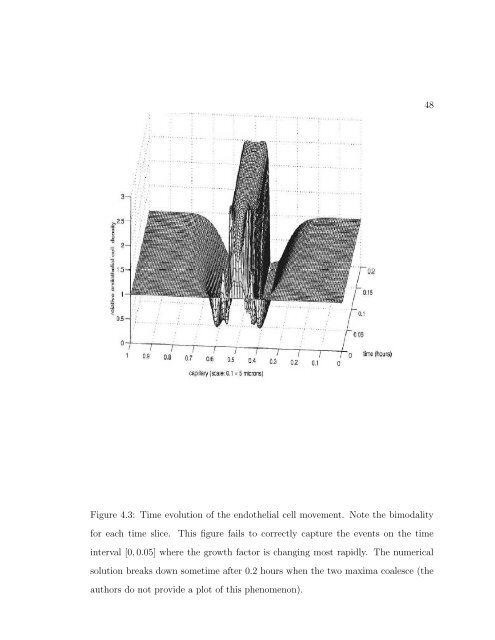
Figure 4.3: Time evolution of the endothelial cell movement. Note the bimodality<br />
for each time slice. This figure fails to correctly capture the events on the time<br />
interval [0, 0.05] where the growth factor is changing most rapidly. The numerical<br />
solution breaks down sometime after 0.2 hours when the two maxima coalesce (the<br />
authors do not provide a plot of this phenomenon).<br />
48