CHEN, YU-WEI, NELSON BELZILE, AND JOHN M. GUNN ... - ASLO
CHEN, YU-WEI, NELSON BELZILE, AND JOHN M. GUNN ... - ASLO
CHEN, YU-WEI, NELSON BELZILE, AND JOHN M. GUNN ... - ASLO

You also want an ePaper? Increase the reach of your titles
YUMPU automatically turns print PDFs into web optimized ePapers that Google loves.
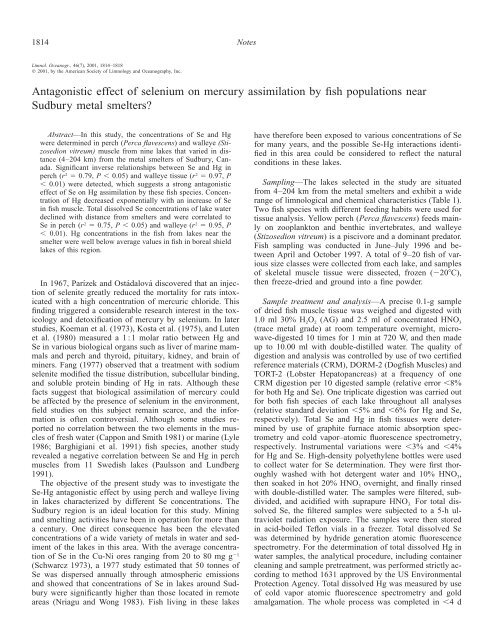
1814 Notes<br />
Limnol. Oceanogr., 46(7), 2001, 1814–1818<br />
� 2001, by the American Society of Limnology and Oceanography, Inc.<br />
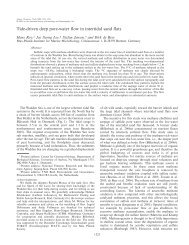
Antagonistic effect of selenium on mercury assimilation by fish populations near<br />
Sudbury metal smelters?<br />
Abstract—In this study, the concentrations of Se and Hg<br />
were determined in perch (Perca flavescens) and walleye (Stizosedion<br />
vitreum) muscle from nine lakes that varied in distance<br />
(4–204 km) from the metal smelters of Sudbury, Canada.<br />
Significant inverse relationships between Se and Hg in<br />
perch (r 2 � 0.79, P � 0.05) and walleye tissue (r 2 � 0.97, P<br />
� 0.01) were detected, which suggests a strong antagonistic<br />
effect of Se on Hg assimilation by these fish species. Concentration<br />
of Hg decreased exponentially with an increase of Se<br />
in fish muscle. Total dissolved Se concentrations of lake water<br />
declined with distance from smelters and were correlated to<br />
Se in perch (r 2 � 0.75, P � 0.05) and walleye (r 2 � 0.95, P<br />
� 0.01). Hg concentrations in the fish from lakes near the<br />
smelter were well below average values in fish in boreal shield<br />
lakes of this region.<br />
In 1967, Parízek and Ostádalová discovered that an injection<br />
of selenite greatly reduced the mortality for rats intoxicated<br />
with a high concentration of mercuric chloride. This<br />
finding triggered a considerable research interest in the toxicology<br />
and detoxification of mercury by selenium. In later<br />
studies, Koeman et al. (1973), Kosta et al. (1975), and Luten<br />
et al. (1980) measured a 1 : 1 molar ratio between Hg and<br />
Se in various biological organs such as liver of marine mammals<br />
and perch and thyroid, pituitary, kidney, and brain of<br />
miners. Fang (1977) observed that a treatment with sodium<br />
selenite modified the tissue distribution, subcellular binding,<br />
and soluble protein binding of Hg in rats. Although these<br />
facts suggest that biological assimilation of mercury could<br />
be affected by the presence of selenium in the environment,<br />
field studies on this subject remain scarce, and the information<br />
is often controversial. Although some studies reported<br />
no correlation between the two elements in the muscles<br />
of fresh water (Cappon and Smith 1981) or marine (Lyle<br />
1986; Barghigiani et al. 1991) fish species, another study<br />
revealed a negative correlation between Se and Hg in perch<br />
muscles from 11 Swedish lakes (Paulsson and Lundberg<br />
1991).<br />
The objective of the present study was to investigate the<br />
Se-Hg antagonistic effect by using perch and walleye living<br />
in lakes characterized by different Se concentrations. The<br />
Sudbury region is an ideal location for this study. Mining<br />
and smelting activities have been in operation for more than<br />
a century. One direct consequence has been the elevated<br />
concentrations of a wide variety of metals in water and sediment<br />
of the lakes in this area. With the average concentration<br />
of Se in the Cu-Ni ores ranging from 20 to 80 mg g �1<br />
(Schwarcz 1973), a 1977 study estimated that 50 tonnes of<br />
Se was dispersed annually through atmospheric emissions<br />
and showed that concentrations of Se in lakes around Sudbury<br />
were significantly higher than those located in remote<br />
areas (Nriagu and Wong 1983). Fish living in these lakes<br />
have therefore been exposed to various concentrations of Se<br />
for many years, and the possible Se-Hg interactions identified<br />
in this area could be considered to reflect the natural<br />
conditions in these lakes.<br />
Sampling—The lakes selected in the study are situated<br />
from 4–204 km from the metal smelters and exhibit a wide<br />
range of limnological and chemical characteristics (Table 1).<br />
Two fish species with different feeding habits were used for<br />
tissue analysis. Yellow perch (Perca flavescens) feeds mainly<br />
on zooplankton and benthic invertebrates, and walleye<br />
(Stizosedion vitreum) is a piscivore and a dominant predator.<br />
Fish sampling was conducted in June–July 1996 and between<br />
April and October 1997. A total of 9–20 fish of various<br />
size classes were collected from each lake, and samples<br />
of skeletal muscle tissue were dissected, frozen (�20�C),<br />
then freeze-dried and ground into a fine powder.<br />
Sample treatment and analysis—A precise 0.1-g sample<br />
of dried fish muscle tissue was weighed and digested with<br />
1.0 ml 30% H 2O 2 (AG) and 2.5 ml of concentrated HNO 3<br />
(trace metal grade) at room temperature overnight, microwave-digested<br />
10 times for 1 min at 720 W, and then made<br />
up to 10.00 ml with double-distilled water. The quality of<br />
digestion and analysis was controlled by use of two certified<br />
reference materials (CRM), DORM-2 (Dogfish Muscles) and<br />
TORT-2 (Lobster Hepatopancreas) at a frequency of one<br />
CRM digestion per 10 digested sample (relative error �8%<br />
for both Hg and Se). One triplicate digestion was carried out<br />
for both fish species of each lake throughout all analyses<br />
(relative standard deviation �5% and �6% for Hg and Se,<br />
respectively). Total Se and Hg in fish tissues were determined<br />
by use of graphite furnace atomic absorption spectrometry<br />
and cold vapor–atomic fluorescence spectrometry,<br />
respectively. Instrumental variations were �3% and �4%<br />
for Hg and Se. High-density polyethylene bottles were used<br />
to collect water for Se determination. They were first thoroughly<br />
washed with hot detergent water and 10% HNO 3,<br />
then soaked in hot 20% HNO 3 overnight, and finally rinsed<br />
with double-distilled water. The samples were filtered, subdivided,<br />
and acidified with suprapure HNO 3. For total dissolved<br />
Se, the filtered samples were subjected to a 5-h ultraviolet<br />
radiation exposure. The samples were then stored<br />
in acid-boiled Teflon vials in a freezer. Total dissolved Se<br />
was determined by hydride generation atomic fluorescence<br />
spectrometry. For the determination of total dissolved Hg in<br />
water samples, the analytical procedure, including container<br />
cleaning and sample pretreatment, was performed strictly according<br />
to method 1631 approved by the US Environmental<br />
Protection Agency. Total dissolved Hg was measured by use<br />
of cold vapor atomic fluorescence spectrometry and gold<br />
amalgamation. The whole process was completed in �4 d
Notes<br />
Table 1. Limnological and chemical characteristics of the studied lakes listed in order of distance from the smelters.<br />
Lake Latitude Longitude<br />
Ramsey (Ra)<br />
Hannah (Ha)<br />
Laurentian (Lu)<br />
Whitson (Wh)<br />
Vermilion (Ve)<br />
Geneva (Ge)<br />
Michiwakenda (Mi)<br />
Long (Lo)<br />
Larder (La)<br />
46�28�N<br />
46�26�N<br />
46�27�N<br />
46�28�N<br />
46�31�N<br />
46�45�N<br />
47�38�N<br />
47�55�N<br />
48�05�N<br />
80�57�W<br />
81�02�W<br />
80�57�W<br />
80�58�W<br />
81�23�W<br />
81�33�W<br />
81�13�W<br />
80�15�W<br />
80�57�W<br />
Distance<br />
from<br />
Sudbury<br />
(km)<br />
4<br />
4<br />
8<br />
10<br />
31<br />
47<br />
127<br />
162<br />
204<br />
Lake<br />
surface<br />
area<br />
(�10 6<br />
m 2 ) pH<br />
7.95<br />
0.27<br />
1.57<br />
4.88<br />
11.25<br />
3.56<br />
3.02<br />
7.43<br />
37.04<br />
after sample collection. The detection limits were at 2 ng<br />
L �1 and 0.05 ng L �1 for Se and Hg, respectively. Other metals<br />
and sulfate were measured by inductively coupled plasma-mass<br />
spectrometry and ion chromatography, respectively.<br />
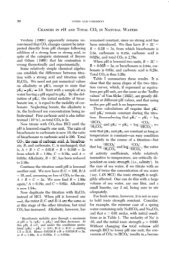
Data treatment—Table 2 presents general information on<br />
fish samples collected for this study. A positive relationship<br />
7.7<br />
7.2<br />
6.5<br />
6.7<br />
7.5<br />
6.7<br />
7.2<br />
7.7<br />
8.0<br />
Total Total Total<br />
Total<br />
disdisdisdissolvedsolvedsolvedsolved<br />
Mg<br />
Cu (uM) Ni (uM) Ca (mM) (mM)<br />
0.22<br />
0.44<br />
0.24<br />
0.27<br />
0.08<br />
0.02<br />
0.04<br />
0.12<br />
0.24<br />
1.57<br />
2.39<br />
0.95<br />
2.39<br />
0.31<br />
0.03<br />
0.02<br />
0.01<br />
0.74<br />
0.38<br />
0.26<br />
0.09<br />
0.18<br />
0.24<br />
0.06<br />
0.23<br />
0.51<br />
0.34<br />
0.19<br />
0.15<br />
0.06<br />
0.08<br />
0.09<br />
0.03<br />
0.07<br />
0.34<br />
0.18<br />
SO 4 2�<br />
(mM)<br />
Table 2. Data on fish fork lengths and total concentrations of Se and Hg in fish muscle tissue from the different lakes.<br />
Fork length<br />
(mm) Element<br />
Median concentration<br />
of N samples<br />
nmol g �1<br />
dry wt<br />
mg kg �1<br />
wet wt<br />
0.22<br />
0.22<br />
0.07<br />
0.19<br />
0.15<br />
0.06<br />
0.05<br />
0.04<br />
0.19<br />
Total<br />
dissolved<br />
Se (nM)<br />
7.74<br />
9.21<br />
5.29<br />
5.97<br />
1.45<br />
1.22<br />
1.11<br />
1.20<br />
1.67<br />
1815<br />
Total<br />
dissolved<br />
Hg<br />
(pM)<br />
105<br />
72<br />
190<br />
157<br />
23<br />
21<br />
17<br />
13<br />
187<br />
between the concentration of Hg in muscle tissue and fish<br />
fork length was usually observed for most lakes especially<br />
for walleye samples, but because of the relatively small sample<br />
sizes and the limited size range sampled in any particular<br />
lake, no clear relationships could be observed between body<br />
size and Se. The average concentration of both Se and Hg<br />
in tissue for a common fork length range was therefore used<br />
in the data analysis. A size range of 100–150 mm was used<br />
Average concentration for selected samples (n)<br />
nmol g �1<br />
dry wt<br />
mg kg �1<br />
wet wt<br />
Fish N<br />
Perch 100–150 mm<br />
Hannah (Ha) 19 103–178 Se 288 4.55 286 � 24 (13) 4.52 � 0.38<br />
Hg 0.09 0.0036 0.112 � 0.050 (13) 0.0045 � 0.0020<br />
Ramsey (Ra) 20 97–203 Se 121 1.91 112 � 14 (4) 1.77 � 0.22<br />
Hg 0.39 0.0157 0.32 � 0.05 (4) 0.0129 � 0.0020<br />
Laurentian (Lu) 13 85–137 Se 80 1.26 85 � 25 (9) 1.34 � 0.39<br />
Hg 0.52 0.0209 0.52 � 0.17 (9) 0.0209 � 0.068<br />
Vermilion (Ve) 14 79–214 Se 52 0.82 47 � 16 (7) 0.74 � 0.25<br />
Hg 3.55 0.1426 3.43 � 0.40 (7) 0.1378 � 0.061<br />
Whitson (Wh) 13 85–109 Se 124 1.96 131 � 19 (12) 2.07 � 0.30<br />
Hg 0.57 0.0229 0.56 � 0.10 (12) 0.0225 � 0.0040<br />
Geneva (Ge) 10 71–115 Se 36 0.57 54 � 2 (2) 0.85 � 0.03<br />
Hg 1.02 0.0410 1.35 � 0.31 (2) 0.0542 � 0.0124<br />
Michiwakenda (Mi) 9 91–220 Se 15 0.24 17 � 3 (4)<br />
027 � 0.05<br />
Hg 1.87 0.0763 1.27 � 0.44 (4) 0.0510 � 0.0177<br />
Walleye 300–350 mm<br />
Ramsey (Ra) 20 171–384 Se 84 1.33 83 � 4 (6) 1.31 � 0.06<br />
Hg 0.53 0.0213 0.49 � 0.05 (6) 0.020 � 0.002<br />
Whitson (Wh) 14 180–539 Se 61 0.96 73 � 5 (4) 1.15 � 0.08<br />
Hg 1.14 0.0458 0.66 � 0.13 (4) 0.027 � 0.005<br />
Vermilion (Ve) 19 168–631 Se 34 0.54 35 � 7 (6) 0.55 � 0.11<br />
Hg 7.69 0.3088 7.34 � 1.60 (6) 0.295 � 0.064<br />
Michiwakenda (Mi) 18 177–541 Se 16 0.25 19 � 1 (4) 0.30 � 0.02<br />
Hg 6.69 0.2687 9.72 � 1.93 (4) 0.390 � 0.078<br />
Long (Lo) 18 217–440 Se 11 0.17 12 � 2 (5) 0.19 � 0.03<br />
Hg 21.30 0.8554 35.7 � 9.9 (5) 1.434 � 0.398<br />
Larder (La) 15 245–738 Se 29 0.46 27 � 1 (3) 0.43 � 0.02<br />
Hg 15.32 0.6153 6.97 � 1.71 (3) 0.280 � 0.069<br />
N � total number of samples; n � number of samples in the corresponding range.
1816 Notes<br />
Fig. 1. Relationship between total selenium concentrations in<br />
perch muscle and total dissolved selenium concentrations in the<br />
study lakes (abbreviations are given in Table 1).<br />
for perch, and a range of 300–350 mm was selected for<br />
walleye. Data on the total number of fish collected, fork<br />
length distribution, median concentration of Se and Hg in<br />
all samples, as well as average concentrations for the selected<br />
size range are reported in Table 2.<br />
The relationship between Se in fish muscle and total dissolved<br />
Se in lake water—The average concentrations of Se<br />
in perch and walleye muscle of selected ranges (Table 2)<br />
exhibited significant positive linear correlations (for perch,<br />
r 2 � 0.75, P � 0.05; for walleye, r 2 � 0.95, P � 0.01) with<br />
total dissolved Se in lake water (Figs. 1, 2). Further analyses<br />
of these data showed that the concentrations of total dissolved<br />
Se in the lakes was related to the distance to the<br />
smelters, i.e., the closer to the smelters, the higher the concentration<br />
of total dissolved Se in the lake (Table 1). Therefore,<br />
the atmospheric deposition of the metal particulates<br />
seems to be an important source of Se in these lakes. It<br />
should be mentioned that, in addition to atmospheric inputs,<br />
Whitson and Larder lakes are also affected by liquid effluents<br />
from tailings and other mining wastes in their catchment<br />
areas. Table 1 also indicates that concentrations of dissolved<br />
Hg are generally high in lakes closer to smelters.<br />
Se-Hg relationships in fish muscle—For each lake, average<br />
concentrations of Se and Hg in muscles of perch and<br />
walleye were calculated for selected size ranges (Table 2).<br />
The concentration of Hg declined exponentially with the increase<br />
of Se concentration in the fish muscles (r 2 � 0.79, P<br />
� 0.05 for perch and r 2 � 0.97, P � 0.01 for walleye) (Figs.<br />
3, 4). The molar Se/Hg ratios vary between 14 and 2,550 in<br />
perch and between 0.4 and 170 in walleye samples, the higher<br />
values usually corresponding to lakes close to smelters.<br />
To facilitate the comparison with other studies in the literature,<br />
concentrations of Se and Hg are also expressed in<br />
mg kg �1 wet weight in Table 2. The interconversion between<br />
nmol g �1 dry weight and mg kg �1 wet weight can be expressed<br />
by these relations: for Hg, value of mg kg �1 wet<br />
Fig. 2. Relationship between total selenium concentrations in<br />
walleye muscle and total dissolved selenium concentrations in the<br />
study lakes (abbreviations are given in Table 1).<br />
muscle weight � value of nmol g �1 dry weight/24.9; for Se,<br />
value of mg kg �1 wet muscle weight � value of nmol g �1 /<br />
63.3; here, water content of 80% in fish muscle is assumed.<br />
For example, the threshold value for commercial sale in Canada<br />
of 0.5 mg Hg per kg of wet weight is equivalent to 12.45<br />
nmol Hg per gram of dry muscle, and 22.0 nmol Se per<br />
gram of dry muscle equals 0.35 mg Se per kg of wet muscle.<br />
The low Hg concentrations in walleye in the studied lakes<br />
near the metal smelters are in sharp contrast to the results<br />
of extensive surveys of walleye in Ontario, where �70% of<br />
the lakes contain walleye that exceed the consumption<br />
guidelines for mercury (Ontario 1997). In a series of 536<br />
samples collected in Ontario lakes, the average concentration<br />
for 300 mm walleye was 8.16 � 4.71 nmol g 1 dry wt (0.33<br />
� 0.19 mg kg �1 wet wt), whereas the average concentration<br />
Fig. 3. Relationship between concentrations of total mercury<br />
and total selenium in perch muscle, best fitted to an exponential<br />
relationship between Se and Hg.
Fig. 4. Relationships between concentrations of total mercury<br />
and total selenium in walleye muscles, best fitted to an exponential<br />
relationship between Se and Hg.<br />
for 100 mm perch was 1.64 � 2.07 nmol g �1 drywt(N �<br />
79) or 0.07 � 0.08 mg kg �1 wet wt. These two values are<br />
11–16 times and 3–16 times higher than concentrations measured<br />
in walleye and perch of the same length collected within<br />
20 km of the Sudbury smelters in our study. These findings<br />
are consistent with the earlier study by Wren and Stokes<br />
(1988), who reported lower Hg concentrations in Sudbury<br />
perch population. Those authors speculated that Se deposition<br />
from the smelters might have affected Hg accumulation<br />
in that species. It is also reported that accumulation of Hg<br />
is often very high in fish tissues coming from pristine remote<br />
water bodies. In a study on eight Swedish headwater lakes<br />
of a boreal forest region (Lindqvist et al. 1991), Hg concentrations<br />
of 0.9–9.9 nmol g �1 dry perch muscles (0.04–0.40<br />
mg kg �1 wet wt) were measured, while total Hg in these lake<br />
waters ranged from 4 to 50 pM (0.8–19 ng L �1 ), except for<br />
one lake (120 pM or 24 ng L �1 ). Watras and Bloom (1992)<br />
found that, even in water containing very low concentrations<br />
of Hg (5.5 pM or 1.1 ng L �1 ), 1-yr-old yellow perch could<br />
still accumulate Hg as high as 1.4 nmol g �1 dry wt (0.06<br />
mg kg �1 wet wt). These values are much higher than those<br />
in perch collected in lakes of the Sudbury region (average<br />
0.49 nmol g �1 dry muscle or 0.02 mg kg �1 wet wt; n � 46,<br />
fork length 8.5–22.3 cm). If an antagonistic effect exists<br />
ubiquitously in fish muscles, the unusually high concentrations<br />
of Hg observed in some remote areas might be partially<br />
due to low concentrations of Se in the lake catchments.<br />
Long-range atmospheric pollution by Hg might not be the<br />
only explanation for high Hg concentrations found in fish<br />
muscles living in some pristine lakes.<br />
The mechanism of interaction between these two elements<br />
in the bioassimilation processes has not yet been clarified.<br />
Many studies present a positive linear correlation between<br />
Hg and Se (Koeman et al. 1973; Kosta et al. 1975; Luten et<br />
al. 1980). From an experiment based on the addition of the<br />
82 Se isotope and HgCl2 in rat blood, Yoneda and Suzuki<br />
Notes<br />
1817<br />
(1997) proposed the formation of an equimolar Hg-Se complex<br />
binding to selenoprotein P, which seems to support the<br />
observation of the positive linear relationship. However<br />
Figs. 3 and 4 in our study present a different correlation,<br />
which could suggest a mechanism of competition between<br />
Hg and Se in fish muscles. From the work by Paulsson and<br />
Lundbergh (1991), a very similar correlation as ours was<br />
found for nontreated 1-yr perch. However, this correlation<br />
completely disappeared after the lakes were treated by elevated<br />
concentrations of sodium selenite, although a general<br />
decrease of Hg concentrations in fish muscles was observed.<br />
This might indicate a disturbed metabolism of fish under<br />
artificially created conditions.<br />
This remarkable discrepancy in Hg-Se relationships suggests<br />
that Hg and Se distribution and interaction in muscles<br />
could be different from those that occur in other organs that<br />
are closely connected to the blood system and require a large<br />
blood supply, such as liver, brain, and kidney. The redistribution<br />
of these two elements among tissues would also be<br />
different if the main source of Hg and Se is food, compared<br />
with water. The diffusion of aqueous metal ions through skin<br />
could cause an increase of concentrations in fish muscles,<br />
and biological elimination processes of the two elements<br />
also need to be considered.<br />
In addition, the geochemistry of lake can play a crucial role<br />
on bioassimilation of Hg (Morel et al. 1998) and Se, because<br />
the bioavailability of these elements largely depend on their<br />
chemical speciation, which is related to pH, dissolved organic<br />
carbon, [Cl � ], temperature, seasonal variations, specific limnological<br />
conditions, etc. The relatively high concentrations<br />
of Se in waters and sediments of Sudbury area lakes might<br />
also play an inhibiting role on sulfate reducing bacteria,<br />
which, in turn, could affect the methylation of Hg in sediments<br />
(Oremland and Capone 1988). This study is a preliminary<br />
step toward understanding the complicated interactions<br />
between Se and Hg in bioassimilation processes. More systematic<br />
investigations on distributions of Hg and Se in different<br />
organs of the same species and at other levels of the<br />
food chain are therefore necessary to better understand the<br />
biochemical behaviour of these two elements.<br />
Finally, in spite of the possible antagonistic effect between<br />
Se and Hg, one should be very careful in recommending Se<br />
as a remediating agent against mercury, because Se possesses<br />
a complex nature. Although the deficiency of this essential<br />
element at low concentrations can cause different diseases,<br />
it can show significant potential toxicity at higher<br />
concentration levels (Fergusson 1990). Lemly (1993) recently<br />
reported serious teratogenic effect of Se on freshwater<br />
fish living in a lake used as a coal power plant impoundment.<br />
His study shows that percentage of deformed fish increased<br />
exponentially with Se concentrations in fish body, although<br />
the deformities could not be unequivocally attributed to Se.<br />
The Se concentrations in fish of this lake were up to 130<br />
times those in the reference lakes. The identified teratogenic<br />
defects include lordosis, kyphosis, scoliosis, edema, exopthalmus,<br />
cataracts, etc. Finding the threshold of Se concentration<br />
levels in different biological species and its bioaccumulation<br />
in the food chain would be the key step for using<br />
it in mercury detoxification of contaminated sites.<br />
Our study demonstrated that the presence of Se in fish
1818 Notes<br />
muscles is positively correlated to the concentrations of Se<br />
in waters and that the presence of Se in fish muscles appeared<br />
to be an explanation for the limited accumulation of<br />
Hg in fish. The presence of Se in a watershed could therefore<br />
be an important factor influencing mercury bioaccumulation.<br />
We would expect similar trends in other areas of the world<br />
where sulfidic ores are mined, because Se is often associated<br />
with sulfide deposits.<br />
Yu-Wei Chen and Nelson Belzile1 Department of Chemistry and Biochemistry<br />
Laurentian University<br />
Sudbury, Ontario P3E 2C6 Canada<br />
John M. Gunn<br />
Cooperative Freshwater Ecology Unit<br />
Laurentian University<br />
Sudbury, Ontario P3E 2C6 Canada<br />
References<br />
BARGHIGIANI, G., D. PELLEGRINI, A.D’ULIVO, <strong>AND</strong> S. DE RANIERI.<br />
1991. Mercury assessment and its relation to selenium levels<br />
in edible species of the Northern Tyrrhenian Sea. Mar. Pollut.<br />
Bull. 22: 406–409.<br />
CAPPON, C.J.,<strong>AND</strong> J. C. SMITH. 1981. Mercury and selenium content<br />
and chemical form in fish muscle. Arch. Contam. Toxicol.<br />
10: 305–319.<br />
FANG, S. C. 1977. Interaction of selenium and mercury in the rat.<br />
Chem. Biol. Interact. 17: 25–40.<br />
FERGUSSON, J. E. 1990. The heavy elements: Chemistry, environmental<br />
impact and health effects. Pergamon.<br />
1 Corresponding author (belzile@nickel.laurentian.ca).<br />
Acknowledgements<br />
We thank P. Couture of the Biology Department at Laurentian<br />
University for supplying some of the fish samples and G. Mierle of<br />
the Ontario Ministry of the Environment for providing extensive<br />
survey data on Hg contamination of sport fish species. Funding<br />
from the National Science and Engineering Research Council of<br />
Canada, the Ontario Ministry of Natural Resources, the Elliot Lake<br />
Research Field Station of Laurentian University and Questron Technologies<br />
is acknowledged. Critical comments from Y. Alarie, H.<br />
Boudjellaba, A. Omri, and anonymous reviewers are greatly appreciated.<br />
KOEMAN, J. H., W. H. M. PEETERS, <strong>AND</strong> C. H. M. KOUDSTAAL-HOL.<br />
1973. Mercury-selenium correlations in marine mammals. Nature<br />
245: 385–386.<br />
KOSTA, L., A. R. BYRNE, <strong>AND</strong> V. ZELENKO. 1975. Correlation between<br />
selenium and mercury in man following exposure to<br />
inorganic mercury. Nature 254: 238–239.<br />
LEMLY, A. D. 1993. Teratogenic effects of selenium in natural populations<br />
of freshwater fish. Ecotoxicol. Environ. Saf. 26: 181–<br />
204.<br />
LINDQVIST, O., <strong>AND</strong> OTHERS. 1991. Mercury in the Swedish environment:<br />
Recent research on causes, consequences, and corrective<br />
measures. Chap. 14. Water Air Soil Pollut. 55: 1–216.<br />
LUTEN, J. B., A. RUITER, T.M.RITSKES, A.B.RAUCHBAAR, <strong>AND</strong><br />
G. RIEKWEL-BOOY. 1980. Mercury and selenium in marine and<br />
freshwater fish. J. Food Sci. 45: 416–419.<br />
LYLE, J. M. 1986. Mercury and selenium concentrations in sharks<br />
from Northern Australian waters. Aust. J. Mar. Freshw. Res.<br />
37: 309–321.<br />
MOREL, F. M. M., A. M. L. KRAEPIEL, <strong>AND</strong> M. AMYOT. 1998. The<br />
chemical cycle and bioaccumulation of mercury. Annu. Rev.<br />
Ecol. Syst. 29: 543–566.<br />
NRIAGU, J.O.,<strong>AND</strong> H. K. WONG. 1983. Selenium pollution of lakes<br />
near the smelters at Sudbury, Ontario. Nature 301: 55–57.<br />
ONTARIO (ONTARIO MINISTRY OF NATURAL RESOURCES <strong>AND</strong> ON-<br />
TARIO MINISTRY OF THE ENVIRONMENT). 1997. Guide to eating<br />
Ontario sportfish 1997–1998. Queen’s Printer for Ontario.<br />
OREML<strong>AND</strong>, R.R.,<strong>AND</strong> D. G. CAPONE. 1988. Use of specific inhibitors<br />
in biogeochemistry and microbial ecology. In K. C. Marshall<br />
[ed.], Advances in microbial ecology, v. 10. Plenum.<br />
PARIZEK, J., <strong>AND</strong> I. OSTADALOVA. 1967. The protective effect of<br />
small amounts of selenite in sublimate intoxication. Experientia<br />
23: 142–143.<br />
PAULSSON, K., <strong>AND</strong> K. LUNDBERG. 1991. Treatment of mercury contaminated<br />
fish by selenium addition. Water Air Soil Pollut. 56:<br />
833–841.<br />
SCHWARCZ, H. P. 1973. Sulfur isotope analyses of some Sudbury,<br />
Ontario ores. Can. J. Earth Sci. 10: 1444–1459.<br />
WATRAS, C.J.,<strong>AND</strong> N. S. BLOOM. 1992. Mercury and methylmercury<br />
in individual zooplankton: Implications for bioaccumulation.<br />
Limnol. Oceanogr. 37: 1313–1318.<br />
WREN, C.D.,<strong>AND</strong> STOCKES, P. M. 1988. Depressed mercury levels<br />
in biota from acid and metal stressed lakes near Sudbury, Ontario.<br />
Ambio 17: 28–30.<br />
YONEDA, S., <strong>AND</strong> K. T. SUZUKI. 1997. Equimolar Hg-Se complex<br />
binds to selenoprotein P. Biochem. Biophys. Res. Commun.<br />
231: 7–11.<br />
Received: 14 February 2001<br />
Amended: 25 May 2001<br />
Accepted: 17 July 2001