Basic UV-Vis Theory, Concepts and Applications
Basic UV-Vis Theory, Concepts and Applications
Basic UV-Vis Theory, Concepts and Applications

Create successful ePaper yourself
Turn your PDF publications into a flip-book with our unique Google optimized e-Paper software.
<strong>Basic</strong> <strong>UV</strong>-<strong>Vis</strong> <strong>Theory</strong>, <strong>Concepts</strong> <strong>and</strong> <strong>Applications</strong><br />
The relative effect of other substances or impurities is smaller.<br />
The rate of change of absorbance with wavelength is smaller, <strong>and</strong> the measurement is not so severely effected by<br />
small errors in the wavelength setting.<br />
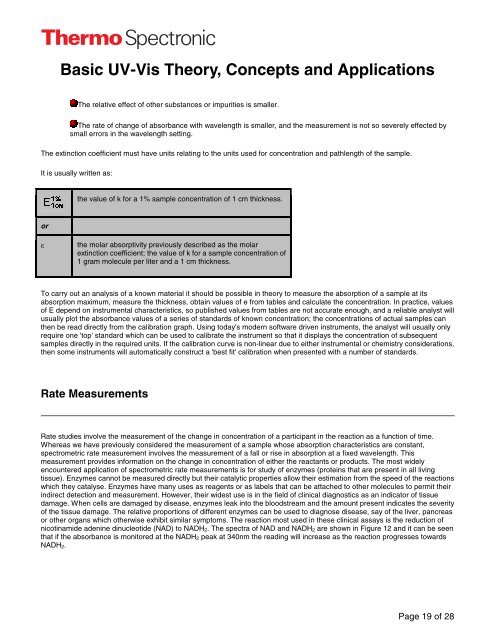
The extinction coefficient must have units relating to the units used for concentration <strong>and</strong> pathlength of the sample.<br />
It is usually written as:<br />
or<br />
the value of k for a 1% sample concentration of 1 cm thickness.<br />
ε the molar absorptivity previously described as the molar<br />
extinction coefficient; the value of k for a sample concentration of<br />
1 gram molecule per liter <strong>and</strong> a 1 cm thickness.<br />
To carry out an analysis of a known material it should be possible in theory to measure the absorption of a sample at its<br />
absorption maximum, measure the thickness, obtain values of e from tables <strong>and</strong> calculate the concentration. In practice, values<br />
of E depend on instrumental characteristics, so published values from tables are not accurate enough, <strong>and</strong> a reliable analyst will<br />
usually plot the absorbance values of a series of st<strong>and</strong>ards of known concentration; the concentrations of actual samples can<br />
then be read directly from the calibration graph. Using today's modern software driven instruments, the analyst will usually only<br />
require one 'top' st<strong>and</strong>ard which can be used to calibrate the instrument so that it displays the concentration of subsequent<br />
samples directly in the required units. If the calibration curve is non-linear due to either instrumental or chemistry considerations,<br />
then some instruments will automatically construct a 'best fit' calibration when presented with a number of st<strong>and</strong>ards.<br />
Rate Measurements<br />
Rate studies involve the measurement of the change in concentration of a participant in the reaction as a function of time.<br />
Whereas we have previously considered the measurement of a sample whose absorption characteristics are constant,<br />
spectrometric rate measurement involves the measurement of a fall or rise in absorption at a fixed wavelength. This<br />
measurement provides information on the change in concentration of either the reactants or products. The most widely<br />
encountered application of spectrometric rate measurements is for study of enzymes (proteins that are present in all living<br />
tissue). Enzymes cannot be measured directly but their catalytic properties allow their estimation from the speed of the reactions<br />
which they catalyse. Enzymes have many uses as reagents or as labels that can be attached to other molecules to permit their<br />
indirect detection <strong>and</strong> measurement. However, their widest use is in the field of clinical diagnostics as an indicator of tissue<br />
damage. When cells are damaged by disease, enzymes leak into the bloodstream <strong>and</strong> the amount present indicates the severity<br />
of the tissue damage. The relative proportions of different enzymes can be used to diagnose disease, say of the liver, pancreas<br />
or other organs which otherwise exhibit similar symptoms. The reaction most used in these clinical assays is the reduction of<br />
nicotinamide adenine dinucleotide (NAD) to NADH2. The spectra of NAD <strong>and</strong> NADH2 are shown in Figure 12 <strong>and</strong> it can be seen<br />
that if the absorbance is monitored at the NADH2 peak at 340nm the reading will increase as the reaction progresses towards<br />
NADH2.<br />
Page 19 of 28