Full Report - Food, Nutrition, and the Prevention of Cancer
Full Report - Food, Nutrition, and the Prevention of Cancer
Full Report - Food, Nutrition, and the Prevention of Cancer

You also want an ePaper? Increase the reach of your titles
YUMPU automatically turns print PDFs into web optimized ePapers that Google loves.
in <strong>the</strong> systematic literature reviews that informed <strong>the</strong> Panel’s<br />
judgements.<br />
6.1.2 Interpretation <strong>of</strong> <strong>the</strong> evidence<br />
6.1.2.1 General<br />
For general considerations that may affect interpretation <strong>of</strong><br />
<strong>the</strong> evidence, see chapters 3.3 <strong>and</strong> 3.5, <strong>and</strong> boxes 3.1, 3.2,<br />
3.6 <strong>and</strong> 3.7.<br />
6.1.2.2 Specific<br />
Some considerations specific to body fatness are as follows.<br />
Classification. The system <strong>of</strong> classifying underweight, ‘normal’<br />
weight, overweight, <strong>and</strong> degrees <strong>of</strong> obesity as discrete<br />
ranges <strong>of</strong> BMI, is in general use. However, as shown in this<br />
chapter <strong>and</strong> also Chapter 8, <strong>the</strong> relationship between body<br />
fatness <strong>and</strong> cancer is continuous across <strong>the</strong> range <strong>of</strong> BMI. For<br />
this reason, <strong>the</strong> Panel has chosen to use <strong>the</strong> term ‘body fatness’<br />
ra<strong>the</strong>r than ‘overweight’ or ‘obesity’.<br />
Measurement. BMI is not a perfect marker <strong>of</strong> body fatness.<br />
More precise techniques such as underwater weighing, magnetic<br />
resonance imaging, computerised tomography, or dualenergy<br />
X-ray absorptiometry are rare in large-scale<br />
epidemiological studies due to <strong>the</strong>ir difficulty <strong>and</strong> expense.<br />
Abdominal fatness is usually measured ei<strong>the</strong>r using <strong>the</strong> waist<br />
to hip ratio or <strong>the</strong> waist circumference alone. There is a lack<br />
<strong>of</strong> consensus on how abdominal fatness is best measured,<br />
<strong>and</strong> measurement error is more likely than for some o<strong>the</strong>r<br />
anthropometric measures such as height <strong>and</strong> weight. The<br />
currently proposed maximum ‘cut-<strong>of</strong>f’ points for ‘healthy’<br />
waist circumferences (94 cm or 37 inches for men; 80 cm or<br />
31.5 inches for women) <strong>and</strong> for ‘healthy’ waist to hip ratios<br />
(1.0 for men; 0.8 for women) are based almost exclusively<br />
on studies <strong>of</strong> cardiovascular or type 2 diabetes risk in white<br />
populations in high-income countries. It is not known<br />
whe<strong>the</strong>r <strong>the</strong>y can be applied to o<strong>the</strong>r ethnic groups or outcomes.<br />
The relationship between waist circumference <strong>and</strong><br />
<strong>the</strong> size <strong>of</strong> intra-abdominal fat stores (as opposed to subcutaneous<br />
abdominal fat stores) may vary between different<br />
ethnic groups. 18 As body fatness tends to increase with age<br />
in most populations, <strong>and</strong> is characteristically higher in<br />
women than in men, it is important that studies take into<br />
account both age <strong>and</strong> sex. Measurement <strong>of</strong> change in weight<br />
tends to be more precise than static measures such as weight<br />
or BMI.<br />
<strong>Report</strong>ing bias. Objective measures <strong>of</strong> height <strong>and</strong> weight, <strong>and</strong><br />
<strong>the</strong>refore BMI, are reliable. However, many studies rely on<br />
self-reporting, which is liable to introduce bias. Although<br />
reported <strong>and</strong> actual weights are correlated, weight tends to<br />
be under-reported, especially by overweight <strong>and</strong> obese people.<br />
BMIs calculated from self-reported data will <strong>the</strong>refore<br />
tend to be lower than from more objective measures.<br />
214<br />
P ART 2 • EVIDENCE AND JUDGEMENTS<br />
6.1.3 Evidence <strong>and</strong> judgements<br />
The full systematic literature review (SLR) is contained on<br />
<strong>the</strong> CD included with this <strong>Report</strong>.<br />
There are several general mechanisms through which body<br />
fatness <strong>and</strong> abdominal fatness could plausibly influence cancer<br />
risk. For example, increasing body fatness raises <strong>the</strong><br />
inflammatory response, increases circulating oestrogens, <strong>and</strong><br />
decreases insulin sensitivity. The physiological effects <strong>of</strong> obesity<br />
are described in more detail in Chapter 8. The effects <strong>of</strong><br />
body fatness-related hormonal changes <strong>and</strong> inflammation on<br />
cancer processes are detailed in box 2.4. Additional sitespecific<br />
mechanisms are described with <strong>the</strong> evidence for<br />
each cancer site in <strong>the</strong> following sections.<br />
6.1.3.1 Body fatness<br />
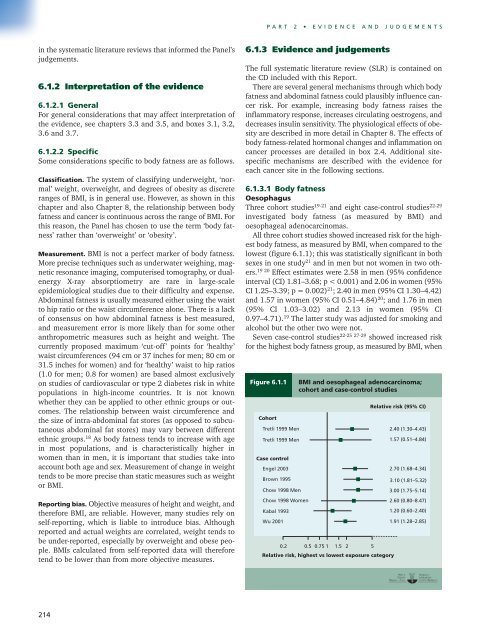
Oesophagus<br />
Three cohort studies 19-21 <strong>and</strong> eight case-control studies 22-29<br />
investigated body fatness (as measured by BMI) <strong>and</strong><br />
oesophageal adenocarcinomas.<br />
All three cohort studies showed increased risk for <strong>the</strong> highest<br />
body fatness, as measured by BMI, when compared to <strong>the</strong><br />
lowest (figure 6.1.1); this was statistically significant in both<br />
sexes in one study 21 <strong>and</strong> in men but not women in two o<strong>the</strong>rs.<br />
19 20 Effect estimates were 2.58 in men (95% confidence<br />
interval (CI) 1.81–3.68; p < 0.001) <strong>and</strong> 2.06 in women (95%<br />
CI 1.25–3.39; p = 0.002) 21 ; 2.40 in men (95% CI 1.30–4.42)<br />
<strong>and</strong> 1.57 in women (95% CI 0.51–4.84) 20 ; <strong>and</strong> 1.76 in men<br />
(95% CI 1.03–3.02) <strong>and</strong> 2.13 in women (95% CI<br />
0.97–4.71). 19 The latter study was adjusted for smoking <strong>and</strong><br />
alcohol but <strong>the</strong> o<strong>the</strong>r two were not.<br />
Seven case-control studies 22-25 27-29 showed increased risk<br />
for <strong>the</strong> highest body fatness group, as measured by BMI, when<br />
Figure 6.1.1 BMI <strong>and</strong> oesophageal adenocarcinoma;<br />
cohort <strong>and</strong> case-control studies<br />
Cohort<br />
Tretli 1999 Men<br />
Tretli 1999 Men<br />
Case control<br />
Engel 2003<br />
Brown 1995<br />
Chow 1998 Men<br />
Chow 1998 Women<br />
Kabal 1993<br />
Wu 2001<br />
0.2 0.5 0.75 1 1.5 2 5<br />
Relative risk, highest vs lowest exposure category<br />
Relative risk (95% CI)<br />
2.40 (1.30–4.43)<br />
1.57 (0.51–4.84)<br />
2.70 (1.68–4.34)<br />
3.10 (1.81–5.32)<br />
3.00 (1.75–5.14)<br />
2.60 (0.80–8.47)<br />
1.20 (0.60–2.40)<br />
1.91 (1.28–2.85)