Magnetic Chromatography brochure - Invitrogen
Magnetic Chromatography brochure - Invitrogen
Magnetic Chromatography brochure - Invitrogen

You also want an ePaper? Increase the reach of your titles
YUMPU automatically turns print PDFs into web optimized ePapers that Google loves.
New<br />
<strong>Magnetic</strong> Bead<br />
<strong>Chromatography</strong><br />
Product Line<br />
... including Dynabeads® RPC 18<br />
DYNAL<br />
invitrogen bead separations
Reduce sample complexity - no columns required!<br />
Enjoy the benefits of Dynabeads®<br />
The new magnetic bead chromatography product line is<br />
intended for isolation of proteins and peptides in complex<br />
samples such as serum, plasma, urine or cell lysate. The<br />
products help you to:<br />
•<br />
•<br />
•<br />
•<br />
•<br />
•<br />
•<br />
•<br />
•<br />
•<br />
Reduce sample complexity<br />
Concentrate and fractionate<br />
Remove unwanted salts and contaminants<br />
Perform serum profiling<br />
Automate your analysis<br />
Scale your protocols<br />
Avoid columns or centrifugation<br />
Produce reproducible results<br />
Work with small amounts of starting material<br />
Work with viscous samples<br />
Biomarker discovery analysis needs<br />
reproducible protocols<br />
Biomarker discovery is a challenging field where<br />
proteomic strategies are utilized for reliable detection of<br />
disease-specific protein and peptide biomarkers in body<br />
fluids. Discovery and validation of biomarkers require<br />
large numbers of patient samples. Standardized and<br />
automated methods generating reproducible results<br />
are important, and Dynabeads® offer you a reliable high<br />
throughput sample preparation method.<br />
Simple magnetic bead chromatography<br />
<strong>Magnetic</strong> chromatography Dynabeads® simplify sample<br />
preparation of complex samples and offers a gentle<br />
separation process, with no need for centrifugation or<br />
columns (Fig. 1). Highly reproducible isolation allows for<br />
the efficient recovery of proteins and peptides in small<br />
volumes.<br />
Dynabeads® RPC Protein<br />
Dynabeads® RPC (Reversed Phase <strong>Chromatography</strong>)<br />
Protein are perfectly suited for serum profiling of proteins<br />
and large peptides (> 5,000 Da) and are ideal for top-down<br />
proteomics strategies (Fig. 6). The amount of exposed<br />
hydrophobic amino acids differs between proteins. The<br />
more hydrophobic amino acids exposed, the stronger<br />
is the binding to the surface of the beads. A step-wise<br />
increase in acetonitrile concentration results in eluted<br />
fractions of peptides/proteins (Fig. 3).<br />
DYNAL<br />
invitrogen bead separations<br />
No Columns Required<br />
Dynabeads® RPC 18<br />
Dynabeads® RPC 18 are intended for peptide (< 5,000<br />
Da) sample concentration, desalting (Fig. 5) and for the<br />
reduction of sample complexity. The beads can be used<br />
for serum profiling and peptide mass fingerprinting.<br />
Peptides are desorbed from the beads using acetonitrile.<br />
Fractionation of the peptide sample can be done<br />
by eluting step-wise using increasing acetonitrile<br />
concentrations.<br />
Dynabeads® WCX<br />
Dynabeads® WCX (Weak Cation Exchange) separate<br />
proteins or peptides by exploiting differences in net<br />
charge, where bead-bound negatively charged groups<br />
adsorb positively charged molecules. Reduced sample<br />
complexity by fractionation is brought about by<br />
manipulating the pH or the salt concentration during<br />
adsorption or elution (Fig. 2). Dynabeads® WCX can also<br />
be used for serum profiling experiments (Fig. 6).<br />
Automated sample preparation pre MS<br />
analysis<br />
Dynabeads® are optimal for automated applications<br />
due to their small size (1 µm), low sedimentation rate<br />
and high magnetic mobility. <strong>Magnetic</strong> separation and<br />
handling can be automated on a wide variety of platforms.<br />
Protein/peptide fractions obtained using magnetic<br />
chromatography Dynabeads® can be applied to Matrix<br />
Assisted Laser Desorption Ionisation (MALDI) targets for<br />
MS analysis, allowing you to obtain excellent quality mass<br />
spectra (Fig. 3, 4, 5 & 6) or analyzed in other downstream<br />
applications such as electrospray-MS, HPLC or 1D/2D gel<br />
electrophoresis (Fig. 2 & 3).<br />
1
<strong>Magnetic</strong> Bead <strong>Chromatography</strong><br />
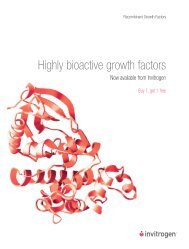
Fig. 1. Principle for magnetic bead chromatography products is very simple<br />
The Dynabeads® are added to a protein/peptide sample and the proteins/peptides are allowed to adsob. The beads with bound material are<br />
washed to remove contaminants (e.g. salt) by washing and magnetic separation. Reversed phase separation using Dynabeads® RPC 18 and<br />
Dynabeads® RPC Protein is based on hydrophobic interactions, while Dynabeads® WCX utilise differences in net charge as the separating factor.<br />
DYNAL<br />
invitrogen bead separations<br />
2
A<br />
C<br />
A<br />
pH 3<br />
Lysate (unfractionated)<br />
655 spots<br />
pH 3<br />
400 mM fraction<br />
Reduced Sample Complexity<br />
802 spots, 68 % unique to this fraction 817 spots, 84 % unique to this fraction<br />
DYNAL<br />
invitrogen bead separations<br />
pH 10<br />
pH 10<br />
B<br />
D<br />
pH 3<br />
200 mM fraction<br />
867 spots, 84 % unique to this fraction<br />
pH 3 pH 10<br />
600 mM fraction<br />
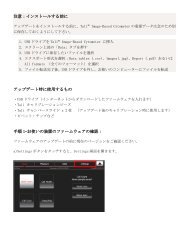
Fig. 2. Reduced sample complexity using Dynabeads® WCX<br />
A cell lysate from a human cancer cell line (SW480) was fractionated using Dynabeads® WCX. Proteins were adsorbed to Dynabeads® WCX using low salt conditions<br />
(50 mM NaP buffer pH 7, 50 mM NaCl) and desorbed step-wise with increasing salt concentrations (50 mM NaP buffer pH 7 including 200 mM, 400 mM or 600 mM<br />
NaCl). The figure shows unfractionated lysate (A) and the three fractions (B,C,D) as analysed by 2-D gel electrophoresis. Fraction B, C and D enabled the detection of<br />
2,211 unique resolved spots and of these only 38 spots were found to be present in all three fractions (2%). Analysing the same amount of protein from unfractionated<br />
lysate enabled the detection of only 655 spots.<br />
Fractions were prepared for gel analysis by desalting using a commercially available 2-D gel clean up kit. Samples were then focused in pH 3 - 10 (11 cm) IPG strips<br />
and resolved in 8 - 16 % SDS-PAGE gels. Approximately 100 µg protein was applied to each strip. Gels were silver stained and analysed using a commercially available<br />
2-D gel analysis software.<br />
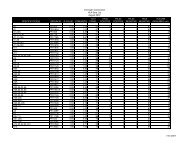
Fig. 3. Reduced sample complexity using Dynabeads® RPC Protein<br />
A. Fractionation of a protein mixture containing diamine oxidase and alcohol dehydrogenase using Dynabeads® RPC Protein. The protein mixture (containing 10 μg<br />
total protein) was adsorbed to Dynabeads® RPC Protein in 200 mM NaCl, 0.1 % TFA. Salts were subsequently washed away and proteins desorbed step-wise using<br />
increasing concentrations of acetonitrile (20 %, 30 % and 40 %). One quarter of each fraction was applied to a 10-20 % SDS-PAGE gel. The gel was silver stained.<br />
Diamine oxidase and alcohol dehydrogenase are found in distinct fractions.<br />
B. A mixture containing Insulin (1), Ubiquitin I (2), Cytochrome C (3) and Myoglobin (4) (Bruker Daltonics’ Protein Calibration Standard I) was fractionated using<br />
Dynabeads® RPC Protein. The mixture was adsorbed to Dynabeads® RPC Protein in 200 mM NaCl, 0.1 % TFA. Salts were subsequently washed away and proteins/<br />
peptides desorbed step-wise using increasing concentrations of acetonitrile (15 %, 30 % and 40 %). An aliquot of protein/peptide mixture or eluate (1 μl) was mixed<br />
with an equal amount of MALDI matrix (1 μl sinapinic acid) and 0.5 μl of the sample/matrix mixture spotted onto a MALDI target plate. Data was obtained using a<br />
commercially available MALDI-TOF/TOF MS instrument.<br />
B<br />
Intens. (a.u.)<br />
Intens. [a.u.]<br />
Intens. [a.u.]<br />
Intens. [a.u.]<br />
Intens. [a.u.]<br />
4<br />
x10<br />
3<br />
2<br />
1<br />
0<br />
x104<br />
2.5<br />
2.0<br />
1.5<br />
1.0<br />
0.5<br />
0 0<br />
x104<br />
2.0<br />
1.5<br />
1.0<br />
0.5<br />
0 0<br />
4000<br />
3000<br />
2000<br />
1000<br />
0<br />
1<br />
pH 10<br />
Unfractionated mixture<br />
Pro1_g7_160305\0_G7\1\1SLin Raw<br />
2 3 4<br />
Pro2_g8_160305\0_G8\1\1SLin Raw<br />
15 % acetonitrile fraction<br />
Pro3_h6_160305\0_H6\1\1SLin Raw<br />
30 % acetonitrile fraction<br />
Pro4_h8_160305\0_H8\1\1SLin Raw<br />
40 % acetonitrile fraction<br />
6000 8000 10000 12000 14000 16000 18000<br />
m/z<br />
3
Intens. (a.u.)<br />
Intens. [a.u.]<br />
Intens. [a.u.]<br />
Intens. Intens. [a.u.] (a.u.) Intens. [a.u.]<br />
Intens. [a.u.]<br />
Intens. [a.u.]<br />
Intens. [a.u.]<br />
Intens. [a.u.]<br />
1500<br />
1000<br />
500<br />
0<br />
x104<br />
3<br />
2<br />
1<br />
0<br />
x104<br />
1.00<br />
0.75<br />
0.50<br />
0.25<br />
x104<br />
1.5<br />
1.0<br />
0.5<br />
4<br />
x10<br />
2<br />
1<br />
8000<br />
6000<br />
4000<br />
2000<br />
0<br />
6000<br />
4000<br />
2000<br />
0<br />
8000<br />
6000<br />
4000<br />
2000<br />
Serum Profiling and Desalting<br />
Pro8_g9_160305\0_G9\1\1SLin Raw<br />
Untreated sample<br />
Pro6_i7_160305\0_I7\1\1SLin Raw<br />
Sample desalted using<br />
Dynabeads ® RPC Protein<br />
6000 8000 10000 12000 14000 16000 18000<br />
Fig. 4. Desalt your sample pre MS analysis using Dynabeads® RPC<br />
Protein<br />
A mixture of Insulin, Ubiquitin I, Cytochrome C and Myoglobin containing<br />
a high salt concentration (2.2 M NaCl) was desalted using Dynabeads®<br />
RPC Protein. The mixture was adsorbed to Dynabeads® RPC Protein, salts<br />
were subsequently washed away and proteins/peptides desorbed in 50 %<br />
acetonitrile. An aliquot of protein/peptide mixture or eluate (1 μl) was mixed<br />
with an equal amount of MALDI matrix (1 μl sinapinic acid) and 0.5 μl of the<br />
sample/matrix mixture spotted onto a MALDI target plate. Data was obtained<br />
using a commercially available MALDI-TOF/TOF MS instrument.<br />
ser2_i4_LMW_040505\0_I4\1\1SLin Dynabeads Raw<br />
® RPC Protein<br />
ser4_j3_LMW_040505\0_J3\1\1SLin Dynabeads Raw<br />
® RPC Protein<br />
ser5_j5_LMW_040505\0_J5\1\1SLin Dynabeads Raw<br />
® RPC Protein<br />
Ser1_l20_110505\0_L20\1\1SLin Dynabeads Raw<br />
® WCX<br />
Ser2_m18_110505\0_M18\1\1SLin Dynabeads Raw<br />
® WCX<br />
Ser5_n19_110505\0_N19\1\1SLin Dynabeads Raw<br />
® WCX<br />
00 5000 6000 7000 8000 9000<br />
m/z<br />
m/z<br />
A<br />
B<br />
Intens. (a.u.)<br />
R4_050805_dig buff_TA_L8_100805\0_L8\1\1SRef Raw<br />
Fig. 6. Dynabeads® RPC Protein and Dynabeads® WCX can be used<br />
for Serum/Plasma Profiling to look for protein (and large peptide)<br />
biomarkers<br />
A single serum sample was divided into six identical aliquots (10 μl), to which<br />
1 mg of Dynabeads® RPC Protein or Dynabeads® WCX and the appropriate<br />
adsorption buffers were added. After washing, proteins (and peptides) were<br />
eluted with either 50 % acetonitrile (Dynabeads® RPC Protein) or 0.5 % TFA<br />
(Dynabeads® WCX). The results show that even using this non-automated<br />
protocol sample preparation is reproducible. Both high and low abundant<br />
protein peaks are detected which are above general instrument noise. Since<br />
Dynabeads® RPC Protein or Dynabeads® WCX generate different profiles,<br />
these beads can be used in parallel on the same serum samples in order to<br />
increase the chance of identifying novel biomarkers.<br />
An aliquot of eluate (1 μl) was mixed with an equal volume of MALDI matrix<br />
(1 μl sinapinic acid) and 0.5 μl of the sample/matrix mixture spotted onto<br />
a MALDI target plate. Data was obtained using a commercially available<br />
MALDI-TOF/TOF MS instrument.<br />
DYNAL<br />
invitrogen bead separations 4<br />
Intens. [a.u.]<br />
Intens. [a.u.]<br />
5<br />
x10<br />
1.0<br />
0.8<br />
0.6<br />
0.4<br />
0.2<br />
0 0<br />
x105<br />
1.0<br />
0.8<br />
0.6<br />
0.4<br />
0.2<br />
Digest spotted diectly<br />
onto MALDI target<br />
Pep41_dig buff_E810_TA_G5_100805\0_G5\1\1SRef Raw<br />
Digest spotted after clean-up<br />
with Dynabeads ® RPC 18<br />
0 0<br />
750 1000 1250 1500 1750 2000 2250 2500 2750<br />
Contaminant Measurement Spotting after<br />
Clean-up using<br />
Dynabeads ® 6 M Urea<br />
RPC 18<br />
Fig. 5. Dynabeads® RPC 18 efficiently remove contaminants from peptide<br />
samples<br />
As a means of demonstrating desalting efficiency a tryptic Bovine Serum<br />
Albumin (BSA) digest (2.5 pmoles) containing 6 M urea, 6 M guanidine, 2 M<br />
NaCl or Digestion Buffer* (50 mM NH 4 HCO 3 , 0.5 M urea, 1 mM DTT, 0.1 % TFA)<br />
was desalted using Dynabeads® RPC 18. The peptide mixture was adsorbed<br />
to Dynabeads® RPC 18, salts were subsequently washed away and peptides<br />
desorbed in 50 % acetonitrile. An aliquot of digest or eluate (1 µl) was mixed<br />
with an equal amount of MALDI matrix (1 µl HCCA) and 0.5 µl of the sample/<br />
matrix mixture spotted onto a MALDI target plate. Data was obtained using<br />
a commercially available MALDI-TOF/TOF MS instrument. An example of<br />
typical spectra are shown (A) and the table (B) summarises the efficiency<br />
of desalting as demonstrated by sequence coverage, Mascot® Scores and<br />
numbers of peptides matched during database searching (n = 6).<br />
m/z<br />
Direct Spotting<br />
onto a<br />
MALDI Target<br />
Sequence Coverage (%) 35 ± 1 No identification<br />
Mascot ® Score 199 ± 7 No identification<br />
Peptides Matched 19 ± 1 No identification<br />
Sequence Coverage (%) 25 ± 2 No identification<br />
Mascot ® 6 M Guanidine<br />
Score 142 ± 10 No identification<br />
Peptides Matched 14 ± 2 No identification<br />
Sequence Coverage (%) 30 ± 8 9 ± 1<br />
Mascot ® 2 M NaCl<br />
Score 170 ± 52 37 ± 8<br />
Peptides Matched 16 ± 4 5 ± 1<br />
Sequence Coverage (%) 40 ± 3 No identification<br />
Mascot ® Digestion<br />
Buffer*<br />
Score 238 ± 19 No identification<br />
Peptides Matched 22 ± 2 No identification
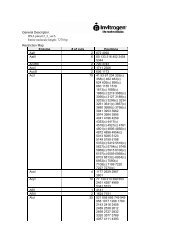
Ordering Information<br />
Product Concentration Volume Product No.<br />
Dynabeads® RPC 18 50 mg / ml 2 ml 102.01<br />
Dynabeads® RPC 18 50 mg / ml 10 ml (5 x 2 ml) 102.02<br />
Dynabeads® RPC Protein 50 mg / ml 2 ml 102.06<br />
Dynabeads® RPC Protein 50 mg / ml 10 ml (5 x 2 ml) 102.07<br />
Dynabeads® WCX 50 mg / ml 2 ml 105.01<br />
Dynabeads® WCX 50 mg / ml 10 ml (5 x 2 ml) 105.02<br />
...more products to come!<br />
© Copyright 2005 Dynal Biotech ASA, Norway. Printed 09.05. All rights reserved.<br />
Dynal ® , Dynabeads® and Dynal MPC® are registered trademarks of Dynal Biotech ASA.<br />
The Dynabeads® products are covered by several international patents and patent applications.<br />
Dynal is an ISO 9001 certified company and is part of <strong>Invitrogen</strong> Corporation.<br />
Dynal will not be responsible for violations or patent infringements that may occur with the use of our products.<br />
DYNAL<br />
invitrogen bead separations<br />
BBS.B.002.01<br />
www.invitrogen.com<br />
www.dynalbiotech.com