Huygens' entry and descent through Titan's atmosphere ...
Huygens' entry and descent through Titan's atmosphere ...
Huygens' entry and descent through Titan's atmosphere ...

You also want an ePaper? Increase the reach of your titles
YUMPU automatically turns print PDFs into web optimized ePapers that Google loves.
1858<br />
Runiv is the universal gas constant (8314.3 J/kmol/K). The<br />
mean molecular mass profile mðzÞ (in kg/kmol) is inferred<br />
from the measured mole fractions of nitrogen f N2 <strong>and</strong><br />
methane f CH4 (GCMS) according to<br />
m ¼ f N2mN2 þ f CH4mCH4 , (15)<br />
where mN2 <strong>and</strong> mCH4 are the molecular masses of N2 <strong>and</strong><br />
CH4, respectively. In Eq. (14) the compressibility factor z<br />
takes into account the deviation of the gas behavior from<br />
an ideal gas due to particle interaction (van der Waals<br />
forces) <strong>and</strong> the effect of a finite molecular volume. In the<br />
altitude ranges from the surface up to about 70 km, Titan’s<br />
<strong>atmosphere</strong> is characterized by a combination of relatively<br />
high densities (on the order of magnitude of<br />
10 4 –10 2 g=cm3 ) <strong>and</strong> low temperatures (100–93 K) which<br />
are both drivers for a deviation of the <strong>atmosphere</strong> from an<br />
ideal gas behavior. For the computation of the compressibility<br />
we restricted ourselves to the second virial<br />
coefficient B2 <strong>and</strong> its relations to z as provided by Dymond<br />
<strong>and</strong> Smith (1992)<br />
z ¼ 1 þ B2 r<br />
. (16)<br />
m<br />
For a gas mixture of N2 <strong>and</strong> CH4 the temperaturedependent<br />
second virial coefficient is derived from<br />
B2ðTÞ ¼f 2<br />
N 2 B2;N 2 ðTÞþf N2 f CH4 B2;CH 4 2N 2 ðTÞ<br />
þ f 2<br />
CH 4 B2;CH 4 ðTÞ, ð17Þ<br />
where B2;N 2 , B2;CH 4 , <strong>and</strong> B2;CH 4 2N 2 are the temperaturedependent<br />
virial coefficients for the various pure gas <strong>and</strong><br />
interaction components, which are evaluated using polynomial<br />
fits of laboratory measurements data as tabulated<br />
by Dymond <strong>and</strong> Smith (1992). Based on the measured<br />
mole fractions from the GCMS measurements <strong>and</strong> the<br />
derived virial coefficients from Eq. (17), values of the<br />
compressibility z are obtained in the range from very close<br />
to 1 (i.e., almost ideal gas behavior) at altitudes above<br />
70 km, decreasing continuously down to values of 0.965<br />
(i.e., a deviation of 3.5% from the ideal gas law) near the<br />
surface.<br />
Multiplying Eq. (14) by dt <strong>and</strong> integrating both sides<br />
yields<br />
Dz ¼ðzi zi 1Þ ¼ 1<br />
g<br />
Runiv T i 1=2z<br />
m<br />
ln Pi<br />
Pi 1<br />
. (18)<br />
The temperature T is considered to be constant<br />
<strong>through</strong>out the altitude interval Dz <strong>and</strong> is approximated<br />
by the mean value of two consecutive measurements, i.e.,<br />
T i 1=2 ¼ 1<br />
2 ðT i þ T i 1Þ. Starting from the initial value z0 at<br />
Titan’s surface the final altitude is derived by simple<br />
addition of the subsequently derived altitude intervals Dz<br />
zi ¼ z0 þ X<br />
Dzi 1. (19)<br />
i<br />
Note that the minus sign in Eq. (18) ensures that for a<br />
reconstruction starting from the surface in an upward<br />
direction the pressure gradient has to be negative (i.e.,<br />
ARTICLE IN PRESS<br />
B. Kazeminejad et al. / Planetary <strong>and</strong> Space Science 55 (2007) 1845–1876<br />
PioPi 1) <strong>and</strong> Dz therefore positive. Assuming a constant<br />
<strong>descent</strong> velocity for the <strong>descent</strong> interval Dz the <strong>descent</strong><br />
velocity is approximated by<br />
_z<br />
Dz<br />
. (20)<br />
Dt<br />
It should also be noted that the altitude profile<br />
reconstructed from Eq. (19) provides the radial probe<br />
distance from the probe impact point neglecting Titan’s<br />
flattening. However, the integration of the equations of<br />
motion during the <strong>entry</strong> phase reconstruction [see Eq. (2)]<br />
provides the distance of the probe to Titan’s center. To<br />
obtain the altitude relative to the surface requires the<br />
assumption of Titan’s radius (2575 km).<br />
Altitude [km] above Impact Point<br />
Altitude [km] above Impact Point<br />
180<br />
160<br />
140<br />
120<br />
100<br />
80<br />
60<br />
40<br />
20<br />
DTWG<br />
+1 α<br />
-1 α<br />
PREDICT<br />
Drogue Impact<br />
0<br />
20 40 60 80 100 120 140<br />
Time [min] past Interface Epoch: UTC: 2005 01 14T09:05:52.523<br />
0.18<br />
0.16<br />
0.14<br />
0.12<br />
0.1<br />
0.08<br />
0.06<br />
0.04<br />
0.02<br />
Flight<br />
RAU 1<br />
RAU 2<br />
SSP APIS<br />
0<br />
151.7 151.8 151.9 152 152.1 152.2 152.3 152.4<br />
Time [min] past Interface Epoch: UTC: 2005 01 14T09:05:52.523<br />
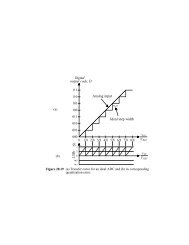
Fig. 12. Upper panel: reconstructed <strong>descent</strong> phase altitude profile based<br />
on the HASI P <strong>and</strong> T, GCMS mole fraction, <strong>and</strong> SSP impact epoch<br />
measurements (solid line, labeled ‘‘DTWG’’) compared to the preflight<br />
trajectory simulation (Pérez-Ayúcar et al., 2004; Kazeminejad et al., 2004)<br />
(dashed line, labeled ‘‘PREDICT’’). The lower panel shows the final<br />
portion of the reconstructed altitude profile prior to impact, compared to<br />
the RAU 1 <strong>and</strong> 2 measurements as well as to the SSP API-S (acoustic<br />
sounder) measurements (solid line with triangles).