Pacific Island Mangroves in a Changing Climate and Rising Sea
Pacific Island Mangroves in a Changing Climate and Rising Sea
Pacific Island Mangroves in a Changing Climate and Rising Sea

Create successful ePaper yourself
Turn your PDF publications into a flip-book with our unique Google optimized e-Paper software.
12<br />
<strong>Mangroves</strong> <strong>in</strong> a Chang<strong>in</strong>g <strong>Climate</strong> <strong>and</strong> Ris<strong>in</strong>g <strong>Sea</strong><br />
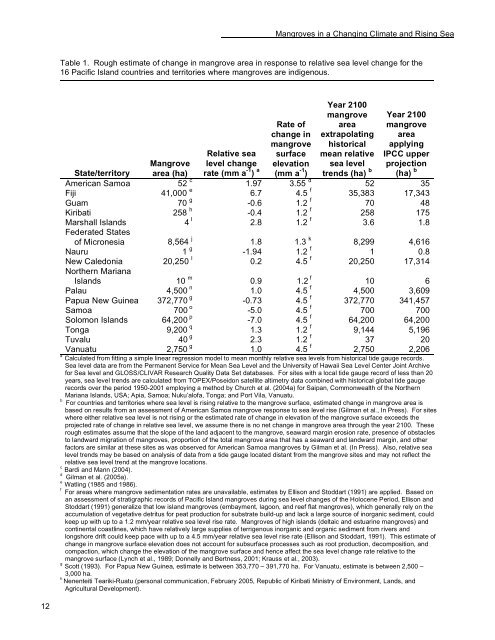
Table 1. Rough estimate of change <strong>in</strong> mangrove area <strong>in</strong> response to relative sea level change for the<br />
16 <strong>Pacific</strong> <strong>Isl<strong>and</strong></strong> countries <strong>and</strong> territories where mangroves are <strong>in</strong>digenous.<br />
Relative sea<br />
level change<br />
Rate of<br />
change <strong>in</strong><br />
mangrove<br />
surface<br />
elevation<br />
Year 2100<br />
mangrove<br />
area<br />
extrapolat<strong>in</strong>g<br />
historical<br />
mean relative<br />
sea level<br />
Year 2100<br />
mangrove<br />
area<br />
apply<strong>in</strong>g<br />
IPCC upper<br />
projection<br />
(ha) b<br />
State/territory<br />
Mangrove<br />
area (ha) rate (mm a -1 ) a<br />
(mm a -1 ) trends (ha) b<br />
American Samoa 52 c 1.97 3.55 d 52 35<br />
Fiji 41,000 e 6.7 4.5 f 35,383 17,343<br />
Guam 70 g -0.6 1.2 f Kiribati 258<br />
70 48<br />
h -0.4 1.2 f Marshall <strong>Isl<strong>and</strong></strong>s 4<br />
258 175<br />
I 2.8 1.2 f 3.6 1.8<br />
Federated States<br />
of Micronesia 8,564 j 1.8 1.3 k 8,299 4,616<br />
Nauru 1 g -1.94 1.2 f 1 0.8<br />
New Caledonia 20,250 l 0.2 4.5 f Northern Mariana<br />
20,250 17,314<br />
<strong>Isl<strong>and</strong></strong>s 10 m 0.9 1.2 f 10 6<br />
Palau 4,500 n 1.0 4.5 f 4,500 3,609<br />
Papua New Gu<strong>in</strong>ea 372,770 g -0.73 4.5 f Samoa 700<br />
372,770 341,457<br />
o -5.0 4.5 f Solomon <strong>Isl<strong>and</strong></strong>s 64,200<br />
700 700<br />
p -7.0 4.5 f 64,200 64,200<br />
Tonga 9,200 q 1.3 1.2 f 9,144 5,196<br />
Tuvalu 40 g 2.3 1.2 f Vanuatu 2,750<br />
37 20<br />
g 1.0 4.5 f 2,750 2,206<br />
a<br />
Calculated from fitt<strong>in</strong>g a simple l<strong>in</strong>ear regression model to mean monthly relative sea levels from historical tide gauge records.<br />
<strong>Sea</strong> level data are from the Permanent Service for Mean <strong>Sea</strong> Level <strong>and</strong> the University of Hawaii <strong>Sea</strong> Level Center Jo<strong>in</strong>t Archive<br />
for <strong>Sea</strong> level <strong>and</strong> GLOSS/CLIVAR Research Quality Data Set databases. For sites with a local tide gauge record of less than 20<br />
years, sea level trends are calculated from TOPEX/Poseidon satellite altimetry data comb<strong>in</strong>ed with historical global tide gauge<br />
records over the period 1950-2001 employ<strong>in</strong>g a method by Church et al. (2004a) for Saipan, Commonwealth of the Northern<br />
Mariana <strong>Isl<strong>and</strong></strong>s, USA; Apia, Samoa; Nuku’alofa, Tonga; <strong>and</strong> Port Vila, Vanuatu.<br />
b<br />
For countries <strong>and</strong> territories where sea level is ris<strong>in</strong>g relative to the mangrove surface, estimated change <strong>in</strong> mangrove area is<br />
based on results from an assessment of American Samoa mangrove response to sea level rise (Gilman et al., In Press). For sites<br />
where either relative sea level is not ris<strong>in</strong>g or the estimated rate of change <strong>in</strong> elevation of the mangrove surface exceeds the<br />
projected rate of change <strong>in</strong> relative sea level, we assume there is no net change <strong>in</strong> mangrove area through the year 2100. These<br />
rough estimates assume that the slope of the l<strong>and</strong> adjacent to the mangrove, seaward marg<strong>in</strong> erosion rate, presence of obstacles<br />
to l<strong>and</strong>ward migration of mangroves, proportion of the total mangrove area that has a seaward <strong>and</strong> l<strong>and</strong>ward marg<strong>in</strong>, <strong>and</strong> other<br />
factors are similar at these sites as was observed for American Samoa mangroves by Gilman et al. (In Press). Also, relative sea<br />
level trends may be based on analysis of data from a tide gauge located distant from the mangrove sites <strong>and</strong> may not reflect the<br />
relative sea level trend at the mangrove locations.<br />
c<br />
Bardi <strong>and</strong> Mann (2004).<br />
d Gilman et al. (2005a).<br />
e Watl<strong>in</strong>g (1985 <strong>and</strong> 1986).<br />
f For areas where mangrove sedimentation rates are unavailable, estimates by Ellison <strong>and</strong> Stoddart (1991) are applied. Based on<br />
an assessment of stratigraphic records of <strong>Pacific</strong> <strong>Isl<strong>and</strong></strong> mangroves dur<strong>in</strong>g sea level changes of the Holocene Period, Ellison <strong>and</strong><br />
Stoddart (1991) generalize that low isl<strong>and</strong> mangroves (embayment, lagoon, <strong>and</strong> reef flat mangroves), which generally rely on the<br />
accumulation of vegetative detritus for peat production for substrate build-up <strong>and</strong> lack a large source of <strong>in</strong>organic sediment, could<br />
keep up with up to a 1.2 mm/year relative sea level rise rate. <strong>Mangroves</strong> of high isl<strong>and</strong>s (deltaic <strong>and</strong> estuar<strong>in</strong>e mangroves) <strong>and</strong><br />
cont<strong>in</strong>ental coastl<strong>in</strong>es, which have relatively large supplies of terrigenous <strong>in</strong>organic <strong>and</strong> organic sediment from rivers <strong>and</strong><br />
longshore drift could keep pace with up to a 4.5 mm/year relative sea level rise rate (Ellison <strong>and</strong> Stoddart, 1991). This estimate of<br />
change <strong>in</strong> mangrove surface elevation does not account for subsurface processes such as root production, decomposition, <strong>and</strong><br />
compaction, which change the elevation of the mangrove surface <strong>and</strong> hence affect the sea level change rate relative to the<br />
mangrove surface (Lynch et al., 1989; Donnelly <strong>and</strong> Bertness, 2001; Krauss et al., 2003).<br />
g Scott (1993). For Papua New Gu<strong>in</strong>ea, estimate is between 353,770 – 391,770 ha. For Vanuatu, estimate is between 2,500 –<br />
3,000 ha.<br />
h Nenenteiti Teariki-Ruatu (personal communication, February 2005, Republic of Kiribati M<strong>in</strong>istry of Environment, L<strong>and</strong>s, <strong>and</strong><br />
Agricultural Development).