Presentation - Lenovo
Presentation - Lenovo
Presentation - Lenovo

You also want an ePaper? Increase the reach of your titles
YUMPU automatically turns print PDFs into web optimized ePapers that Google loves.
<strong>Lenovo</strong> Group Limited<br />
2006/07 Annual Results<br />
May 23, 2007<br />
<strong>Lenovo</strong> Confidential | © 2007 <strong>Lenovo</strong>
Mary Ma<br />
Senior Vice President & Chief Financial Officer<br />
<strong>Lenovo</strong> Confidential | © 2007 <strong>Lenovo</strong>
<strong>Lenovo</strong> Financial Summary<br />
Turnover<br />
Q4 2006/07 Q4 2005/06 2006/07 Full Year*<br />
US$ mn % Y/Y Q/Q US$ mn % US$ mn % Y/Y<br />
3,416 9.3% -14.5% 3,125 14,590<br />
9.9%<br />
Gross Profit 518 15.2% +1.2 pts +1.7 pts 437 14.0% 2,037 14.0% -<br />
Operating Expenses (460) 13.5% -1.1 pts +1.7 pts (456) 14.6% (1,838) 12.6% -<br />
Other (Exp)/Income** (4) 0.1%<br />
(21) 0.7% 1 0.0%<br />
Pre-tax Income/(Loss)<br />
before restructuring cost<br />
Net Restructuring Cost<br />
Reversed /(Cost)<br />
54<br />
12<br />
(40) (1.3%) 200 1.4% 29.0%<br />
Pre-tax Income/(Loss) 66 1.9% N/A 3.1% (110) (3.5%) 188 1.3% 122.0%<br />
Profit/(Loss) Attributable to<br />
Shareholders<br />
EPS (US cents)<br />
60<br />
<strong>Lenovo</strong> Confidential | © 2007 <strong>Lenovo</strong><br />
3<br />
(12)<br />
(116) (3.7%) 161 1.1% 625.5%<br />
- Basic 0.70<br />
N/A 4.5% (1.30) 1.87<br />
640.4%<br />
- Diluted 0.68 N/A 5.8% (1.29) 1.84 645.0%<br />
Dividend per share<br />
(HK cents)<br />
2.8<br />
1.4%<br />
1.8%<br />
N/A<br />
N/A<br />
Proposed Final<br />
-18.2%<br />
3.4%<br />
(70)<br />
2.8 Final 5.2 Proposed Total<br />
* Included only 11 months of contribution from acquired IBM’s personal computer business in FY2005/06 for comparison<br />
** Including finance income, finance cost and share of profits/(losses) of jointly controlled entities and associated companies
Cash and Working Capital<br />
US$mn Q4 2006/07 Q4 2005/06 FY 2006/07 FY 2005/06<br />
EBITDA* 117 32 414 382<br />
Cash Reserves 1,064 1,005 1,064 1,005<br />
Total Bank Borrowings 118 228 118 228<br />
Net Cash Reserves 946 777 946 777<br />
Days Inventory 13 14 11 10<br />
Days Receivable 25 23 23 21<br />
Days Payable 72 73 61 59<br />
Cash Conversion Cycle -34 days -36 days -27 days -28 days<br />
* Excluding restructuring charges<br />
<strong>Lenovo</strong> Confidential | © 2007 <strong>Lenovo</strong><br />
4
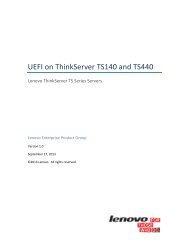
Revenue Breakdown (FY 2006/07)<br />
Balanced Geographic Mix Strong Notebook Mix<br />
EMEA<br />
21.0%<br />
(20.9%)<br />
Asia<br />
Pacific Ex<br />
GC<br />
12.5%<br />
(12.6%)<br />
Americas<br />
28.2%<br />
(29.8%)<br />
Greater<br />
China<br />
38.3%<br />
(36.7%)<br />
Desktop<br />
41.9%<br />
(44.8%)<br />
Mobile<br />
Handset<br />
4.2%<br />
(4.4%)<br />
2005/06 full year figures are in bracket<br />
* Others include servers, printers, digital products, etc.<br />
Others*<br />
1.4%<br />
(1.9%)<br />
Notebook<br />
52.5%<br />
(48.9%)<br />
<strong>Lenovo</strong> Confidential | © 2007 <strong>Lenovo</strong><br />
5
Q4 Geography Summary (Excluding restructuring charge)<br />
• Gained share across all geographies<br />
• All geographies posted YTY revenue growth and positive segment profit<br />
• Significant improvement on group’s overall segment profit margin in Q4<br />
Turnover<br />
US$ mn<br />
Segment Operating Profit<br />
US$ mn<br />
Segment Operating<br />
Profit Margin<br />
Q4 07 YTY Q3 07 Q4 07 Q4 06 Q3 07 Q4 07 Q4 06 Q307<br />
Greater China 1,215 12.7% 1,583 72 52 81 5.9% 4.8% 5.1%<br />
Americas 997 5.6% 1,042 16 (32) (3) 1.6% -3.4% -0.3%<br />
EMEA 731 10.8% 913 18 (11) 15 2.5% -1.7% 1.6%<br />
AP (ex GC) 473 6.8% 460 2 8 5 0.4% 1.8% 1.0%<br />
Total 3,416 9.3% 3,998 108 17 98 3.2% 0.5% 2.4%<br />
<strong>Lenovo</strong> Confidential | © 2007 <strong>Lenovo</strong><br />
6
FY2006/07 Geography Summary (Excluding restructuring charge)<br />
• Strong improvement on Greater China and EMEA profitability<br />
• Americas returned to profit in Q4<br />
Turnover Segment Operating Profit Segment Operating<br />
US$ mn US$ mn Profit Margin<br />
FY2006/07 FY2005/06* YTY FY2006/07 FY2005/06* FY2006/07 FY2005/06*<br />
Greater China 5,581 4,871 14.6% 330 279 5.9% 5.7%<br />
Americas 4,119 3,962 4.0% (29) 52 -0.7% 1.3%<br />
EMEA 3,057 2,771 10.3% 21 (13) 0.7% -0.5%<br />
AP (ex GC) 1,833 1,672 9.6% 5 (1) 0.3% -0.1%<br />
Total 14,590 13,276 9.9% 327 317 2.2% 2.4%<br />
* Included only 11 months of contribution from acquired IBM’s personal computer business in FY2005/06<br />
<strong>Lenovo</strong> Confidential | © 2007 <strong>Lenovo</strong><br />
7
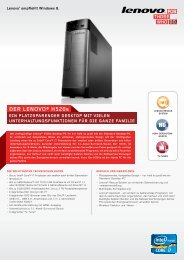
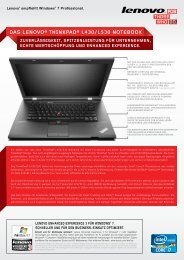
Greater China Strengthened Market Leadership<br />
• Strong Q4 performance<br />
– Operating profit margin 5.9%<br />
– Mainland China<br />
• PC shipments up 24%<br />
• Estimated PC market share 31.6%<br />
• Share gain of 0.3 pts YTY<br />
• 2006/07 Key Focus<br />
– Transaction model: growth in consumer/SMB<br />
– Supply chain: best of breed<br />
– Desktop: strong growth with good margin<br />
– Brand: closer tie with Olympics<br />
Source: Market share is based on industry and company estimates<br />
<strong>Lenovo</strong> Confidential | © 2007 <strong>Lenovo</strong><br />
8<br />
40%<br />
30%<br />
20%<br />
1,800<br />
1,500<br />
1,200<br />
900<br />
600<br />
300<br />
0<br />
<strong>Lenovo</strong> PC Market Share (Mainland China)<br />
31.2%<br />
31.7% 32.1%<br />
29.6%<br />
34.5%<br />
33.8%<br />
35.8%<br />
31.3%<br />
35.1%<br />
35.5%<br />
36.1%<br />
31.6%<br />
2004/05 2005/06 2006/07<br />
* FY2004/05 market share information reflects combined shares<br />
of <strong>Lenovo</strong> and IBM PCD<br />
US$ mn <strong>Lenovo</strong> Greater China Turnover<br />
FY06 Q4 FY07 Q1 FY07 Q2 FY07 Q3 FY07 Q4<br />
Revenue Segment Profit %<br />
8%<br />
7%<br />
6%<br />
5%<br />
4%<br />
3%<br />
2%<br />
1%<br />
0%
Americas, EMEA and AP (ex. GC)<br />
• Americas<br />
– Q4 PC shipments up 9% YTY<br />
– Gained shares in the U.S.<br />
– Sales coverage transition from IBM completed smoothly<br />
– Recruited approx. 2,600 active partners for transaction model<br />
– Returned to profit since Q3 2005/06<br />
• EMEA<br />
– Q4 PC shipments up 14% YTY<br />
– Gain share, driven by desktop<br />
– Solid margin, operating profit margin improved to 2.5%<br />
– Transaction model continued to drive strong growth in Germany<br />
• Asia Pacific (ex. GC)<br />
– Q4 PC shipments up 18% YTY<br />
– Consumer PC launch in ASEAN gained traction<br />
– Strong shipment growth in India<br />
<strong>Lenovo</strong> 3000 N100<br />
<strong>Lenovo</strong> Confidential | © 2007 <strong>Lenovo</strong><br />
9
Notebook and Desktop Q4 2006/07<br />
Revenue<br />
Unit Growth YTY<br />
• US$1.9 billion, up 17% YTY<br />
• 55% of total<br />
• 29%<br />
Notebook<br />
• In line with market<br />
• US$1.4 billion, up 4% YTY<br />
• 41% of total<br />
• 11%<br />
Desktop<br />
• Grew faster than market<br />
Comments • Strengths in Asia and China<br />
• Driven by Greater China and EMEA<br />
• Solid margin<br />
• Positive PTI<br />
• Top rankings in TBR’s report of<br />
notebook brand awareness and<br />
customer satisfaction<br />
• Good trends but more to do<br />
ThinkPad X60 <strong>Lenovo</strong> Tianjiao Consumer PC<br />
<strong>Lenovo</strong> Confidential | © 2007 <strong>Lenovo</strong><br />
10
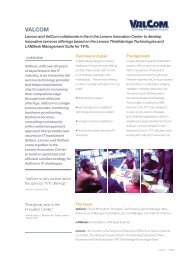
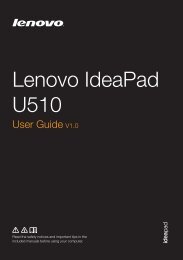
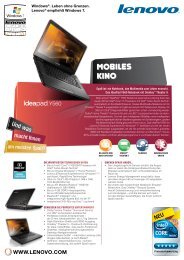
Mobile Handset Q4 2006/07<br />
• Unit shipments up 12% YTY<br />
• Revenue US$126 million, down 21% YTY<br />
• Maintained #4 position with 6.5% market share<br />
v350 i807<br />
i360<br />
<strong>Lenovo</strong> Confidential | © 2007 <strong>Lenovo</strong><br />
11<br />
8%<br />
7%<br />
6%<br />
5%<br />
4%<br />
3%<br />
2%<br />
1%<br />
0%<br />
No. 21<br />
<strong>Lenovo</strong> Market Handset<br />
Market Share & Rank in China<br />
No. 19<br />
No. 10<br />
No. 4<br />
No. 4<br />
Mar-03 Mar-04 Mar-05 Mar-06 Mar-07<br />
Source: Market performance is based on industry and company<br />
estimates of mobile handset market (CDMA and GSM) in China
Summary<br />
• 2006/07 Full Year<br />
– Maintain market share<br />
• WW PC shipments up 12%, gaining share<br />
• Ranked #3 with 7.4% for 2006/07 fiscal year<br />
– Sustain profitability<br />
• Gross margin sustained at 14.0%<br />
• PTI* surged 29%<br />
– Improve efficiency<br />
• Improving global supply chain<br />
• Additional efforts to improve efficiency<br />
* Excluding restructuring charges<br />
<strong>Lenovo</strong> Confidential | © 2007 <strong>Lenovo</strong><br />
12
William Amelio<br />
President & Chief Executive Officer<br />
<strong>Lenovo</strong> Confidential | © 2007 <strong>Lenovo</strong>
Global Operational Excellence Strategic Initiatives<br />
Transaction Model Roll-out<br />
Supply Chain<br />
Desktop Competitiveness<br />
Brands<br />
<strong>Lenovo</strong> Confidential | © 2007 <strong>Lenovo</strong><br />
14
Global Operational Excellence Strategic Initiatives<br />
1. Transaction Model Roll-out<br />
• Strong performance in Q4<br />
– Volume +19% YTY<br />
– Revenue +13% YTY<br />
• Solid progress from pilot countries<br />
– Volume and profitability growth<br />
• Germany +50%<br />
• France +17%<br />
• UK +36%<br />
• Italy +18%<br />
• FY 2007/08 roll-out plans<br />
– US, Japan, Eastern Europe, Latin<br />
America, MEA<br />
<strong>Lenovo</strong> Confidential | © 2007 <strong>Lenovo</strong><br />
15
Global Operational Excellence Strategic Initiatives<br />
Relationship Model Update<br />
• Improvement in revenue, profitability<br />
– 4 of 4 geographies profitable<br />
• Identifying & capturing new opportunities<br />
– New go-to-market model<br />
– New SAP CRM<br />
– Investment in processes/resources<br />
• Sales force transition complete<br />
– Improved pipeline<br />
– Reduced costs<br />
– Favorable customer response<br />
<strong>Lenovo</strong> Confidential | © 2007 <strong>Lenovo</strong><br />
16
Global Operational Excellence Strategic Initiatives<br />
Relationship Model Update: Worldwide Customers<br />
PGA Tour<br />
<strong>Lenovo</strong> Confidential | © 2007 <strong>Lenovo</strong><br />
17<br />
Korea
<strong>Lenovo</strong>/IBM Partnership<br />
• Partnership is successful and growing<br />
– <strong>Lenovo</strong> is IBM preferred Global PC Partner<br />
– Customer and Business Partner Financing Partnership<br />
– New Global Technology Services Alliance<br />
• IBM is <strong>Lenovo</strong>’s largest customer relationship<br />
– Internal sales to IBM workforce<br />
– Sales supporting customer service contracts<br />
• <strong>Lenovo</strong>/IBM services partnership continues to grow<br />
– Strategic IT services contract<br />
– Global HR services contract<br />
– Core customer service/field support agreement<br />
<strong>Lenovo</strong> Confidential | © 2007 <strong>Lenovo</strong><br />
18
Global Operational Excellence Strategic Initiatives<br />
2. Supply Chain Upgrade<br />
• Overall cost and efficiency improvements<br />
– Manufacturing efficiencies<br />
– Lean re-engineering<br />
– Complexity reduction<br />
– Improved logistics<br />
– Enhanced supplier relationships<br />
• International serviceability greatly enhanced<br />
– FY: up 44%<br />
– 4Q: up 24%<br />
<strong>Lenovo</strong> Confidential | © 2007 <strong>Lenovo</strong><br />
19
Global Operational Excellence Strategic Initiatives<br />
3. Desktop Competitiveness<br />
• YTY W/W share gain for 7 consecutive quarters<br />
• Q4 desktop shipments up >10% YTY<br />
• Q4 share gain driven by<br />
– Emerging markets, and<br />
– Developed markets: US & W. Europe<br />
• Return to profit, positive PTI FY 06/07<br />
<strong>Lenovo</strong> Confidential | © 2007 <strong>Lenovo</strong><br />
20
<strong>Lenovo</strong> Services, Software & Peripherals Business Units<br />
<strong>Lenovo</strong> Services<br />
• Revenue, PTI growth<br />
• Contract signings up 71%<br />
• ThinkPad notebooks tied for #1 by TBR<br />
Software & Peripherals<br />
• Revenue up 28%<br />
– Every geography showing YOY growth<br />
– Higher overall attach rate<br />
• Next steps<br />
– Optimize portfolio of offerings<br />
– Expand routes to market<br />
– Leverage alliance partnerships<br />
<strong>Lenovo</strong> Confidential | © 2007 <strong>Lenovo</strong><br />
21
Global Operational Excellence Strategic Initiatives<br />
4. Brand Building<br />
• AT&T Williams Formula One Sponsorship<br />
– Largest annual sporting event in the world<br />
– Races in 17 countries on 5 continents<br />
– Over 200 million viewers per race<br />
• <strong>Lenovo</strong> design chosen for Olympic Torch<br />
• Improving metrics/brand awareness<br />
• Coming attractions<br />
– High-end “Reserve Edition” ThinkPad<br />
– “Best-Engineered” campaign<br />
<strong>Lenovo</strong> Confidential | © 2007 <strong>Lenovo</strong><br />
22
Global Operational Excellence Strategic Initiatives<br />
Brand Building: The Best-Engineered PCs<br />
<strong>Lenovo</strong> Confidential | © 2007 <strong>Lenovo</strong><br />
23
Global Operational Excellence Strategic Initiatives<br />
Brand Building: Compelling, Innovative Products<br />
• “Best Engineering” at work<br />
– Top Cover Roll Cage<br />
• Rock solid reliability & durability<br />
– Ultra Connect II<br />
• Improved wireless connectivity<br />
– Quieter “Owl’s Wing” Cooling System<br />
• Lowers temp up to 10%<br />
• Lowers noise level by 3 decibels<br />
– Battery Stretch<br />
• Longer battery life up to 15% longer<br />
• Setting standard for innovation & reliability<br />
<strong>Lenovo</strong> Confidential | © 2007 <strong>Lenovo</strong><br />
24
Looking Forward: 2007/08 Objectives<br />
• Drive top-line growth<br />
– Strategic initiatives<br />
– China<br />
– Other emerging markets<br />
– Transaction model<br />
• SMB/VSB/consumer segments<br />
– Expand product portfolio<br />
• Improve global operational efficiency<br />
<strong>Lenovo</strong> Confidential | © 2007 <strong>Lenovo</strong><br />
25
<strong>Lenovo</strong> Confidential | © 2007 <strong>Lenovo</strong><br />
26
Yang Yuanqing<br />
Chairman of the Board<br />
<strong>Lenovo</strong> Confidential | © 2007 <strong>Lenovo</strong>
Steady FY2006/07 Performance, Strong Strategic<br />
Execution, Good Results<br />
• Maintain and fully leverage the current business in China and global<br />
large enterprise<br />
• Gain share in transaction and emerging market<br />
• Build an excellent culture and team<br />
<strong>Lenovo</strong> Confidential | © 2007 <strong>Lenovo</strong><br />
28
PC Growth Engines: China, SMB/Consumer in Mature<br />
Markets, and Emerging Markets<br />
Expected Industry Growth (Million Units)<br />
~76M incremental<br />
units over 3 years<br />
245<br />
221 25<br />
2006<br />
2007<br />
273<br />
53<br />
2008<br />
Source: Company and industry estimates<br />
297<br />
76<br />
2009<br />
CAGR = 10%<br />
Russia<br />
Mexico<br />
Brazil<br />
Mature RM<br />
Source of Growth<br />
ROW<br />
100% = 76M Units<br />
Mature SMB<br />
China<br />
<strong>Lenovo</strong> Confidential | © 2007 <strong>Lenovo</strong><br />
29<br />
India<br />
MEA<br />
7%<br />
7%<br />
4% 4%<br />
9%<br />
8%<br />
Mature Consumer
Business Growth Strategy<br />
China<br />
– Drive Olympic related opportunities<br />
– Achieving breakthrough in notebook market<br />
– Thoroughly develop small cities and towns<br />
– Enhancing competitiveness of non-PC business<br />
Mature Markets<br />
– Maintain relationship business<br />
– Develop forcefully transaction business<br />
Emerging Markets<br />
– Quickly roll-out China consumer products and product operation model<br />
– Replicate the end-to-end integrated business model<br />
Consumer Business<br />
– Back-end of China + Front-end of large retail chain<br />
<strong>Lenovo</strong> Confidential | © 2007 <strong>Lenovo</strong><br />
30
<strong>Lenovo</strong> Confidential | © 2007 <strong>Lenovo</strong><br />
31
Appendix<br />
• Income Statement<br />
• Balance Sheet<br />
• Cash Flow Statement<br />
<strong>Lenovo</strong> Confidential | © 2007 <strong>Lenovo</strong>
Consolidated Income Statement<br />
2006/07 2006/07 2005/06 2005/06<br />
US$ Million Q4 Full Year Q4 Full Year*<br />
Turnover 3,416<br />
14,590<br />
3,125<br />
13,276<br />
Cost of sales (2,898) (12,553)<br />
(2,688) (11,417)<br />
Gross profit 518<br />
2,037<br />
437<br />
1,859<br />
Other income/(expense) - net (2)<br />
8<br />
(8)<br />
(8)<br />
Selling and distribution expenses (263)<br />
(1,114)<br />
(271)<br />
(1,028)<br />
Administrative expenses (141)<br />
(499)<br />
(130)<br />
(434)<br />
Research and development expenses (58)<br />
(227)<br />
(55)<br />
(195)<br />
Other operating income/(expense) - net 14<br />
(10)<br />
(70)<br />
(82)<br />
Operating profit 68<br />
195<br />
(97)<br />
112<br />
Finance income 7<br />
26<br />
8<br />
24<br />
Finance costs (9)<br />
(35)<br />
(21)<br />
(52)<br />
Share of profits of jointly controlled entities - - - -<br />
Share of profits of associated companies 0.10<br />
2<br />
(0.02)<br />
0.50<br />
Profit before taxation 66<br />
188<br />
(110)<br />
84<br />
Taxation (6)<br />
(27)<br />
(6)<br />
(57)<br />
Profit for the year 60<br />
161<br />
(116)<br />
27<br />
Profit attributable to:<br />
Shareholders of the Company 60<br />
161<br />
(116)<br />
22<br />
Minority interests - - - 5<br />
60<br />
161<br />
(116)<br />
27<br />
Dividend - 59<br />
32<br />
59<br />
Earnings per share<br />
- Basic 0.70 US cents 1.87 US cents (1.30) US cents 0.25 US cents<br />
- Diluted 0.68 US cents 1.84 US cents (1.29) US cents 0.25 US cents<br />
* Included only 11 months of contribution from acquired IBM’s personal computer business in FY2005/06<br />
<strong>Lenovo</strong> Confidential | © 2007 <strong>Lenovo</strong><br />
33
Condensed Balance Sheet<br />
As at As at<br />
US$ Million Mar 31, 2007 Mar 31, 2006<br />
Non-current assets 2,388 2,305<br />
Current assets 3,061 2,736<br />
Total assets 5,449 5,041<br />
Shareholders' funds 1,133 1,044<br />
Minority interests 1 1<br />
Total equity 1,134 1,045<br />
Non-current liabilities 789 814<br />
Current liabilities 3,526 3,182<br />
Total liabilities 4,315 3,996<br />
Total equity and liabilities 5,449 5,041<br />
Net current liabilities 465 446<br />
Total assets less current liabilities 1,923 1,859<br />
<strong>Lenovo</strong> Confidential | © 2007 <strong>Lenovo</strong><br />
34
Condensed Consolidated Cash Flow Statement<br />
2006/07 2005/06<br />
US$ Million Full Year Full Year<br />
Net cash generated from operating activities 538 1,076<br />
Net cash used in investing activities -205 -772<br />
Net cash (used in)/generated from financing activities -290 305<br />
Increase in cash and cash equivalents 43 609<br />
Effect of foreign exchange rate changes 16 9<br />
Cash and cash equivalents at the beginning of the year 1,005 387<br />
Cash and cash equivalents at the end of the year 1,064 1,005<br />
<strong>Lenovo</strong> Confidential | © 2007 <strong>Lenovo</strong><br />
35