Research report_Apollo Tyres Ltd_ 05122012 - Karvy
Research report_Apollo Tyres Ltd_ 05122012 - Karvy
Research report_Apollo Tyres Ltd_ 05122012 - Karvy

Create successful ePaper yourself
Turn your PDF publications into a flip-book with our unique Google optimized e-Paper software.
<strong>Apollo</strong> <strong>Tyres</strong> Limited<br />
Why<br />
Investment rationale<br />
Global presence: <strong>Apollo</strong> <strong>Tyres</strong> <strong>Ltd</strong> (<strong>Apollo</strong>) operates through seven manufacturing<br />
facilities and a wide distribution network spread across India, Africa and Europe. In<br />
FY12, its Indian operations contributed 66% of the revenues, European operations<br />
23% and African operations 11%. It sells its products in 118 countries across the<br />
world. <strong>Apollo</strong> Vredestein – its European arm is agile enough to distribute its products<br />
within 90% of Europe in 24 hours.<br />
Capacity expansions: <strong>Apollo</strong> is going ahead with significant capacity additions to<br />
meet the future demand – Chennai plant from 200 MT per day to 500 MT per day,<br />
Netherlands plant to 7.5 million tyres per annum from 5.5 million tyres annum,<br />
installation of a component preparation unit in South Africa to expand its commercial<br />
vehicle capacity at Durban by 20%, the Ladysmith passenger vehicle and light truck<br />
tyre capacity by 30% and also conversion of truck-bus cross ply facility in Kerala<br />
plant to an industrial and specialty tyres/OHT facility. It also has plans to set up green<br />
field plants in South East Asia and Europe in the coming five years.<br />
Replacement demand vs. OEM Demand: On a consolidated basis, the company<br />
earns its revenues mostly from the replacement market. The ratio of Original<br />
Equipment Manufacturers (OEM) to replacement was 27% and 73% respectively in<br />
FY12. The OEM demand is currently subdued. However, the replacement market<br />
with a steady growth rate is likely to offset the negative impact.<br />
Beneficiary of radialisation in TBR segment: Radialisation has been nearly<br />
achieved for passenger vehicle segment. However, it is relatively very low in the<br />
commercial vehicle segment. Radial trends are expected to be at the forefront of<br />
revenues for tyre manufacturing companies. <strong>Apollo</strong>, being the market leader in the<br />
commercial vehicles segment and having the largest radial tyre capacity in India<br />
(FY12) is expected to benefit from this trend and it has ramped up its Chennai plant<br />
to meet the increasing demand in Truck and Bus Radials (TBR) segment.<br />
Strong brand portfolio: <strong>Apollo</strong> has a comprehensive portfolio comprising six<br />
brands-<strong>Apollo</strong>, Vredestein, Dunlop, Regal, Kaizen and Maloya. Vredestein<br />
commands a premium position in ultra-high performance (UHP) and winter segments<br />
of passenger vehicle tyres in Europe. Dunlop is sold in 32 African countries.<br />
Fall in natural rubber prices: Tyre industry is highly sensitive to changes in natural<br />
rubber prices that have fluctuated widely in FY12, ranging between Rs230/kg in April<br />
2011 to Rs190/kg in March 2012. However, the prices have shown a declining trend<br />
and stabilized in the first half of FY13. This is expected to benefit <strong>Apollo</strong>.<br />
Emerging market leader with diversified product profile: <strong>Apollo</strong> is ranked 15 th<br />
among the top global tyre manufacturers. The company has a diversified product<br />
profile ranging from tyres for trucks/buses and light commercial vehicles (LCV) to<br />
passenger vehicles and off-highway vehicles. It’s the market leader in the truck/bus<br />
and LCV segments commanding a market share of nearly 27% and third in<br />
passenger car segment with a market share of nearly 17% in India.<br />
Valuations & outlook<br />
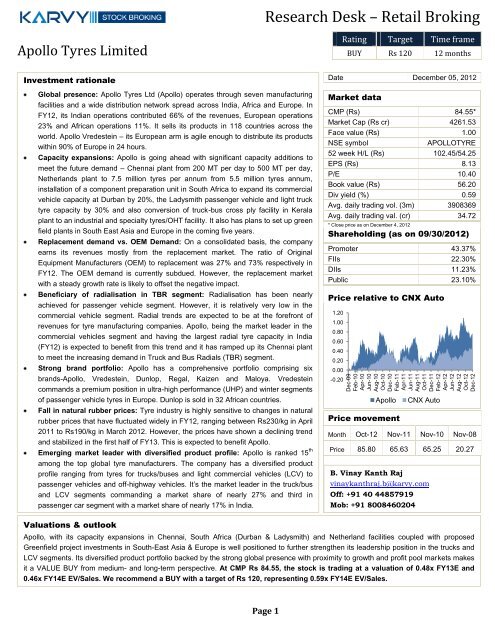
<strong>Research</strong> Desk – Retail Broking<br />
Page 1<br />
Rating Target Time frame<br />
BUY Rs 120 12 months<br />
Date December 05, 2012<br />
Market data<br />
CMP (Rs) 84.55*<br />
Market Cap (Rs cr) 4261.53<br />
Face value (Rs) 1.00<br />
NSE symbol APOLLOTYRE<br />
52 week H/L (Rs) 102.45/54.25<br />
EPS (Rs) 8.13<br />
P/E 10.40<br />
Book value (Rs) 56.20<br />
Div yield (%) 0.59<br />
Avg. daily trading vol. (3m) 3908369<br />
Avg. daily trading val. (cr) 34.72<br />
* Close price as on December 4, 2012<br />
Shareholding (as on 09/30/2012)<br />
Promoter 43.37%<br />
FIIs 22.30%<br />
DIIs 11.23%<br />
Public 23.10%<br />
Price relative to CNX Auto<br />
1.20<br />
1.00<br />
0.80<br />
0.60<br />
0.40<br />
0.20<br />
0.00<br />
-0.20<br />
Dec-09<br />
Feb-10<br />
Apr-10<br />
Jun-10<br />
Aug-10<br />
Oct-10<br />
Dec-10<br />
Feb-11<br />
Apr-11<br />
Jun-11<br />
Aug-11<br />
Oct-11<br />
Dec-11<br />
Feb-12<br />
Apr-12<br />
Jun-12<br />
Aug-12<br />
Oct-12<br />
Dec-12<br />
Price movement<br />
<strong>Apollo</strong> CNX Auto<br />
Month Oct-12 Nov-11 Nov-10 Nov-08<br />
Price 85.80 65.63 65.25 20.27<br />
B. Vinay Kanth Raj<br />
vinaykanthraj.b@karvy.com<br />
Off: +91 40 44857919<br />
Mob: +91 8008460204<br />
<strong>Apollo</strong>, with its capacity expansions in Chennai, South Africa (Durban & Ladysmith) and Netherland facilities coupled with proposed<br />
Greenfield project investments in South-East Asia & Europe is well positioned to further strengthen its leadership position in the trucks and<br />
LCV segments. Its diversified product portfolio backed by the strong global presence with proximity to growth and profit pool markets makes<br />
it a VALUE BUY from medium- and long-term perspective. At CMP Rs 84.55, the stock is trading at a valuation of 0.48x FY13E and<br />
0.46x FY14E EV/Sales. We recommend a BUY with a target of Rs 120, representing 0.59x FY14E EV/Sales.
QIP Issue & its impact on financial estimates<br />
Page 2<br />
<strong>Apollo</strong> <strong>Tyres</strong> <strong>Ltd</strong><br />
The company, in its Board of Directors meeting held on 1 st October, 2012, considered and approved, the qualified<br />
institutions placement to QIBs up to US$ 150 million or Rs 800 crore, subject to the approval of shareholders to be sought<br />
through postal ballot u/s 192 (A) of the Companies Act, 1956. Subsequently, on 6 th November, 2012, the company’s<br />
shareholders have passed a special resolution giving their consent to the board to create, offer, issue and allot, at its<br />
absolute discretion, equity shares for cash for an aggregate amount not exceeding US$150 million (equivalent to approx.<br />
Rs 800 crore), to be listed on one or more stock exchanges in India, in one or more tranches, with or without an overallotment<br />
option to QIBs. The allotment of the equity shares to QIBs pursuant to this resolution shall be completed within<br />
12 months of the date of approval by shareholders.<br />
Considering, the size of issue and keeping the time limits in view, we have drawn two sets of financials giving an effect to<br />
equity issue to QIBs. Taking the further formalities into account, such as seeking approval from stock exchanges for listing<br />
of shares, issue of draft/final offer document and other pre & post issue formalities, we presumed that the issue would<br />
impact FY14 financials.<br />
Scenario 1 – Without QIP<br />
Presuming that the company does not raise an amount of USD150 million (equivalent to approx. Rs 800 crore) through<br />
the QIP issue, we have drawn the financials for FY14 in an usual trend extending the financial position as on FY13 to the<br />
subsequent period with general adjustments with the operations of the company.<br />
Scenario 2 – With proposed QIP<br />
Presuming that the company decides to raise the amount of USD150 million (equivalent to approx. Rs 800 crore) via the<br />
QIP issue in FY14, based on the information available, together with the internal accruals, the funds raised would be<br />
utilized for the following expansions, over a period of five years:<br />
Setting up a Greenfield plant in South East Asia in Thailand or Indonesia in two phases.<br />
o The initial capacity of the plant will be 16,000 units of passenger car radials (PCRs) per day and 1,500<br />
units of truck and bus radials a day (TBRs) and subsequently would be increased to a capacity of<br />
24,000 units of PCRs per day and 3,000 units of TBRs a day in the second phase.<br />
o Phase I would require an investment of around USD 250-300 million (equivalent to approx. Rs1375 to<br />
Rs1650 crore) and Phase II an investment of USD 200 million (equivalent to approx. Rs1100 crore).<br />
o This plant would cater mainly to the ASEAN (Association of South-East Asian Nations) countries and<br />
20% of the production would be exported to Europe and Latin America.<br />
Setting up a Greenfield plant in Eastern Europe with an investment of around USD350 million (equivalent to<br />
approx Rs1925 crore) for production of passenger car radials (PCRs) with a capacity of 7 million units per<br />
annum.<br />
Conversion of Kalamassery plant in Kerala from truck & bus tyres to off-highway tyres (OHTs) with an investment<br />
of around Rs200 crores to cater to export markets, like USA, Europe, Australia and Latin America (85% of<br />
production) and balance 15% production to Indian markets.<br />
Capacity expansion in Netherlands plant (Vredestein) to 7.5 million units per annum from the current 6 million<br />
units per annum with an investment of around Euro 50 million or Rs355 crore.<br />
Revenue estimates for FY14<br />
In our estimates for FY14, we have made additions to revenue on the expectation that the benefits of capacity expansion<br />
in Netherland plant would be fully realized from the last quarter of FY14. And, coming to the South East Asian and<br />
European expansions, which are in the nature of Greenfield projects, revenue inflows are expected to flow-in only in the<br />
subsequent periods.
Scenario 1<br />
Financial estimates (Without QIP)<br />
Page 3<br />
<strong>Apollo</strong> <strong>Tyres</strong> <strong>Ltd</strong><br />
Profit and loss account (Rs cr)<br />
Particulars FY 08 FY 09 FY 10 FY 11 FY 12 FY 13E FY 14E<br />
Net sales 4,691.24 4,984.07 8,120.74 8,867.72 12,153.29 13954.93 15513.51<br />
Stock in trade & WIP 70.63 11.37 -218.06 473.71 255.75 275.50 328.50<br />
Total income 4,761.87 4,995.44 7,902.68 9,341.43 12,409.04 14,230.43 15,842.01<br />
Consumption of raw materials 2,819.26 3,228.54 3,933.98 5,314.82 7,635.15 8554.37 9509.78<br />
Other expenditure 733.15 752.59 1,276.60 1,446.32 1,615.18 1953.69 2148.62<br />
Employees cost 440.56 415.03 1,088.47 1,134.12 1,335.01 1535.04 1737.51<br />
Purchase of traded goods 176.50 183.13 428.75 481.04 657.61 753.57 837.73<br />
Total expenditure 4,169.47 4,579.29 6,727.80 8,376.30 11,242.94 12,796.67 14,233.64<br />
EBITDA 592.40 416.15 1,174.88 965.13 1,166.10 1,433.76 1,608.36<br />
Depreciation 129.86 128.51 254.23 271.94 325.60 341.16 391.86<br />
EBIT 462.54 287.64 920.65 693.19 840.50 1,092.60 1,216.50<br />
Interest 78.45 97.25 115.38 196.96 287.29 279.64 258.83<br />
EBT excl. other income &<br />
exceptional items<br />
384.09 190.38 805.27 496.23 553.21 812.96 957.67<br />
Other income 21.19 23.01 21.37 50.90 32.64 34.89 38.78<br />
EBT incl. other income 405.27 213.39 826.64 547.13 585.85 847.85 996.46<br />
Exceptional items 0.00 0.00 87.37 0.00 -29.38 0.00 0.00<br />
PBT 405.27 213.39 914.02 547.13 556.47 847.85 996.46<br />
Tax 135.59 74.23 260.66 106.33 144.35 237.40 279.01<br />
PAT 269.69 139.15 653.35 440.80 412.12 610.45 717.45<br />
Share of loss of associates 0.00 0.01 0.00 -0.64 -2.31 -2.66 -2.95<br />
Minority interest 0.00 0.00 0.00 0.00 -0.09 -0.07 -0.06<br />
Net profit 269.69 139.16 653.35 440.16 409.90 607.87 714.55<br />
No. of shares 47.1 50.4 50.4 50.4 50.4 50.4 50.4<br />
EPS 5.73 2.76 12.96 8.73 8.13 12.06 14.18<br />
The CAGR shown in last 5 years and the expectations for forthcoming periods (.i.e., from FY12 to FY14E)<br />
Particulars Over a period of 5 years (FY08-FY12) FY12-FY14E (without QIP)<br />
Sales 26.87% 12.98%<br />
EBITDA 18.45% 17.44%<br />
EBIT 16.10% 20.30%<br />
NP 11.03% 32.03%<br />
EPS 9.16% 32.03%
Page 4<br />
<strong>Apollo</strong> <strong>Tyres</strong> <strong>Ltd</strong><br />
Balance sheet (Rs cr)<br />
Particulars FY 08 FY 09 FY 10 FY 11 FY 12 FY 13E FY 14E<br />
Equity & Liabilities<br />
Share capital 48.85 50.41 50.41 50.41 50.41 50.41 50.41<br />
Share warrant 4.57 0.00 0.00 0.00 0.00 0.00 0.00<br />
Reserves and surplus 1129.07 1299.23 1917.42 2362.12 2782.36 3360.84 4031.31<br />
Proceeds of equity issue to QIBs 0.00 0.00 0.00 0.00 0.00 0.00 0.00<br />
Shareholders' funds total 1182.48 1349.64 1967.82 2412.53 2832.77 3411.25 4081.72<br />
Minority interest 0.00 0.00 0.00 0.85 0.76 0.69 0.63<br />
Non-current liabilities<br />
Long-term borrowings 259.59 526.32 1339.15 1228.10 1615.78 1408.64 1034.83<br />
Deferred tax liabilities 175.57 194.15 251.44 319.50 405.05 396.95 400.92<br />
Other long-term liabilities 0.00 0.00 0.00 20.60 45.41 47.68 50.06<br />
Long-term provisions 38.56 38.87 66.47 107.41 93.91 95.78 97.70<br />
Total 473.71 759.35 1657.06 1675.60 2160.15 1949.06 1583.52<br />
Current liabilities<br />
Short-term borrowings 386.53 364.41 368.00 993.76 933.90 980.60 1029.63<br />
Trade payables 685.48 571.48 1299.11 1199.78 1293.47 1396.95 1466.80<br />
Other current liabilities 6.90 14.57 13.11 444.72 442.19 464.30 487.51<br />
Current maturities of LT debt 0.00 0.00 0.00 258.36 322.33 407.14 523.81<br />
Short-term provisions 72.59 75.23 167.22 323.75 408.94 417.12 425.46<br />
Total 1151.51 1025.68 1847.44 3220.37 3400.84 3666.11 3933.21<br />
Total equities and liabilities 2807.70 3134.66 5472.33 7309.34 8394.52 9027.11 9599.08<br />
Assets<br />
Non-current assets<br />
Fixed assets 1205.14 1401.87 2442.52 3394.29 4023.83 4207.66 4340.80<br />
Capital work-in-progress 94.95 281.41 536.04 357.78 330.55 356.99 385.55<br />
Goodwill 21.50 23.51 117.52 124.97 133.77 140.46 147.48<br />
Non-current investments 5.04 4.60 5.69 11.18 15.82 18.20 20.92<br />
Deferred tax assets (Net) 0.00 0.00 0.00 3.30 2.51 2.63 2.77<br />
Long-term loans & advances 0.00 0.00 0.00 263.65 220.67 231.70 243.29<br />
Total 1326.62 1711.39 3101.77 4155.16 4727.14 4957.64 5140.80<br />
Current assets<br />
Inventories 715.15 630.22 992.87 1753.75 1999.11 2119.05 2436.91<br />
Trade receivables 312.90 224.74 786.90 951.66 1145.80 1203.09 1383.56<br />
Cash & Cash equivalents 284.71 362.09 348.98 190.89 173.04 380.42 252.56<br />
Short term loans & advances 167.88 205.39 237.22 257.88 334.15 350.85 368.39<br />
Other current assets 0.45 0.83 4.58 0.00 15.29 16.06 16.86<br />
Total 1481.08 1423.27 2370.55 3154.19 3667.38 4069.47 4458.28<br />
Assets total 2807.70 3134.66 5472.33 7309.34 8394.52 9027.11 9599.08
Ratios<br />
EPS has shown a CAGR of 20.46% over a period of 5 years .i.e., from FY08 to FY12.<br />
Page 5<br />
<strong>Apollo</strong> <strong>Tyres</strong> <strong>Ltd</strong><br />
Particulars FY 08 FY 09 FY 10 FY 11 FY 12 FY 13E FY 14E<br />
Market data<br />
EPS (Rs) 5.73 2.76 12.96 8.73 8.13 12.06 14.18<br />
Cash per share (Rs) 5.83 7.18 6.92 3.79 3.43 7.55 5.01<br />
Book value (Rs) 24.21 26.78 39.04 47.87 56.20 67.68 80.98<br />
Margins<br />
EBITDA margins (%) 12.63 8.35 14.47 10.88 9.59 10.27 10.37<br />
EBIT margins (%) 9.86 5.77 11.34 7.82 6.92 7.83 7.84<br />
Net profit margins (%) 5.75 2.79 8.05 4.96 3.37 4.36 4.61<br />
Valuations<br />
P/E (x) 7.60 7.73 5.44 8.08 10.05 8.65 8.89<br />
EV/Sales (x) 0.53 0.32 0.60 0.66 0.56 0.55 0.56<br />
EV/EBITDA (x) 4.20 3.86 4.18 6.06 5.85 5.35 5.40<br />
P/BV (x) 1.80 0.80 1.81 1.47 1.45 1.54 1.56<br />
Dividend yield (%) 1.15 2.11 1.06 0.71 0.61 0.48 0.60<br />
Return Ratio<br />
ROE (%) 22.81 10.31 33.20 18.24 14.47 17.82 17.51<br />
ROA (%) 16.47 9.18 16.82 9.48 10.01 12.10 12.67<br />
ROCE (%) 25.29 12.84 25.05 14.17 14.73 17.60 18.24<br />
Leverage ratio<br />
Debt/equity ratio (x) 0.55 0.66 0.87 1.03 1.01 0.82 0.63<br />
Debt / Total assets (x) 0.23 0.28 0.31 0.34 0.34 0.31 0.27<br />
Interest coverage ratio 5.90 2.96 7.98 3.52 2.93 3.91 4.70<br />
Liquidity ratios<br />
Current ratio (x) 1.29 1.39 1.28 0.98 1.08 1.11 1.13<br />
Quick ratio (x) 0.52 0.57 0.61 0.35 0.39 0.43 0.42<br />
EBITDA margins have fallen in FY11 and FY12 due to fluctuation in the prices of inputs, which constitute nearly<br />
70 percent of the total cost.<br />
Debt/equity ratio is likely to improve as we see an increase in repayments as compared to the expected fresh<br />
borrowings to be made.<br />
Interest coverage ratio is expected to improve due to lower debt burden and consequently, lower finance costs.
Scenario 2<br />
Financial estimates (With proposed QIP)<br />
Page 6<br />
<strong>Apollo</strong> <strong>Tyres</strong> <strong>Ltd</strong><br />
Profit and loss account (Rs cr)<br />
Particulars FY 08 FY 09 FY 10 FY 11 FY 12 FY 13E FY 14E<br />
Net sales 4,691.24 4,984.07 8,120.74 8,867.72 12,153.29 13954.93 15718.25<br />
Stock in trade & WIP 70.63 11.37 -218.06 473.71 255.75 275.50 334.50<br />
Total income 4,761.87 4,995.44 7,902.68 9,341.43 12,409.04 14,230.43 16,052.75<br />
Consumption of raw materials 2,819.26 3,228.54 3,933.98 5,314.82 7,635.15 8554.37 9635.29<br />
Other expenditure 733.15 752.59 1,276.60 1,446.32 1,615.18 1953.69 2176.98<br />
Employees cost 440.56 415.03 1,088.47 1,134.12 1,335.01 1535.04 1760.44<br />
Purchase of traded goods 176.50 183.13 428.75 481.04 657.61 753.57 848.79<br />
Total expenditure 4,169.47 4,579.29 6,727.80 8,376.30 11,242.94 12,796.67 14,421.50<br />
EBITDA 592.40 416.15 1,174.88 965.13 1,166.10 1,433.76 1,631.26<br />
Depreciation 129.86 128.51 254.23 271.94 325.60 341.16 408.42<br />
EBIT 462.54 287.64 920.65 693.19 840.50 1,092.60 1,222.83<br />
Interest 78.45 97.25 115.38 196.96 287.29 279.64 259.34<br />
EBT excl. other income &<br />
exceptional items<br />
384.09 190.38 805.27 496.23 553.21 812.96 963.49<br />
Other income 21.19 23.01 21.37 50.90 32.64 34.89 38.78<br />
EBT incl. other income 405.27 213.39 826.64 547.13 585.85 847.85 1,002.27<br />
Exceptional items 0.00 0.00 87.37 0.00 -29.38 0.00 0.00<br />
PBT 405.27 213.39 914.02 547.13 556.47 847.85 1002.27<br />
Tax 135.59 74.23 260.66 106.33 144.35 237.40 280.64<br />
PAT 269.69 139.15 653.35 440.80 412.12 610.45 721.64<br />
Share of loss of associates 0.00 0.01 0.00 -0.64 -2.31 -2.66 -2.95<br />
Minority interest 0.00 0.00 0.00 0.00 -0.09 -0.07 -0.06<br />
Net profit 269.69 139.16 653.35 440.16 409.90 607.87 718.74<br />
No. of shares 47.1 50.4 50.4 50.4 50.4 50.4 58.0<br />
EPS 5.73 2.76 12.96 8.73 8.13 12.06 12.39<br />
The company is expected to show a CAGR of<br />
Sales - 13.72%<br />
EBITDA - 18.27%<br />
EBIT - 20.62%<br />
NP - 32.42%<br />
EPS - 23.42%<br />
over a period of next two-years, considering the revenues from QIP investments
Page 7<br />
<strong>Apollo</strong> <strong>Tyres</strong> <strong>Ltd</strong><br />
Balance sheet (Rs cr)<br />
Particulars FY 08 FY 09 FY 10 FY 11 FY 12 FY 13E FY 14E<br />
Equity & Liabilities<br />
Share capital 48.85 50.41 50.41 50.41 50.41 50.41 50.41<br />
Share warrant 4.57 0.00 0.00 0.00 0.00 0.00 0.00<br />
Reserves and surplus 1129.07 1299.23 1917.42 2362.12 2782.36 3360.84 4028.84<br />
Proceeds of equity issue to QIBs 0.00 0.00 0.00 0.00 0.00 0.00 800.00<br />
Shareholders' funds total 1182.48 1349.64 1967.82 2412.53 2832.77 3411.25 4879.25<br />
Minority interest 0.00 0.00 0.00 0.85 0.76 0.69 0.63<br />
Non-current liabilities<br />
Long-term borrowings 259.59 526.32 1339.15 1228.10 1615.78 1408.64 1034.83<br />
Deferred tax liabilities 175.57 194.15 251.44 319.50 405.05 396.95 400.92<br />
Other long-term liabilities 0.00 0.00 0.00 20.60 45.41 47.68 50.06<br />
Long-term provisions 38.56 38.87 66.47 107.41 93.91 95.78 97.70<br />
Total 473.71 759.35 1657.06 1675.60 2160.15 1949.06 1583.52<br />
Current liabilities<br />
Short-term borrowings 386.53 364.41 368.00 993.76 933.90 980.60 1034.78<br />
Trade payables 685.48 571.48 1299.11 1199.78 1293.47 1396.95 1474.13<br />
Other current liabilities 6.90 14.57 13.11 444.72 442.19 464.30 487.51<br />
Current maturities of LT debt 0.00 0.00 0.00 258.36 322.33 407.14 523.81<br />
Short-term provisions 72.59 75.23 167.22 323.75 408.94 417.12 425.46<br />
Total 1151.51 1025.68 1847.44 3220.37 3400.84 3666.11 3945.69<br />
Total equities and liabilities 2807.70 3134.66 5472.33 7309.34 8394.52 9027.11 10409.09<br />
Assets<br />
Non-current assets<br />
Fixed assets 1205.14 1401.87 2442.52 3394.29 4023.83 4207.66 4724.24<br />
Capital work-in-progress 94.95 281.41 536.04 357.78 330.55 356.99 585.55<br />
Goodwill 21.50 23.51 117.52 124.97 133.77 140.46 147.48<br />
Non-current investments 5.04 4.60 5.69 11.18 15.82 18.20 20.92<br />
Deferred tax assets (net) 0.00 0.00 0.00 3.30 2.51 2.63 2.77<br />
Long-term loans & advances 0.00 0.00 0.00 263.65 220.67 231.70 443.29<br />
Total 1326.62 1711.39 3101.77 4155.16 4727.14 4957.64 5924.24<br />
Current assets<br />
Inventories 715.15 630.22 992.87 1753.75 1999.11 2119.05 2449.09<br />
Trade receivables 312.90 224.74 786.90 951.66 1145.80 1203.09 1390.47<br />
Cash & cash equivalents 284.71 362.09 348.98 190.89 173.04 380.42 260.02<br />
Short term loans & advances 167.88 205.39 237.22 257.88 334.15 350.85 368.39<br />
Other current assets 0.45 0.83 4.58 0.00 15.29 16.06 16.86<br />
Total 1481.08 1423.27 2370.55 3154.19 3667.38 4069.47 4484.84<br />
Assets total 2807.70 3134.66 5472.33 7309.34 8394.52 9027.11 10409.09
Ratios<br />
Page 8<br />
<strong>Apollo</strong> <strong>Tyres</strong> <strong>Ltd</strong><br />
Particulars FY 08 FY 09 FY 10 FY 11 FY 12 FY 13E FY 14E<br />
Market data<br />
EPS (Rs) 5.73 2.76 12.96 8.73 8.13 12.06 12.39<br />
Cash per share (Rs) 5.83 7.18 6.92 3.79 3.43 7.55 4.48<br />
Book value (Rs) 24.21 26.78 39.04 47.87 56.20 67.68 84.09<br />
Margins<br />
EBITDA margins (%) 12.63 8.35 14.47 10.88 9.59 10.27 10.38<br />
EBIT margins (%) 9.86 5.77 11.34 7.82 6.92 7.83 7.78<br />
Net profit margins (%) 5.75 2.79 8.05 4.96 3.37 4.36 4.57<br />
Valuations<br />
P/E (x) 7.60 7.73 5.44 8.08 10.05 8.65 10.30<br />
EV/Sales (x) 0.53 0.32 0.60 0.66 0.56 0.55 0.62<br />
EV/EBITDA (x) 4.20 3.86 4.18 6.06 5.85 5.35 5.97<br />
P/BV (x) 1.80 0.80 1.81 1.47 1.45 1.54 1.52<br />
Dividend yield (%) 1.15 2.11 1.06 0.71 0.61 0.48 0.59<br />
Return Ratio<br />
ROE (%) 22.81 10.31 33.20 18.24 14.47 17.82 14.73<br />
ROA (%) 16.47 9.18 16.82 9.48 10.01 12.10 11.75<br />
ROCE (%) 25.29 12.84 25.05 14.17 14.73 17.60 16.36<br />
Leverage ratio<br />
Debt/equity ratio (x) 0.55 0.66 0.87 1.03 1.01 0.82 0.53<br />
Debt / Total assets (x) 0.23 0.28 0.31 0.34 0.34 0.31 0.25<br />
Interest coverage ratio 5.90 2.96 7.98 3.52 2.93 3.91 4.72<br />
Liquidity ratios<br />
Current ratio (x) 1.29 1.39 1.28 0.98 1.08 1.11 1.14<br />
Quick ratio (x) 0.52 0.57 0.61 0.35 0.39 0.43 0.42<br />
The growth in EPS in FY14 is expected to be low due to the increase in number of shares (to the extent of new equity<br />
shares issued to QIBs), which would thereby result in dilution of EPS.<br />
We expect a fall in ROE, ROA and ROCE as proportionate revenue would not flow-in from the funds raised through<br />
QIP in FY14. The ratios may improve once when the investments made start generating revenue.
Graphical representation – Key financials<br />
Scenario 1 - Without QIP<br />
20,000<br />
15,000<br />
10,000<br />
5,000<br />
15.00<br />
10.00<br />
5.00<br />
0.00<br />
20.00<br />
15.00<br />
10.00<br />
5.00<br />
0.00<br />
12.00<br />
10.00<br />
8.00<br />
6.00<br />
4.00<br />
2.00<br />
0.00<br />
1.20<br />
1.00<br />
0.80<br />
0.60<br />
0.40<br />
0.20<br />
0.00<br />
0<br />
4,691 4,984<br />
Sales (Rs)<br />
8,121 8,868<br />
15,514<br />
13,955<br />
12,153<br />
FY 08 FY 09 FY 10 FY 11 FY 12 FY 13E FY 14E<br />
5.73<br />
2.76<br />
EPS (Rs)<br />
12.96<br />
8.73 8.13<br />
12.06<br />
14.18<br />
FY 08 FY 09 FY 10 FY 11 FY 12 FY 13E FY 14E<br />
12.63<br />
EBITDA Margin (%)<br />
8.35<br />
14.47<br />
10.88 9.59 10.27 10.37<br />
FY 08 FY 09 FY 10 FY 11 FY 12 FY 13E FY 14E<br />
9.86<br />
5.77<br />
11.34<br />
7.82<br />
6.92<br />
7.83 7.84<br />
FY 08 FY 09 FY 10 FY 11 FY 12 FY 13E FY 14E<br />
0.55<br />
0.66<br />
EBIT Margin (%)<br />
Debt / Equity ratio<br />
0.87<br />
1.03 1.01<br />
0.82<br />
0.63<br />
FY 08 FY 09 FY 10 FY 11 FY 12 FY 13E FY 14E<br />
Page 9<br />
Scenario 2 - With QIP<br />
20,000<br />
15,000<br />
10,000<br />
5,000<br />
15.00<br />
10.00<br />
5.00<br />
0.00<br />
20.00<br />
15.00<br />
10.00<br />
5.00<br />
0.00<br />
12.00<br />
10.00<br />
8.00<br />
6.00<br />
4.00<br />
2.00<br />
0.00<br />
1.20<br />
1.00<br />
0.80<br />
0.60<br />
0.40<br />
0.20<br />
0.00<br />
0<br />
4,691 4,984<br />
<strong>Apollo</strong> <strong>Tyres</strong> <strong>Ltd</strong><br />
Sales (Rs)<br />
8,121 8,868<br />
15,718<br />
13,644<br />
12,153<br />
FY 08 FY 09 FY 10 FY 11 FY 12 FY 13E FY 14E<br />
5.73<br />
2.76<br />
EPS (Rs)<br />
12.96<br />
8.73 8.13<br />
12.06 12.39<br />
FY 08 FY 09 FY 10 FY 11 FY 12 FY 13E FY 14E<br />
12.63<br />
EBITDA Margin (%)<br />
8.35<br />
14.47<br />
10.88 9.59 10.27 10.38<br />
FY 08 FY 09 FY 10 FY 11 FY 12 FY 13E FY 14E<br />
9.86<br />
5.77<br />
EBIT Margin (%)<br />
11.34<br />
7.82<br />
6.92<br />
7.83 7.78<br />
FY 08 FY 09 FY 10 FY 11 FY 12 FY 13E FY 14E<br />
0.55<br />
0.66<br />
Debt / Equity ratio<br />
0.87<br />
1.03 1.01<br />
0.82<br />
0.53<br />
FY 08 FY 09 FY 10 FY 11 FY 12 FY 13E FY 14E
Peer comparison<br />
1) Key financial data<br />
Page<br />
10<br />
<strong>Apollo</strong> <strong>Tyres</strong> <strong>Ltd</strong><br />
Company Name Net Sales EBITDA Depreciation EBIT Interest EBT Tax NP EPS<br />
(Rs cr)<br />
MRF 11,967.32 1272.01 301.81 970.2 158.84 843.25 263.84 579.4 1366.10<br />
<strong>Apollo</strong> <strong>Tyres</strong> <strong>Ltd</strong> 12,153.29 1166.10 325.60 840.50 287.29 556.47 144.35 409.90 8.13<br />
JK Tyre & Ind. <strong>Ltd</strong> 6,947.10 328.86 121.05 207.81 187.5 -23 15.22 -31.99 -7.79<br />
Ceat <strong>Ltd</strong> 4,648.99 282.45 72.80 209.65 195.8 24.27 6.09 18.12 5.29<br />
Balkrishna Ind. <strong>Ltd</strong> 3,016.64 511.97 86.39 425.58 29.2 400.42 131.48 268.94 27.48<br />
Goodyear (BSE) 1,515.93 121.14 19.69 101.45 5.21 96.24 31.65 64.59 28<br />
TVS Srichakra <strong>Ltd</strong> 1,458.88 134.87 22.71 112.17 57.172 54.99 15.621 39.19 51.18<br />
Falcon <strong>Tyres</strong> (BSE) 976.755 68.34 12.91 55.43 25.933 38.196 20.276 17.92 5.26<br />
2) Profitability margins<br />
Company Name EBITDA Margin EBIT Margin Net profit Margin<br />
(%) (%) (%)<br />
MRF 10.63 8.11 4.84<br />
<strong>Apollo</strong> <strong>Tyres</strong> 9.59 6.92 3.37<br />
JK Tyre & Ind. <strong>Ltd</strong> 4.73 2.99 -0.46<br />
Ceat <strong>Ltd</strong> 6.08 4.51 0.39<br />
Balkrishna Ind. <strong>Ltd</strong> 16.97 14.11 8.92<br />
Goodyear (BSE) 7.99 6.69 4.26<br />
TVS Srichakra 9.24 7.69 2.69<br />
Falcon <strong>Tyres</strong> (BSE) 7.00 5.68 1.83<br />
3) Market data<br />
Company Name Face Value CMP Market Cap PE Dividend Yield Earnings Yield Dividend<br />
(Rs) (Rs) (Rs cr) (x) (%) (%) (Rs)<br />
MRF 10 11180.00 4741.90 8.18 0.22 12.22 25<br />
<strong>Apollo</strong> <strong>Tyres</strong> 1 84.55 4261.53 10.40 0.59 9.62 0.5<br />
JK Tyre & Ind. <strong>Ltd</strong> 10 115.00 472.18 NM 2.17 NM 2.5<br />
Ceat <strong>Ltd</strong> 10 105.05 359.73 19.86 0.95 5.04 1<br />
Balkrishna Ind <strong>Ltd</strong> 2 250.85 2424.68 9.13 0.60 10.95 1.5<br />
Goodyear (BSE) 10 329.75 760.62 11.78 2.12 8.49 7<br />
TVS Srichakra <strong>Ltd</strong> 10 263.45 201.72 5.15 5.12 19.43 13.5<br />
Falcon <strong>Tyres</strong> (BSE) 5 22.70 175.86 4.32 7.71 23.17 1.75<br />
<strong>Apollo</strong> has an edge over MRF (its closest competitor) in terms of revenues from operations, but the higher<br />
employee costs have impacted its profitability margins.<br />
Dividend yield of <strong>Apollo</strong> is better when compared to MRF.
Industry overview<br />
Page<br />
11<br />
<strong>Apollo</strong> <strong>Tyres</strong> <strong>Ltd</strong><br />
India has emerged as the hub for the world’s most competitive tyre brands due to the vast availability of raw material<br />
(natural rubber) and growing demand for tyres from both replacement and OEM segments. After a slowdown in FY09, the<br />
industry had witnessed a remarkable recovery thereupon mainly driven by strong revival in automobile demand on the<br />
back of recovery in economy, positive trends in job market and superior living standards. However, the positives of strong<br />
automobile demand growth for the domestic Indian tyre industry are being impacted by the rising import markets.<br />
Raw material availability & reasons for its imports<br />
Tyre Industry is highly raw material intensive constituting nearly 70% of the total manufacturing cost. The<br />
composition of raw-materials as a percentage of total raw material cost is as below:<br />
http://www.atmaindia.org/overview.htm<br />
Butyl rubber update**<br />
Particulars Percentage of total raw material cost<br />
Natural Rubber 44%<br />
Nylon Tyre Cord Fabric 19%<br />
Carbon Black 12%<br />
Rubber Chemicals 5%<br />
Butyl Rubber 4%<br />
PBR 5%<br />
SBR 5%<br />
Others 6%<br />
The tyre sector consumes nearly two-thirds of the overall rubber production. Following are the key reasons for<br />
dependence on imports:<br />
Non-availability: No domestic production of butyl rubber** and specific grades of styrene butadiene rubber<br />
(SBR), including SBR1502 and SBR1712 & ethylene propylene diene monomer.<br />
Insufficient in-house production: The in-house production of nylon tyre cord fabric, polybutadiene rubber,<br />
rubber chemicals, steel tyre cord and polyester tyre cord being insufficient to meet domestic demand.<br />
Financial and strategic reasons: Tyre industry imports raw materials on account of the following factors:<br />
- Duty-free imports permitted against export of tyres; domestic supply not sufficient to meet complete<br />
requirement; technical and commercial considerations;<br />
- Business strategy to have multiple sources of supply.<br />
Reliance Sibur Elastomers Private Limited, a joint venture between Reliance Industries and Sibur (a Russian based<br />
petrochemicals giant and Synthetic rubber producer) was formed in the beginning of the year 2012. RIL holds a 74.9<br />
percent stake in the joint venture, while SIBUR enjoys 25.1 percent share. The JV has made an investment of $450<br />
million to construct 100,000 metric tons per year butyl rubber plant in Jamnagar. The plant is expected to go on stream in<br />
mid-2014.<br />
Synthetic rubber from the jointly owned Jamnagar plant will be aimed at India’s automotive industry, which today<br />
consumes more than 75,000 ton per year, all of it is imported. When completed, the unit—owned 74.9 percent by<br />
Reliance and 25.1 percent by Sibur—will be the world’s fourth-largest butyl rubber producer worldwide. While Reliance<br />
will construct the plant, SIBUR will provide the technology. SIBUR will handle implementing the technology, launching the<br />
plant, and training Indian engineers and workers.
Key value drivers<br />
Page<br />
12<br />
<strong>Apollo</strong> <strong>Tyres</strong> <strong>Ltd</strong><br />
India Europe South Africa<br />
1. Indian operations are mainly<br />
driven by growing vehicle base in<br />
the domestic market.<br />
2. Furthermore, the manufacturing of<br />
International auto brands in India<br />
is adding to the growth of Indian<br />
tyre industry.<br />
3. Demand for passenger car tyres<br />
is increasing backed by robust<br />
economic growth and rise in<br />
disposable income.<br />
4. Shift in customer focus to budget<br />
car categories.<br />
Expected trends in tyre sales<br />
1. Strong demand for High<br />
performance tyres, such as winter<br />
tyres, run-flat tyres etc. It, in fact,<br />
depends in part on the legislation<br />
in different European countries.<br />
Market share of winter tyres is<br />
higher in countries with legislation<br />
of compulsory winter tyres usage.<br />
2. High performance tyres fall into a<br />
high margin segment impacting<br />
profitability significantly and this<br />
segment carries greater pricing<br />
power due to industry<br />
concentration and demand of<br />
premium cars.<br />
3. Shift in customers focus to energy<br />
efficient and run-flat tyres.<br />
1. <strong>Apollo</strong> is the leading player in<br />
South Africa with 18% market<br />
share in the truck and passenger<br />
car tyres segments.<br />
2. Imports account for more than<br />
50% of market particularly<br />
dominated by low budget tyres<br />
imported from China.<br />
3. Replacement is expected to<br />
contribute nearly 3/4th of the<br />
industry for next 4-5 years.<br />
4. Industry facing challenges due to<br />
economic environment, lower<br />
capacity utilization & frequent<br />
work stoppages due to<br />
challenging industrial relations.<br />
(Million units)<br />
Year India - Replacement market India - OEM market Europe South Africa<br />
2013E 31 21 484 17.7<br />
2014E 33 22 502 18.5<br />
2015E NA NA 516 19.2<br />
Source: Automotive tyre manufacturers’ association (India) and LMC Automotive (www.lmc-auto.com)<br />
<strong>Apollo</strong>’s competitive position – Market share by domestic sales (FY12)<br />
o # 1 in truck segment & light commercial vehicle segment<br />
o Ranked #3 in passenger cars segment<br />
4%<br />
14%<br />
11%<br />
19%<br />
4%<br />
Truck Light commercial vehicle Passenger cars<br />
27%<br />
21%<br />
<strong>Apollo</strong><br />
MRF<br />
JK<br />
Ceat<br />
Birla<br />
Others<br />
Imports<br />
7%<br />
7%<br />
19%<br />
14%<br />
27%<br />
26%<br />
<strong>Apollo</strong><br />
MRF<br />
JK<br />
Ceat<br />
Birla<br />
Others<br />
3%<br />
18%<br />
16%<br />
13%<br />
3%<br />
17%<br />
9%<br />
21%<br />
<strong>Apollo</strong><br />
MRF<br />
JK<br />
Ceat<br />
Good Year<br />
Bridgestone<br />
Others<br />
Imports
CANSLIM stock screening strategy<br />
Page<br />
13<br />
<strong>Apollo</strong> <strong>Tyres</strong> <strong>Ltd</strong><br />
It tends to identify the companies with strong fundamentals, influenced by good sales volumes and rising earnings, driven<br />
by new products or services. This strategy encourages buying these stocks before their prices move up substantially. An<br />
in-depth analysis of <strong>Apollo</strong>’s fundamentals on the basis of CANSLIM (mnemonic) approach is given below:<br />
C = Current quarterly earnings<br />
This strategy recommends stocks with a minimum rise in quarterly earnings of 18-20% Y/Y. <strong>Apollo</strong> outperformed the<br />
benchmark with an EPS growth of 96% Y/Y.<br />
(Rs cr)<br />
Particulars Sep-12 Sep-11 Growth Y/Y Jun-12 Growth Q/Q<br />
Total income 3,374.83 2,871.24 17.54% 3,164.70 6.64%<br />
Total Expenditure 3,007.89 2,631.72 14.29% 2,813.12 6.92%<br />
EBITDA 366.94 239.52 53.20% 351.58 4.37%<br />
Depreciation 91.26 77.69 17.47% 93.55 -2.45%<br />
EBIT 275.68 161.83 70.35% 258.03 6.84%<br />
Interest 82.93 69.35 19.58% 75.06 10.48%<br />
Other Income 13.96 6.73 107.43% 9.84 41.87%<br />
EBT 206.71 99.21 108.36% 192.81 7.21%<br />
Tax 53.45 21.07 153.68% 53.92 -0.87%<br />
Reported Profit After Tax 153.26 78.14 96.14% 138.89 10.35%<br />
Share of profit of associate -1.07 -0.43 148.84% -0.89 20.22%<br />
Minority Interest After NP -0.009 -0.06 -85.00% -0.012 -25.00%<br />
Net Profit after Minority Interest 152.20 77.77 95.70% 138.01 10.28%<br />
EPS (Rs) 3.02 1.54 96.10% 2.74 10.22%<br />
A = Annual earnings<br />
Usually, we should pick companies with a proven track record of earnings growth and a potential for earnings<br />
acceleration. During FY09-12, <strong>Apollo</strong> has shown a CAGR of 34.56% in income from operations, 40.93% in EBITDA and<br />
43.30% in both net profit & EPS.<br />
(Rs cr)<br />
Particulars FY 09 FY10 FY11 FY12<br />
Income from operations 4,984.07 8,120.74 8,867.72 12,153.29<br />
39% 8% 27%<br />
EBITDA 416.15 1,174.88 965.13 1,166.10<br />
65% -22% 17%<br />
Net profit 139.16 653.35 440.16 409.90<br />
79% -48% -7%<br />
EPS (Rs) 2.76 12.96 8.73 8.13<br />
Note: Steep increase in raw material and finance costs has impacted the profits in FY11 & FY12.<br />
79% -48% -7%
N = new products, new management, new highs etc.,<br />
Page<br />
14<br />
<strong>Apollo</strong> <strong>Tyres</strong> <strong>Ltd</strong><br />
The strategy presumes that a growth in market value of the stock needs a catalyst to initiate a strong price advance. The<br />
catalyst could be a new product or service, a new management team employed after a period of lackluster performance,<br />
or even a structural change in the industry, such as new technology. <strong>Apollo</strong> is heading with a plan to expand its operations<br />
into new markets – South African operation is proposed to be expanded to the rest of Africa and South America; the<br />
Dutch operations would penetrate into Europe and North America and Indian operations would expand to the Middle East,<br />
the rest of the Asian continent and Australasia.<br />
It, in fact, had also segregated its brands on the basis of price into three segments with top segment covering global niche<br />
premium (Vredestein) and regional premium (Dunlop) brands, medium segment (the brand <strong>Apollo</strong>) and others segment<br />
covering Maloya, Regal and Kaizen brands.<br />
S = Supply and demand<br />
The emphasis here is on trading volume, particularly during price increases. The approach can be applied to all sizes, i.e.,<br />
large, mid and small cap, depending on the evaluation, but small companies will be more volatile with a higher probability<br />
towards the upside as well as the downside. <strong>Apollo</strong>’s average daily trading quantity over the last three months was 39.49<br />
lakh shares and the average daily trading turnover was Rs 35.11 crore.<br />
L = Leader or laggard<br />
The focus here is on rapidly growing companies in rapidly expanding sectors – pick the best two or three stocks in a<br />
group. The relative strength compares the performance of a stock in relation to the market as a whole.<br />
<strong>Apollo</strong> has become the first Indian tyre company to cross the revenue milestone of $2.5 billion.<br />
It holds the leading position in both truck/buses tyres and LCV segments, which comprises more than 60% of the<br />
overall tyres industry, with a market share of 27%.<br />
I = Institutional sponsorship<br />
The model recommends participation of institutional sponsors for the stock to show above-market performance. Analysis<br />
of the FIIs/DIIs holding represents a good resource for the individual investor because it is a well-research stock in the<br />
market. A close look at the company’s shareholding pattern reveals that institutional investors have been fairly positive on<br />
the stock. The company had recently increased the investment limit for foreign institutional investors (FIIs) from 30% to<br />
40% of its paid-up capital. However, it had seen a negative trend in DII holdings, in the last quarter, with a fall in overall<br />
DII holding to 11.23% in September 2012 from 13.36% in June 2012.<br />
M = Market indices<br />
The relative performance of <strong>Apollo</strong> vis-à-vis CNX Auto clearly shows that the company has outperformed the index,<br />
indicating a superior return probability over market return.<br />
1.50<br />
1.00<br />
0.50<br />
0.00<br />
-0.50<br />
Dec-09<br />
Jan-10<br />
Feb-10<br />
Mar-10<br />
Apr-10<br />
May-10<br />
Jun-10<br />
Jul-10<br />
Aug-10<br />
Sep-10<br />
Oct-10<br />
Nov-10<br />
Dec-10<br />
Jan-11<br />
Feb-11<br />
Mar-11<br />
Apr-11<br />
May-11<br />
Jun-11<br />
Jul-11<br />
Aug-11<br />
Sep-11<br />
Oct-11<br />
Nov-11<br />
Dec-11<br />
Jan-12<br />
Feb-12<br />
Mar-12<br />
Apr-12<br />
May-12<br />
Jun-12<br />
Jul-12<br />
Aug-12<br />
Sep-12<br />
Oct-12<br />
Nov-12<br />
Dec-12<br />
<strong>Apollo</strong> CNX Auto
Company overview<br />
Page<br />
15<br />
<strong>Apollo</strong> <strong>Tyres</strong> <strong>Ltd</strong><br />
<strong>Apollo</strong> manufactures automotive bias, radial tyres and tubes. It has a well positioned multi-brand strategy with diverse<br />
product offerings, supported by extensive international distribution network. Its product portfolio includes leading brands in<br />
the truck and bus, light truck, passenger car, and farm vehicle segments, which cater to both the OEM and replacement<br />
markets. It has seven manufacturing plants spread across three continents – India, Africa and Europe. It has<br />
demonstrated a capability to grow organically as well as through acquisitions and has transformed itself from a regional<br />
player to a global tyre manufacturer. <strong>Apollo</strong>'s two major subsidiaries include <strong>Apollo</strong> <strong>Tyres</strong> South Africa Pty <strong>Ltd</strong> (previously<br />
known as Dunlop <strong>Tyres</strong>) and <strong>Apollo</strong> Vredestein BV in the Netherlands. The company operates through a vast network of<br />
branded, exclusive and multi-product outlets in the three geographies – India, Europe and South Africa. It was<br />
incorporated in the year 1972.<br />
Major brands and the respective market segments catered through them<br />
Brand Segment<br />
<strong>Apollo</strong> Passenger vehicles, 4x4, truck/bus, light trucks, farm vehicles, off highway tyres and specialty tyres<br />
(Ultra high performance and winter tyres)<br />
Kaizen Commercial vehicles<br />
Regal Passenger vehicles and commercial vehicles<br />
Dunlop Passenger vehicles, 4x4, light trucks, farm vehicles, commercial vehicles and off highway tyres<br />
Vredestein Passenger vehicles, bicycles, 4x4, farm vehicles and specialty tyres (Ultra high performance and winter<br />
tyres)<br />
Maloya Passenger vehicles<br />
Manufacturing locations<br />
<strong>Apollo</strong> manufacturing plants located at the following locations in the three geographies operated by it:<br />
India Chennai, Vadodara, Perambra and Kalamassery (Kerala)<br />
Africa Durban and Ladysmith (South Africa)<br />
Europe Enschede (Netherlands)<br />
Revenue Segmentation<br />
On an overall basis, replacement market contributed 73% and OEM market contributed 27% of the revenue in FY 12.<br />
Segment-wise breakdown of FY12 revenue was as below:<br />
Segment FY12 FY08<br />
Truck-Bus 47% 63%<br />
Passenger car 35% 18%<br />
Farms and others 11% 11%<br />
Light truck 7% 8%
Page<br />
16<br />
<strong>Apollo</strong> <strong>Tyres</strong> <strong>Ltd</strong><br />
The company has gradually diversified its product mix through a combination of organic growth and global acquisitions.<br />
OEM<br />
56%<br />
Product wise segmentation<br />
The company is now planning to expand further by spreading its South African operations (Dunlop) to the rest of Africa<br />
and South America, Netherland operations (Vredestein) to penetrate deeper in Europe & North America, and Indian<br />
operations focusing on Middle East, Asia and Australia.<br />
Distribution network<br />
<strong>Apollo</strong> has an extensive distribution network of 4000 retail dealers (1200 exclusive), 170 sales, service & stock points, 19<br />
state offices and a wide specialist network of <strong>Apollo</strong> Zone, <strong>Apollo</strong> CV Zone, <strong>Apollo</strong> Point, Pragati Kendra in India, 3100<br />
outlets and 12 sales offices in Europe and 900 dealers, 6 sales, service & stock points and 1600 Dunlop Zones in South<br />
Africa.<br />
R&D strengths<br />
<strong>Apollo</strong> has research and development centres located in India and Netherlands. The company is focussing on gradually<br />
increasing its R&D spend in the coming years. The Indian R&D centre is focussed on commercial vehicles segment while<br />
the Netherlands centre caters to passenger vehicles segment.<br />
New products<br />
India<br />
67%<br />
Replacement<br />
34%<br />
India<br />
Truck bus 65%<br />
Passenger vehicles 16%<br />
Light truck 9%<br />
Off Highway 8%<br />
Others 2%<br />
Exports<br />
10%<br />
OEM<br />
78%<br />
Revenue<br />
Europe<br />
23%<br />
Replacement<br />
19%<br />
Europe<br />
Passenger vehicle 83%<br />
Off Highway 14%<br />
Others 3%<br />
Exports<br />
3%<br />
South Africa<br />
10%<br />
<strong>Apollo</strong> has been focussing on new product development, especially in the ultra-high performance (UHP) segment. In<br />
2012, it launched ‘<strong>Apollo</strong> Aspire 4G’, and ‘Vredestein Ultrac Vorti’ & ‘Sportrac 5’ in Europe.<br />
OEM<br />
67%<br />
South Africa<br />
Replacement<br />
2%<br />
Truck bus 40%<br />
Passenger vehicles 30%<br />
Light truck 23%<br />
Off Highway 6%<br />
Others 1%<br />
Exports<br />
31%
Key Milestones<br />
Year Milestones<br />
1972 Year of incorporation<br />
1977 First manufacturing plant in Kerala<br />
1991 Second manufacturing plant in Gujarat<br />
1995 Acquired a plant in Kerala from Premier <strong>Tyres</strong><br />
2004 Launched H-Rated tubeless passenger car tyre range in India<br />
2006 Acquired Dunlop <strong>Tyres</strong> International (Pty) <strong>Ltd</strong>, South Africa<br />
2006 Launched W-Rated tubeless Ultra High Performance passenger car tyre range in India<br />
2007 Launched branded retread material in India<br />
2007 Launched radial tyres in India for truck and bus<br />
2009 Acquired Vredestein Banden BV, Netherlands<br />
2010 Manufacturing plant in Tamil Nadu for truck radials and car tyres<br />
Growth through acquisitions<br />
Page<br />
17<br />
<strong>Apollo</strong> <strong>Tyres</strong> <strong>Ltd</strong><br />
<strong>Apollo</strong> <strong>Tyres</strong> <strong>Ltd</strong> has extended its global footprint through overseas acquisition of Dunlop <strong>Tyres</strong> International (Pty) <strong>Ltd</strong>,<br />
South Africa and Vredestein Banden BV, Netherlands. This has helped the company to acquire rights for Dunlop in 32<br />
countries in Africa and market its products through the extensive distribution network of Dunlop. Acquisition of Vredestein<br />
gave the company the opportunity to market all its brands and develop Europe as one of its major markets. Vredestein is<br />
now considered as one of the premium brands of <strong>Apollo</strong>. These acquisitions have benefitted the company in terms of<br />
operational synergies, product range rationalisation, benefits in product development, global brand positioning, enhanced<br />
technological capabilities and developing its research and development facilities.<br />
Partners in growth- Customer base
SWOT analysis<br />
Strengths Weaknesses<br />
Diversified operations across three continents .i.e.,<br />
India, Europe, and South Africa<br />
Strong brand portfolio comprising three key brands<br />
– <strong>Apollo</strong>, Dunlop and Vredestein and three others-<br />
Kaizen, Regal and Maloya<br />
Wide spread distribution network<br />
Market leader in Indian commercial vehicles<br />
segment<br />
Established player in ultra high performance tyres<br />
and winter tyres in Europe<br />
Page<br />
18<br />
<strong>Apollo</strong> <strong>Tyres</strong> <strong>Ltd</strong><br />
No presence in the growing two-wheeler segment<br />
Unable to pass on cost increases to customers in<br />
a smooth manner due to intense competition in the<br />
market<br />
Opportunities Threats<br />
Being the market leader in commercial vehicles<br />
segment, it is likely to benefit more from the<br />
increasing radialisation in the truck and bus<br />
segment<br />
Deeper penetration in African and European<br />
markets<br />
Increasing presence in untapped markets, like<br />
South East Asia, South America and Australia<br />
Triple ‘A’ Supply Chain Model<br />
Slowdown in the Indian and European economy<br />
Uncertain economic and political conditions and<br />
currency fluctuations in South Africa<br />
Strong competition from international players, like<br />
Bridgestone and Michelin<br />
Faster decline in truck-bus cross ply segment<br />
requiring increased investment for conversion to<br />
radial facility<br />
Fluctuations in prices of key raw materials, like<br />
natural rubber and crude oil<br />
The best supply chains possess three distinct features – Agile (react speedily to sudden changes in demand or supply),<br />
Adaptable (evolve with market structures and strategies) and Aligned (congruence of interests of all the firms in the supply<br />
network so that companies optimize the chain’s performance when they maximize their interests). <strong>Apollo</strong> with its extensive<br />
distribution network of 4000 retail dealers in India, 3100 outlets in Europe and outsourced dealer network in Africa is well<br />
positioned to respond to the changes in demand or supply conditions and to evolve with changing market forces. Its<br />
continued focus on vendor relationship management, raw material substitution and procurement from low cost sources<br />
has enabled it to optimize its resources.<br />
Agile Adaptable Aligned<br />
Sustainable<br />
competitive<br />
advantage
Page<br />
19<br />
<strong>Apollo</strong> <strong>Tyres</strong> <strong>Ltd</strong><br />
Go the distance… Realize your true potential….’The Stakeholders Perspective’<br />
The quest for growth, the desire to cross geographic boundaries to venture into new territories and to evolve as a multicultural<br />
brand, is all about, the brand <strong>Apollo</strong>. It believes in continuous improvement, tireless search for quality and a<br />
passion to deliver the best, in order to ensure a safe driving experience for its customers.<br />
TYRE SAFETY – THE APOLLO WAY<br />
Technology Deployment: The growing demand for products has led to an increased deployment of technology<br />
across its locations, which helped the group register a growth of 16% in production tonnage, by generating an output<br />
of 510,537 metric tonnes of tyres in FY12 as against 438,524 metric tonnes last year.<br />
You-First – A customer centric approach: It’s all about the focus on detail in everything that <strong>Apollo</strong> undertakes by<br />
putting the needs of its customers and stakeholders at the forefront, is what that differentiates it from other players.<br />
Refreshing customer experience: With a focus on superior service experience and delivery, the company operates<br />
– <strong>Apollo</strong> Direct tyre helpline (enables customers to select and buy the appropriate tyre for their vehicle) and <strong>Apollo</strong><br />
Super Zone (branded retail outlets with a host of facilities, like internet, lounges and entertainment centers).<br />
Empowering employees – Human Capital Model: <strong>Apollo</strong> runs a series of programmes for employees, including<br />
<strong>Apollo</strong> Laureate academy, One-Family (coming together in a spirit of celebration), PACE (online performance and<br />
career management system) and DreamTeam (promotes integration across geographies).<br />
Safe drive initiatives: On-road customer initiatives to create awareness on proper tyre care and maintenance<br />
through the <strong>Apollo</strong> Safe Drive.<br />
Approachable: <strong>Apollo</strong> first understands the needs of the customer and then segments the market and develops the<br />
products for niche applications to enable it to provide fuel efficient and cost-saving products to each customer<br />
segment.<br />
Finest product portfolio: <strong>Apollo</strong> is well-positioned through its multi-brand strategy, including Vredestein in Global<br />
Niche premium; Dunlop in regional premium; <strong>Apollo</strong> in Global; and Maloya, Regal & Kaizen in global challenger<br />
segments.<br />
Ethical practices: <strong>Apollo</strong> believes that the key to sustainable success lies in stakeholder value maximization, which<br />
is attainable only through the practice of a few distinct traits in their purest form, including ethics in business and One-<br />
Family notion.<br />
Tyre Maintenance: <strong>Apollo</strong> being a member of TyreSafe, a leading tyre safety organization educates customers<br />
about the importance of tyre care and maintenance thereby reiterating its inherent attribute of tyre safety.<br />
Young, vibrant and dynamic: Managing and adapting to the change, learning from new experiences is what that<br />
speaks of the young, vibrant and dynamic group.
Disclaimer<br />
KARVY RESEARCH DESK – RETAIL BROKING<br />
Page<br />
20<br />
<strong>Apollo</strong> <strong>Tyres</strong> <strong>Ltd</strong><br />
J K Jain jambu@karvy.com +91-9618087899<br />
<strong>Karvy</strong> Stock Broking Limited<br />
“<strong>Karvy</strong> Centre”, Avenue-4, 2nd Floor, Road No: 10, Banjara Hills, Hyderabad – 500 034. India.<br />
Tel: 91-40-23312454; Fax: 91-40-23311968<br />
Disclosures Appendix<br />
The information and views presented in this <strong>report</strong> are prepared by <strong>Karvy</strong> Stock Broking Limited. The information<br />
contained herein is based on our analysis and upon sources that we consider reliable. We, however, do not vouch for the<br />
accuracy or the completeness thereof. This material is for personal information and we are not responsible for any loss<br />
incurred based upon it. The investments discussed or recommended in this <strong>report</strong> may not be suitable for all investors.<br />
Investors must make their own investment decisions based on their specific investment objectives and financial position<br />
and using such independent advice, as they believe necessary. While acting upon any information or analysis mentioned<br />
in this <strong>report</strong>, investors may please note that neither <strong>Karvy</strong> nor <strong>Karvy</strong> Stock Broking nor any person connected with any<br />
associate companies of <strong>Karvy</strong> accepts any liability arising from the use of this information and views mentioned in this<br />
document.<br />
The author, directors and other employees of <strong>Karvy</strong> and its affiliates may hold long or short positions in the above<br />
mentioned companies from time to time. Every employee of <strong>Karvy</strong> and its associate companies are required to disclose<br />
their individual stock holdings and details of trades, if any, that they undertake. The team rendering corporate analysis and<br />
investment recommendations are restricted in purchasing/selling of shares or other securities till such a time this<br />
recommendation has either been displayed or has been forwarded to clients of <strong>Karvy</strong>. All employees are further restricted<br />
to place orders only through <strong>Karvy</strong> Stock Broking <strong>Ltd</strong>. This <strong>report</strong> is intended for a restricted audience and we are not<br />
soliciting any action based on it. Neither the information nor any opinion expressed herein constitutes an offer or an<br />
invitation to make an offer, to buy or sell any securities, or any options, futures nor other derivatives related to such<br />
securities.