2004 Financial Report - Tampa International Airport
2004 Financial Report - Tampa International Airport
2004 Financial Report - Tampa International Airport

You also want an ePaper? Increase the reach of your titles
YUMPU automatically turns print PDFs into web optimized ePapers that Google loves.
2 0 0 4<br />
Excellence<br />
by<br />
Design<br />
Annual <strong>Report</strong>
Alfred S. Austin<br />
Chairman<br />
Louis E. Miller<br />
Executive Director<br />
n organization has to pursue<br />
excellence, in order to achieve it.<br />
We are proud that <strong>Tampa</strong> <strong>International</strong><br />
<strong>Airport</strong> has a global reputation for designing<br />
and implementing exceptional goals and<br />
plans. We know that achieving excellence<br />
takes high objectives, such as providing<br />
world-class transportation and world-class<br />
facilities; it takes sincere efforts to ensure<br />
convenience and efficiency; intelligent<br />
direction to provide a safe and secure<br />
environment; expert execution to implement<br />
a cost competitive structure; and a<br />
vision to see obstacles as opportunities.<br />
These long-term strategic initiatives were<br />
created for guiding the future of <strong>Tampa</strong><br />
2<br />
A<br />
Leadership<br />
<strong>International</strong> <strong>Airport</strong> and its three reliever airports: Peter O. Knight,<br />
Vandenberg and Plant City. These high objectives are the vision of the outstanding<br />
men and women of the Hillsborough County Aviation Authority.<br />
It has been an exceptional year for <strong>Tampa</strong> <strong>International</strong> <strong>Airport</strong>’s ongoing<br />
$790-million capital improvement program. Construction continues on the<br />
<strong>Airport</strong>’s largest airside terminal building – C. At an overall cost of $134.8<br />
million, the 315,000-square-foot, 16-gate facility is on budget and on time,<br />
scheduled for completion in April 2005.<br />
Also this year, a highly significant construction project was completed. On<br />
June 24, <strong>2004</strong>, the <strong>Airport</strong>’s new $124-million baggage handling system<br />
was completed and <strong>Tampa</strong> <strong>International</strong> <strong>Airport</strong> became one of the few<br />
large hub airports in the United States to implement a new multi-user,<br />
in-line baggage handling system that is fully integrated with<br />
21 federally required Explosive Detection Systems (EDS)<br />
machines, making it 100 percent operational for screening<br />
all checked baggage at the <strong>Airport</strong>.<br />
The <strong>Tampa</strong> Bay Area is one of the nation’s most dynamic<br />
and prosperous regions and travelers love to visit. During<br />
Fiscal Year <strong>2004</strong>, over 16.9 million passengers used <strong>Tampa</strong><br />
<strong>International</strong> <strong>Airport</strong>, representing a 10.63 percent increase<br />
from the previous year. <strong>Tampa</strong> experienced 10 months of<br />
record-breaking passenger traffic during the year, always<br />
performing higher than the national average.<br />
This year, operating revenues increased by 8.7 percent to<br />
$137.4 million while operating expenses increased by 5.8<br />
percent to $65.7 million. The increase in operating<br />
expenses, while well within budgeted amounts, was a<br />
result of additional security measures required by the<br />
Transportation Security Administration, and necessary<br />
expenditures to maintain high service levels. During the year,<br />
the Aviation Authority invested $152.5 million in facility<br />
improvements, land and equipment. In support of its ongoing<br />
capital development program, the Authority received<br />
$33.6 million in Passenger Facility Charges (PFC) and $25.2<br />
million in Federal and State Grants and generated $30.9 million<br />
from operations in FY <strong>2004</strong>.<br />
The final cost for airlines serving <strong>Tampa</strong> was $4.21 per<br />
enplaned passenger and it continues to be well below the<br />
industry average for large hub airports, which represents<br />
the Aviation Authority’s commitment to cost containment<br />
efforts in controlling expenditures.<br />
For the fourth year, <strong>Tampa</strong> <strong>International</strong> <strong>Airport</strong> had the<br />
privilege of receiving high votes from passengers, placing it<br />
among the world’s best for overall passenger satisfaction.<br />
The J. D. Power and Associates 2003 Global <strong>Airport</strong><br />
Passenger Satisfaction Study selected <strong>Tampa</strong> <strong>International</strong><br />
<strong>Airport</strong> as the fourth highest in overall passenger satisfaction<br />
in the mid-sized category. Just behind Singapore’s Changi<br />
<strong>International</strong> and Hong Kong’s Chek Lap Kok, <strong>Tampa</strong><br />
<strong>International</strong> <strong>Airport</strong> placed second highest in the U.S. —<br />
one point behind Pittsburgh <strong>International</strong> <strong>Airport</strong>.<br />
The talented <strong>Tampa</strong> <strong>International</strong> <strong>Airport</strong> employees form this<br />
essence of excellence. They are the ones committed to the<br />
daily dedication of providing comfort, safety, convenience and<br />
well-being to the <strong>Airport</strong>’s customers and ultimately, responsible<br />
for the above-average passenger satisfaction ratings.<br />
Alfred S. Austin<br />
Chairman<br />
Louis E. Miller<br />
Executive Director<br />
3
4<br />
Stephen J. Mitchell<br />
Vice Chairman<br />
Partnership<br />
Hillsborough County<br />
Commissioner<br />
Thomas Scott<br />
Treasurer<br />
Alfred S. Austin<br />
Chairman<br />
Board Members Staff Roster<br />
Ken Anthony<br />
Secretary<br />
<strong>Tampa</strong> Mayor<br />
Pam Iorio<br />
Assistant Secretary/<br />
Assistant Treasurer<br />
Louis E. Miller<br />
Executive Director<br />
John Wheat<br />
Deputy Executive Director<br />
Linda Greif<br />
Administrative Assistant<br />
to the Executive Director<br />
Don Whitworth<br />
Director of Performance<br />
Management and Internal Audit<br />
George A. Elbe<br />
Director of<br />
Air Service Development<br />
and <strong>International</strong> Commerce<br />
Edward B. Cooley, III<br />
Senior Director of Operations<br />
and Public Safety<br />
Gigi Skipper<br />
General Counsel<br />
Director of Legal Affairs<br />
Don C. Welch<br />
Director of Human Resources<br />
Brenda S. Geoghagan<br />
Director of Public Information<br />
and Community Relations<br />
Louis P. Russo, Jr.<br />
Senior Director of Planning<br />
and Development<br />
Ann Davis<br />
Director of Finance<br />
Diane Pryor-Vercelli<br />
Senior Director of Properties<br />
and Contracts Administration<br />
Al Illustrato, Jr.<br />
Senior Director of Maintenance<br />
Ted W. Leslie<br />
Director of Properties and<br />
Contracts Administration<br />
Sharon Weaver<br />
Director of Administration<br />
and Information Technology<br />
Robert J. Burr<br />
Director of Operations<br />
Joseph H. Hills<br />
Director of Parking and<br />
Ground Transportation<br />
James W. Jones, Jr.<br />
Director of Engineering<br />
Rudolph R. Mueller, III<br />
Director of Architecture<br />
John Allen<br />
Director of Construction<br />
Nadine S. Jones<br />
Director of Planning and<br />
Noise Compatibility Programs<br />
Edward R. Haines<br />
Director of Development<br />
Program Services<br />
Paul F. Sireci<br />
Chief of Police<br />
Gary Houts<br />
Director of Maintenance<br />
5
Year In Review<br />
2003<br />
October<br />
• Gordon Bethune, chairman of the board<br />
and CEO of Continental Airlines, is named<br />
the recipient of the <strong>2004</strong> Tony Jannus<br />
Award, which recognizes an individual who<br />
has made significant contributions to commercial<br />
aviation.<br />
November<br />
• Air Canada initiates service to Montreal<br />
Dorval with two weekly departures.<br />
• <strong>Tampa</strong> <strong>International</strong> <strong>Airport</strong> reinforces its<br />
“good neighbor” policy as construction is<br />
completed on a $5.9-million engine run<br />
up enclosure.<br />
December<br />
• Laker Airways returns to <strong>Tampa</strong> with two<br />
weekly departures to Freeport, Bahamas.<br />
• <strong>Tampa</strong> <strong>International</strong> <strong>Airport</strong> joins the aviation<br />
community around the world in commemorating<br />
the centennial celebration of the<br />
Wright Brothers historic flight at Kitty Hawk,<br />
North Carolina on December 17, 1903.<br />
<strong>2004</strong><br />
January<br />
• JetBlue Airways increases service from <strong>Tampa</strong>,<br />
by offering two daily departures to Boston, MA.<br />
• Bahamas Air initiates service to Freeport,<br />
Bahamas with two daily departures.<br />
6<br />
Accomplishments<br />
• Sun Country offers seasonal service between Minneapolis and <strong>Tampa</strong> with one<br />
daily departure.<br />
• In response to a renewed surge in passenger traffic, the Aviation Authority revives<br />
plans to construct an economy parking garage. The garage will add 3,966 spaces<br />
by Thanksgiving 2005 and an additional 1,705 in 2006.<br />
February<br />
• AirTran expands service from <strong>Tampa</strong> with daily nonstop service to Akron/Canton.<br />
• Midwest Airlines expands its seasonal service between <strong>Tampa</strong> and Milwaukee<br />
with an additional daily departure.<br />
• Northwest Airlines adds service to two Michigan cities – one daily departure each<br />
to Flint and Grand Rapids.<br />
• In the 2003 Global <strong>Airport</strong> Satisfaction Study, J.D. Power and Associates awards<br />
<strong>Tampa</strong> high honors, recognizing it as #2 in the U.S. and #4 in the world for<br />
overall passenger satisfaction.<br />
March<br />
• United Airlines introduces Ted, its low cost carrier, to the <strong>Tampa</strong> Bay area and<br />
launches service between <strong>Tampa</strong> and Denver with three daily departures.<br />
• Continental Airlines offers new service to connect <strong>Tampa</strong> with two other Florida<br />
cities: two daily departures to Fort Myers and one to Sarasota/Bradenton.<br />
May<br />
• <strong>Tampa</strong> <strong>International</strong> <strong>Airport</strong> is named 7th in the nation in rental car revenue.<br />
• Southwest Airlines extends “Brotherly Love” to <strong>Tampa</strong> with daily nonstop service<br />
to Philadelphia, PA.<br />
• With another record-breaking month of passenger traffic, Louis Miller announces<br />
<strong>Tampa</strong> <strong>International</strong> <strong>Airport</strong> is “all the way back” from September 11th. The airport<br />
will continue to exceed pre-9/11 passenger traffic numbers for the remainder<br />
of the year.<br />
June<br />
• <strong>Tampa</strong> <strong>International</strong> <strong>Airport</strong> reaches another milestone in passenger convenience<br />
with the completion of the 100 percent in-line explosive detection system. The<br />
$124-million baggage handling system makes TPA the second large airport in the<br />
nation to go completely in-line, the first with multi-user capabilities.<br />
• The aviation community mourns the passing of George J. Bean, Executive<br />
Director of <strong>Tampa</strong> <strong>International</strong> <strong>Airport</strong> from 1965 to 1996. Mr. Bean is credited with<br />
a lifetime of service to aviation organizations worldwide and the revolutionary<br />
design of <strong>Tampa</strong> <strong>International</strong> <strong>Airport</strong>.<br />
July<br />
• <strong>Tampa</strong> <strong>International</strong> <strong>Airport</strong> fills another niche in customer service with the opening<br />
of an observation deck at Airside D. The deck allows smokers to step outside<br />
and indulge before boarding an aircraft, without having to go back and forth<br />
through security. Additional patios open later in the year at Airsides A, E and F.<br />
August<br />
• To increase customer convenience at Baggage Claim, large-scale dynamic flight<br />
information signage is added to the Arrival Drive. Drivers meeting arriving passengers<br />
can check flight status without leaving their vehicles.<br />
• Hurricane Charley bears down on West<br />
Central Florida, soon to be followed by<br />
Frances, Jeanne and Ivan, impacting flight<br />
operations statewide for 44 days. Thanks to<br />
preparation and an unprecedented cooperative<br />
effort by the <strong>Airport</strong> and tenants, the<br />
storm season concludes without substantial<br />
damage (approximately $2.2 million) to<br />
<strong>Tampa</strong> <strong>International</strong> and its three general<br />
aviation airports.<br />
• Providing airport passengers and visitors<br />
with a higher level of convenience and<br />
information, the new <strong>Tampa</strong> <strong>International</strong><br />
<strong>Airport</strong> website is launched.<br />
• <strong>Tampa</strong> <strong>International</strong> joins a few select airports<br />
on the cutting edge of security with the<br />
installation of a GE Ion Tracker trace detection<br />
portal. The explosive detection system<br />
is part of a TSA test program.<br />
September<br />
• Delta Air Lines announces a shift in hub<br />
operations. The result is the first nonstop<br />
flights from <strong>Tampa</strong> to Salt Lake City,<br />
Greensboro, NC and Dayton, OH.<br />
Additional service to Raleigh-Durham and<br />
Pensacola is planned.<br />
• Southwest Airlines adds new nonstop service<br />
between <strong>Tampa</strong> and Buffalo, NY.<br />
• Official opening of <strong>Tampa</strong> <strong>International</strong> Jet<br />
Center, the <strong>Airport</strong>’s second Fixed Base<br />
Operator.<br />
7
T<br />
he Aviation Authority is moving forward<br />
with its ongoing $790-million<br />
capital improvement program. Recognizing<br />
the environmental impact airport growth<br />
has on a community and the need to design<br />
reasonable mitigation measures that address<br />
noise, wetlands, stormwater management<br />
and other environmental issues are always<br />
primary concerns of the Aviation Authority.<br />
The Planning and Development Department<br />
reported 23 completed projects for FY<br />
<strong>2004</strong>. Of these projects, 96 percent were<br />
reported on time and on budget.<br />
Taxiway W, High Speed Exit<br />
Runway 36 Left/18 Right is the <strong>Airport</strong>’s<br />
most western north/south runway and<br />
the closest to <strong>Tampa</strong> Bay, handling nearly<br />
75 percent of all jet operations. The $9million<br />
construction of a high-speed taxiway<br />
and taxiway improvements near the<br />
south end of Runway 36 Left offers a significant<br />
benefit to <strong>Airport</strong> neighbors. It<br />
enables landing aircraft to exit the runway<br />
more quickly, thereby allowing more aircraft<br />
to land on 36 Left. As a result, fewer<br />
aircraft will need, or want, to land on<br />
Runway 36 Right (parallel runway to 36<br />
Left), keeping aircraft over the water and<br />
reducing noise impacts in the future.<br />
Progress<br />
The Aviation Authority working in cooperation with the contractors reduced<br />
the scheduled runway closure from 64 days to 43 days.<br />
Baggage Handling System<br />
On June 24, <strong>2004</strong>, <strong>Tampa</strong> <strong>International</strong> <strong>Airport</strong> became one of the few<br />
large hub airports in the United States to implement a new multi-user in-line<br />
baggage handling system that is fully integrated with 21 federally required<br />
explosive detection systems (EDS), making it 100 percent operational for<br />
screening all checked baggage at the <strong>Airport</strong>.<br />
The $124-million baggage system has the capability to expand to 25 EDS. The<br />
processing rate is six (6) bags per minute for each EDS. The system has eight<br />
miles of conveyor belts and 3,000 electric motors and gear boxes. The total<br />
electrical cost is approximately $1 million annually, generating enough power to<br />
operate 500 average-sized homes. The system operates 20 hours per day<br />
and processes 35,000 bags in a peak day at the current passenger level.<br />
Completing this project has increased efficiency and passenger satisfaction<br />
of the <strong>Airport</strong>’s baggage systems.<br />
New Flight Information Signage<br />
Large-scale, large-letter electronic flight displays were installed on each of<br />
the four elevator core exterior walls at the Red (north) and Blue (south)<br />
Arrival Drives, displaying flight information visible to pedestrians, motorists<br />
and traffic personnel.<br />
Exterior Dynamic Signage<br />
The <strong>Airport</strong> has installed 10 new Dynamic Signs (computer variable messages) in<br />
order to communicate with <strong>Airport</strong> visitors by roadway messaging. Eight were<br />
installed on the George J. Bean Parkway, providing real-time traffic and directional<br />
information for travelers approaching the main terminal building and<br />
garage facilities. The total cost for the Dynamic Signage project is $2.1 million.<br />
Residential Sound Insulation Program<br />
A $3.2-million project to sound insulate 33 residential houses impacted by aircraft<br />
noise was completed this year. It included replacing doors and windows with<br />
acoustically rated insulation products, adding insulation in attics, gypsum<br />
board on walls and ceilings and replacing air-conditioning equipment.<br />
Service Building Expansion and Modifications<br />
Work has started on the $14.9-million design-build expansion and modification<br />
to the service building adjacent to the main terminal building. The facility is home<br />
to the Communication Center, Police Department, Planning and Development,<br />
Parking and Ground Transportation, General Aviation, Maintenance, Operations,<br />
airport identification badging office and an employee cafeteria. The expansion<br />
adds 31,500 square feet, reconfigures the second floor area and modifies the<br />
first floor facilities.<br />
The Police Department has already moved into its new space in the service building,<br />
featuring a modern dispatch center, crisis command center, administrative space<br />
and four holding cells. This project is scheduled for completion in July 2005.<br />
Disadvantaged Business Enterprise<br />
(DBE) Program<br />
The Properties and Contracts Department<br />
has been focusing on updating and<br />
improving the DBE program to assist<br />
with the <strong>Airport</strong>’s Capital Development<br />
Program.<br />
This year, 40 firms were eligible for<br />
recertification, 10 new firms were added<br />
to the directory and 299 affidavits were<br />
processed for continuing eligibility. A<br />
Reciprocal Certification Program with<br />
Florida Department of Transportation<br />
(FDOT) was established and six have<br />
been certified.<br />
Additionally, outreach activities included<br />
participation with the <strong>Tampa</strong> Urban<br />
League Conference, <strong>Airport</strong> Minority<br />
Advisory Council (AMAC) 20th Annual<br />
Conference, MED Week Planning<br />
Committee, George Edgecomb Awards<br />
Banquet, Regional Task Force Vendor’s<br />
Meeting, Airside C DBE Informational<br />
Meeting and Florida Minority Supplier<br />
Development Council (FMSDC) Outreach.<br />
A consultant has been selected to assist<br />
the Authority in conducting a Disparity<br />
Study in 2005.<br />
8 9
Momentum<br />
n July 1988, the Master Plan Update<br />
identified areas adjacent to <strong>Tampa</strong><br />
<strong>International</strong> <strong>Airport</strong> that will, according<br />
to projections, be needed by the Aviation<br />
Authority for airport expansion in the<br />
future. Therefore, it was necessary for the<br />
Authority to establish a land acquisition<br />
program, implemented as federal funds<br />
became available.<br />
To date, parcel acquisitions and the total<br />
acreage acquired are 83 percent complete<br />
(240 parcels out of 288 and 171<br />
acres out of 205). Five blocks representing<br />
over 20 parcels and owned entirely by<br />
the Authority have been consolidated<br />
and now are identified by two folio numbers.<br />
This assemblage is taking place to<br />
assist development planning as well as<br />
minimize potential costs in environmental<br />
remediation activities.<br />
Airside C<br />
Construction started January <strong>2004</strong> and<br />
continues on time and on budget for<br />
the new $134.8-million, 16-gate,<br />
315,000-square-foot Airside C. It is the<br />
second airside terminal to be design-built<br />
at <strong>Tampa</strong> <strong>International</strong> <strong>Airport</strong>. Beck and<br />
Alfonso Architects were selected as the<br />
contractor and designer.<br />
10<br />
I<br />
Southwest Airlines will operate 12 gates, with Spirit Airlines and Independence<br />
Air using the remaining four gates. HMSHost is creating 13,000 square feet of<br />
food and beverage concessions, offering Starbucks Coffee, Chili’s, a <strong>Tampa</strong> Bay<br />
Sports Bar and 6,000 square feet of retail space. Plus, after traveling through one<br />
of the eight security screening lanes, families can enjoy a children’s play area.<br />
Additionally, four artists have been commissioned to provide public art for five<br />
locations in the terminal. Harrison Covington of <strong>Tampa</strong> created an eight-foot<br />
bronze sculpture titled “Barnstormer”. Christopher Still of Tarpon Springs is<br />
developing an aviation-themed 19-foot-by-13-foot horizontal mural filled with<br />
historical details regarding the history of the <strong>Tampa</strong> <strong>International</strong> <strong>Airport</strong>. He is<br />
also fabricating an 80-foot-long aluminum sculpture titled “Q”, which is the<br />
expression of the dynamic pressure associated with force needed to lift an<br />
object/airplane. Imitating aircraft aluminum, it has cutouts depicting travelers<br />
from different time periods. Stephen Robin of Philadelphia is producing “Orange<br />
Blossom”, a 13 foot by 9 foot by 5 foot aluminum and cement sculpture in<br />
the round with branches and opening blossoms. Kristin Jones and Andrew<br />
Ginzel of New York are designing flooring art titled “Specula”, consisting of<br />
a series of mosaic medallions laid into the white terrazzo floor of the AGT<br />
shuttle departure lobby.<br />
Economy Parking Garage<br />
The design work is complete for a new $71-million, six-level Economy<br />
Parking Garage which will accommodate approximately 5,500 vehicles. The<br />
parking garage will be constructed in two phases, from east to west. The<br />
first two-thirds of the parking garage (Phase I) is scheduled to be completed<br />
by November 2005. The scheduled completion date for the remaining<br />
one-third (Phase II) is November 2006. A shuttle bus lane will run down the<br />
center of the parking garage on the first floor. All parking patrons will take<br />
elevators down to one of two elevator lobbies/bus stations on the first floor<br />
to meet the shuttle bus for transportation to the main terminal building.<br />
The shuttle lobbies on the first floor will be air conditioned and the shuttle<br />
buses will operate every 10 minutes.<br />
Three areas in the parking garage have been selected for public art: two<br />
interior walls, two interior floors and one outside space. The interior areas<br />
are located in the two shuttle lobbies. The artwork in these locations will<br />
enhance the environment and travel experience as patrons wait for a shuttle.<br />
The exterior artwork will be visually appealing to motorists from a distance.<br />
The Aviation Authority has budgeted $750,000 for this public art project.<br />
Master Plan Update<br />
An update of the 1999 <strong>Tampa</strong> <strong>International</strong> <strong>Airport</strong> Master Plan is underway<br />
in order to define facility enhancements and capacity improvement<br />
projects that will be required to satisfy demand growth and serve tenant<br />
needs during the next twenty years. As in the past, the Aviation Authority<br />
is taking a collaborative approach with<br />
the master planning process that includes<br />
airlines, airport tenants and stakeholders,<br />
the community and the public.<br />
<strong>Tampa</strong> <strong>International</strong> <strong>Airport</strong> is situated in<br />
the midst of the <strong>Tampa</strong> Bay region, Florida’s<br />
most populous Metropolitan Statistical Area,<br />
with a permanent population of 2.56<br />
million. Plus, with <strong>Tampa</strong> <strong>International</strong>’s<br />
primary service area including Hillsborough,<br />
Pinellas, Pasco, and Hernando counties<br />
and secondary area including Polk,<br />
Manatee, Sarasota, Hardee, De Soto,<br />
Citrus and Sumter counties, it serves 3.97<br />
million permanent residents.<br />
With the service area population increasing<br />
every day, the Master Plan Update addresses<br />
needs up to the year 2025 and beyond.<br />
The plan will be complete by January 2006.<br />
11
Passengers<br />
Millions enplaned and deplaned<br />
14.9<br />
Evaluation<br />
1999 2000 2001 2002 2003 <strong>2004</strong><br />
Operations<br />
Thousands of landings and takeoffs<br />
272.3<br />
15.9<br />
277.2<br />
16.3<br />
269.8<br />
15.2<br />
245.5<br />
Airline Passenger Traffic*<br />
Air Cargo<br />
Millions of pounds<br />
Mail<br />
Millions of pounds<br />
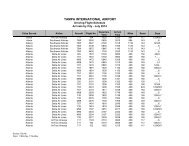
Fiscal Year Enplaned Average Annual Passenger Aircraft Departures Average Passengers<br />
Ending September Passengers % Change Annual Daily Enplaned Per Departure<br />
2001 . . . . . . . . . . 8,183,815 . . . . . . . . . 3.0% . . . . . . . . . . . . 109,516 . . . . . . . . . . 300 . . . . . . . . . . . . . . . 75<br />
2002 . . . . . . . . . . 7,618,598 . . . . . . . . –7.0% . . . . . . . . . . . . . 99,161 . . . . . . . . . . 272 . . . . . . . . . . . . . . . 77<br />
2003 . . . . . . . . . . 7,660,785 . . . . . . . . . 1.0% . . . . . . . . . . . . . 92,979 . . . . . . . . . . 255 . . . . . . . . . . . . . . . 82<br />
<strong>2004</strong> . . . . . . . . . . 8,465,720 . . . . . . . . 11.0% . . . . . . . . . . . . . 95,541 . . . . . . . . . . 262 . . . . . . . . . . . . . . . 89<br />
* Data includes major national, regional, charter and foreign-flag passenger carriers (both scheduled and non-scheduled)<br />
15.3<br />
231.9<br />
16.9<br />
238.1<br />
1999 2000 2001 2002 2003 <strong>2004</strong><br />
196.9<br />
48.7<br />
190.0<br />
46.3<br />
151.8<br />
36.5<br />
154.0<br />
178.8<br />
163.2<br />
1999 2000 2001 2002 2003 <strong>2004</strong><br />
33.7 34.6 34.7<br />
1999 2000 2001 2002 2003 <strong>2004</strong><br />
Top 25 Markets<br />
Twelve Months Ended June 30, <strong>2004</strong><br />
City Passengers Percent Air Miles<br />
1 New York . . . . . . . . . . 1,524,180 . . . . . . . . . . 16.92% . . . . . . . . 1,004<br />
2 Chicago . . . . . . . . . . . . . 630,370 . . . . . . . . . . . 7.00% . . . . . . . . 1,004<br />
3 Atlanta . . . . . . . . . . . . . . 552,330 . . . . . . . . . . . 6.13% . . . . . . . . . . 407<br />
4 Baltimore . . . . . . . . . . . . 483,860 . . . . . . . . . . . 5.37% . . . . . . . . . . 844<br />
5 Philadelphia . . . . . . . . . . 468,650 . . . . . . . . . . . 5.20% . . . . . . . . . . 921<br />
6 Boston . . . . . . . . . . . . . . 450,840 . . . . . . . . . . . 5.00% . . . . . . . . 1,186<br />
7 Detroit . . . . . . . . . . . . . . 431,400 . . . . . . . . . . . 4.79% . . . . . . . . . . 992<br />
8 Fort Lauderdale . . . . . . . 371,410 . . . . . . . . . . . 4.12% . . . . . . . . . . 197<br />
9 Washington D.C. . . . . . . 362,460 . . . . . . . . . . . 4.02% . . . . . . . . . . 814<br />
10 Hartford . . . . . . . . . . . . 303,620 . . . . . . . . . . . 3.37% . . . . . . . . 1,102<br />
11 Providence . . . . . . . . . . 295,740 . . . . . . . . . . . 3.28% . . . . . . . . 1,137<br />
12 Dallas/Fort Worth . . . . . 294,450 . . . . . . . . . . . 3.27% . . . . . . . . . . 927<br />
13 Los Angeles . . . . . . . . . . 267,660 . . . . . . . . . . . 2.97% . . . . . . . . 2,153<br />
14 Las Vegas . . . . . . . . . . . 266,530 . . . . . . . . . . . 2.96% . . . . . . . . 1,880<br />
15 Denver . . . . . . . . . . . . . 253,220 . . . . . . . . . . . 2.81% . . . . . . . . 1,504<br />
16 Minneapolis . . . . . . . . . . 237,170 . . . . . . . . . . . 2.63% . . . . . . . . 1,308<br />
17 Manchester . . . . . . . . . . 221,710 . . . . . . . . . . . 2.46% . . . . . . . . 1,205<br />
18 Pittsburgh . . . . . . . . . . . 209,120 . . . . . . . . . . . 2.32% . . . . . . . . . . 921<br />
19 Columbus . . . . . . . . . . . 206,230 . . . . . . . . . . . 2.29% . . . . . . . . . . 830<br />
20 Buffalo . . . . . . . . . . . . . . 205,810 . . . . . . . . . . . 2.28% . . . . . . . . 1,055<br />
21 St. Louis . . . . . . . . . . . . . 200,000 . . . . . . . . . . . 2.22% . . . . . . . . . . 870<br />
22 New Orleans . . . . . . . . . 198,690 . . . . . . . . . . . 2.21% . . . . . . . . . . 487<br />
23 Nashville . . . . . . . . . . . . 192,120 . . . . . . . . . . . 2.13% . . . . . . . . . . 613<br />
24 Raleigh/Durham . . . . . . 191,600 . . . . . . . . . . . 2.13% . . . . . . . . . . 588<br />
25 Houston . . . . . . . . . . . . 189,990 . . . . . . . . . . . 2.11% . . . . . . . . . . 780<br />
Market Share<br />
9,009,160 100.00%<br />
Source: United States Department of Transportation, Origin & Destination, T-100 Data<br />
Percentage based on enplaned passengers – September <strong>2004</strong><br />
20.9<br />
Southwest Airlines<br />
20.5<br />
Delta Air Lines<br />
11.0<br />
US<br />
Airways<br />
9.8<br />
American<br />
Airlines<br />
6.5 6.4 6.1 5.2<br />
4.5 9.1<br />
12 13<br />
Continental<br />
Airlines<br />
United<br />
Airlines<br />
Northwest<br />
Airlines<br />
AirTran<br />
Airways<br />
JetBlue<br />
Airways<br />
Other
<strong>Financial</strong>s Independent<br />
Auditors’ <strong>Report</strong><br />
The Board of Directors<br />
Hillsborough County Aviation Authority<br />
<strong>Tampa</strong>, Florida<br />
We have audited the accompanying statements of net assets of the Hillsborough County Aviation<br />
Authority (the “Authority”), as of September 30, <strong>2004</strong> and 2003, and the related statements of revenues,<br />
expenses, and changes in net assets, and of cash flows for the years then ended. These financial statements<br />
are the responsibility of the Authority’s management. Our responsibility is to express an opinion on these<br />
financial statements based on our audits.<br />
We conducted our audits in accordance with auditing standards generally accepted in the United States of<br />
America and the standards applicable to financial audits contained in Government Auditing Standards<br />
issued by the Comptroller General of the United States. Those standards require that we plan and perform<br />
the audit to obtain reasonable assurance about whether the financial statements are free of material<br />
misstatement. An audit includes examining, on a test basis, evidence supporting the amounts and<br />
disclosures in the financial statements. An audit also includes assessing the accounting principles used<br />
and significant estimates made by management, as well as evaluating the overall financial statement<br />
presentation. We believe that our audits provide a reasonable basis for our opinion.<br />
In our opinion, such financial statements present fairly, in all material respects, the financial position of<br />
the Authority at September 30, <strong>2004</strong> and 2003, and the changes in its financial position and its cash flows<br />
for the years then ended in conformity with accounting principles generally accepted in the United States<br />
of America.<br />
Management’s Discussion and Analysis is not a required part of the basic financial statements, but is<br />
supplementary information required by the Governmental Accounting Standards Board. This<br />
supplementary information is the responsibility of the Authority’s management. We have applied certain<br />
limited procedures, which consisted principally of inquiries of management regarding the methods of<br />
measurement and presentation of the supplementary information. However, we did not audit the<br />
information and we do not express an opinion on it.<br />
December 9, <strong>2004</strong><br />
15
Management’s Discussion And Analysis<br />
The following management’s discussion and analysis (MD&A) of the financial performance and activity of the Hillsborough County Aviation<br />
Authority (the Authority) is to provide an introduction and understanding of the financial statements of the Authority for the years ended<br />
September 30, <strong>2004</strong> and 2003 with selected comparisons to prior years. The information presented should be read in conjunction with<br />
the financial statements, notes and supplemental schedules found in this report.<br />
Introduction<br />
The Authority was created in 1945 and is an independent special district governed by the Hillsborough County Aviation Authority Act,<br />
Chapter 2003-370, Laws of Florida (the Act). The Act provides that the Authority will have exclusive jurisdiction, control, supervision and<br />
management over all publicly owned airports in Hillsborough County. There are five Authority Members, three residents of Hillsborough<br />
County appointed to the Authority by the Governor of the State of Florida for four year terms; the Mayor of the City of <strong>Tampa</strong>, ex-officio;<br />
and a Commissioner of and selected by the Board of County Commissioners of Hillsborough County, ex-officio.<br />
The Authority owns and operates <strong>Tampa</strong> <strong>International</strong> <strong>Airport</strong> (the <strong>Airport</strong>) and three general aviation airports. The <strong>Airport</strong> occupies<br />
approximately 3,400 acres and is primarily an origination-destination (O&D) airport serving the greater <strong>Tampa</strong> Bay area. Peter O. Knight<br />
<strong>Airport</strong>, a 139-acre facility, is located six miles southeast of the <strong>Airport</strong>; Plant City <strong>Airport</strong>, a 199-acre facility, is located 22 miles east of the<br />
<strong>Airport</strong>; and Vandenberg <strong>Airport</strong>, a 407-acre facility, is located 12 miles east of the <strong>Airport</strong>.<br />
The Authority is a self-supporting organization and generates revenues from airport users to fund operating expenses and debt service<br />
requirements. Capital projects are funded through the use of bonds, short-term financing, passenger facility charges, federal and state<br />
grants and internally generated funds. Although empowered to levy ad-valorem property taxes, the Authority has not collected any tax<br />
funds since the early 1970s.<br />
<strong>Airport</strong> Activity Highlights<br />
For the fiscal year ended September 30, <strong>2004</strong>, passenger enplanements totaled 8,465,720, compared to 7,660,785 for FY2003 and<br />
7,618,598 for FY2002, increases of 10.5% and 11.1%, respectively. Nationally, airline passenger traffic for FY<strong>2004</strong> increased 4% over FY2003.<br />
The number of FY<strong>2004</strong> passengers for the <strong>Airport</strong> is a record, exceeding the previous record set in FY2001 by 281,905 passengers, an<br />
increase of 3.4%. Nationwide, passengers for FY<strong>2004</strong> compared to FY2001 declined by 7.7%, indicating the <strong>Airport</strong>’s recovery continues<br />
to exceed the industry average. Landed weight in FY<strong>2004</strong> totaled 11,181,590 thousand pounds, compared to 10,812,057 thousand<br />
pounds in FY2003 and 11,144,792 thousand pounds in FY2002, increases of 3.4% and .3%, respectively. The number of landings for<br />
domestic and international flights increased 2.8% in FY<strong>2004</strong> over the prior fiscal year. While airlines overall continue to struggle with<br />
higher operating costs and the recent economic downturn, these increases in activities at <strong>Tampa</strong> <strong>International</strong> <strong>Airport</strong> are a positive sign<br />
of the strength of this market area and the cost-competitive environment of the <strong>Airport</strong>.<br />
16<br />
Highlights of the Fiscal Year <strong>2004</strong> Budget<br />
As required by the Authority’s trust agreement, airline agreement and state statutes, the Authority is required to adopt an annual budget.<br />
On September 2, 2003 the Authority Board approved the Fiscal Year <strong>2004</strong> Operating and Capital Budget. The FY<strong>2004</strong> Budget continues<br />
the goal of returning to normal levels of customer service while maintaining the objectives of controlling expenses, maximizing non-airline<br />
revenues and limiting cost increases to those airlines serving <strong>Tampa</strong> <strong>International</strong> <strong>Airport</strong>. In the FY<strong>2004</strong> Operating Budget, revenues were<br />
projected at $138,981,200. The revenue estimates for the FY<strong>2004</strong> budget were based on projections of passenger activity returning to<br />
the levels of pre-9/11/2001. The FY<strong>2004</strong> Operating Budget expenses were projected at $66,107,000, and included funding for additional<br />
security measures and expenses associated with the operation of the new outbound baggage system for most of the year. Discussion of<br />
the FY<strong>2004</strong> Capital Budget is presented in the “Capital Improvement Program” section of this MD&A.<br />
Summaries of the operating budget and actual results for FY<strong>2004</strong> are shown below. This table is based on and presented in accordance with<br />
the airline-airport agreement (see “Airline Rates and Charges” section in this MD&A and Note 3 in the accompanying financial statements).<br />
Percent<br />
Fiscal Year <strong>2004</strong> Budget Actual of Budget<br />
___________________ ___________________ ___________________<br />
Revenues $138,981,200 $143,054,412 102.9%<br />
Expenses (66,107,000)<br />
___________________<br />
(64,502,950)<br />
___________________<br />
97.6%<br />
___________________<br />
Funds Available for Debt Service 72,874,200 78,551,462 107.8%<br />
Debt Service from Current Operations (40,756,698) (40,752,668) 100.0%<br />
Distribution of Airline Revenue Sharing (6,139,100)<br />
___________________<br />
(6,906,692)<br />
___________________<br />
112.5%<br />
___________________<br />
Net Increase for Capital<br />
Improvement Program and Reserves $ 25,978,402<br />
___________________<br />
$ 30,892,102<br />
___________________<br />
118.9%<br />
___________________<br />
Airline Rates and Charges<br />
Effective October 1, 1999, the Authority entered into a new airline-airport use and lease agreement (Airline-<strong>Airport</strong> Agreement) with the<br />
signatory airlines, which has a seven-year term and incorporates the lease and use of the terminal complex and the airfield at the <strong>Airport</strong>.<br />
The agreement establishes a “compensatory” rate making methodology where the signatory airlines pay fees and charges based on the<br />
Authority’s cost of providing facilities and services to the airlines.<br />
Rates and charges are calculated on an annual basis and reviewed and adjusted, if necessary, throughout each fiscal year to ensure that<br />
sufficient revenues are generated to satisfy all requirements of the Authority’s Trust Agreement. At the end of each fiscal year, the Authority<br />
will recalculate rates and charges based on audited financial data and a settlement will take place with the signatory airlines. Included in<br />
the Airline-<strong>Airport</strong> Agreement are rates and charges calculations with specific rebates of debt service coverage and sharing of net remaining<br />
revenues. This net revenue sharing component was established at 15% of net revenues, as defined, in fiscal years 2000 and 2001,<br />
16% for fiscal year 2002, 17% for fiscal year 2003, 18% for fiscal year <strong>2004</strong> and escalates 1% annually to 20% in fiscal year 2006. Nonsignatory<br />
rates and charges do not provide for a 25% debt service coverage reduction or the “net revenue sharing” component, thus the<br />
Authority charges two distinct rates to airlines operating at the airport based on the cost of providing services for facilities utilized.<br />
17
The table below summarizes passenger airline rents, landing fees, net revenue sharing and cost per enplaned (departing) passenger. Cost<br />
per enplaned passenger is a standard industry measurement, and the goal of the Authority is to maintain a competitive cost per enplanement<br />
at the <strong>Airport</strong>. The actual cost per enplanement for FY<strong>2004</strong> was $4.21, compared to the original budget of $4.70. This variance is<br />
attributable to actual expenses for the year coming in less than budget, reimbursements from the Transportation Security Administration,<br />
an increase in revenue sharing over the budget and actual enplanements for FY<strong>2004</strong> exceeding projections. For FY<strong>2004</strong> enplanements<br />
were estimated at 8,184,000 while actual enplanements of 8,465,720 exceeded the budget forecast and also resulted in a record year<br />
for the <strong>Airport</strong>.<br />
Passenger Airline Costs Percent<br />
Fiscal Year <strong>2004</strong> Budget Actual of Budget<br />
___________________ ___________________ ___________________<br />
Airline Landing Fees $10,387,500 $ 9,624,061 92.7%<br />
Landside Terminal Rentals 17,199,100 16,880,967 98.2%<br />
Airside Building Rentals 17,024,400<br />
___________________<br />
16,032,600<br />
___________________<br />
94.2%<br />
___________________<br />
Total Airline Fees and Charges 44,611,000 42,537,628 95.4%<br />
Less Airline Revenue Sharing (6,139,100)<br />
___________________<br />
(6,906,692)<br />
___________________<br />
112.5%<br />
___________________<br />
Net Airline Fees and Charges $38,471,900 $35,630,936 92.6%<br />
___________________ ___________________ ___________________<br />
___________________ ___________________ ___________________<br />
Enplaned Passengers 8,184,000 8,465,720 103.4%<br />
___________________ ___________________ ___________________<br />
Airline Cost Per Passenger $ 4.70 $ 4.21 89.5%<br />
___________________ ___________________ ___________________<br />
___________________ ___________________ ___________________<br />
Overview of the <strong>Financial</strong> Statements<br />
The Authority operates as a single enterprise fund with multiple costs centers. The financial statements are prepared on the accrual basis<br />
of accounting, therefore revenues are recognized when earned and expenses are recognized when incurred. Capital assets are capitalized<br />
and depreciated, except land, over their useful life. Reference should be made to Note 2 in the accompanying financial statements for a<br />
summary of the Authority’s significant accounting policies. Following this MD&A are the basic financial statements and supplemental schedules<br />
of the Authority. These statements and schedules, along with the MD&A, are designed to provide readers with an understanding of the<br />
Authority’s finances.<br />
The statements of net assets present information on all of the Authority’s assets and liabilities for the fiscal years ended September 30, <strong>2004</strong><br />
and 2003, with the difference between these reported as net assets. The statements of revenues, expenses and changes in net assets<br />
present financial information showing how the Authority’s net assets changed during the two fiscal years. These statements summarize<br />
the recording of financial transactions when the underlying events occur, not the receipt or disbursement of cash. The statements of cash<br />
flows relate to the cash and cash equivalents in-flows and out-flows as a result of financial transactions during the two fiscal years and<br />
also includes a reconciliation of operating income to the net cash provided by operating activities.<br />
18<br />
<strong>Financial</strong> Highlights<br />
Operating Revenues<br />
Percent Percent<br />
Change Change<br />
Fiscal Year Fiscal Year Fiscal Year 2003 to 2002 to<br />
Revenue Classification <strong>2004</strong> 2003 2002 <strong>2004</strong> 2003<br />
___________________ ___________________ ___________________ ______________ ______________<br />
Airfield $ 9,957,737 $ 9,057,481 $ 9,319,033 9.9% (2.8)%<br />
Terminal Building 30,499,660 26,655,750 22,230,673 14.4% 19.9%<br />
Airside Buildings 16,009,562 16,681,825 13,880,083 (4.0)% 20.2%<br />
Commercial Landside 71,068,176 64,791,477 63,487,870 9.7% 2.1%<br />
Cargo 1,935,081 1,681,681 1,084,928 15.1% 55.0%<br />
Auxiliary <strong>Airport</strong>s 594,772 563,695 480,871 5.5% 17.2%<br />
General Aviation 841,999 778,138 772,351 8.2% 0.7%<br />
Other 6,478,135 6,148,443 5,620,221 5.4% 9.4%<br />
___________________ ___________________ ___________________ ______________ ______________<br />
$137,385,122 $126,358,490 $116,876,030 8.7% 8.1%<br />
___________________ ___________________ ___________________ ______________ ______________<br />
___________________ ___________________ ___________________ ______________ ______________<br />
The table above presents the major operating revenue classifications for FY<strong>2004</strong>, FY2003 and FY2002. Airfield revenues are comprised of<br />
landing fees received from the airlines based on landed weight. In accordance with the airline agreement, landing fee rates are calculated<br />
by dividing 90% of total expenditures in the airfield cost center by the annual total landed weight of all commercial airlines. The increase<br />
in airfield revenues in the current year is attributable to the impact of applying operating grants in FY2003 to offset airfield expenses. The<br />
decrease in airfield revenues from FY2002 to FY2003 also relates to the impact of the operating grant in FY2003.<br />
Space rental fees to the airlines in the terminal building are based on the cost of providing the space to the airlines. The variance in terminal<br />
building revenues for FY<strong>2004</strong> compared to FY2003 is due to increases in space rental revenues (due to increases in expenses, i.e., full<br />
year of baggage handling system) and food and beverage and hotel concession revenues. FY<strong>2004</strong> concession revenues were all positively<br />
impacted by the increase in the passenger activity at the <strong>Airport</strong>. In FY2003 a partial year of operating a portion of the baggage<br />
handling system and increases in insurance costs contributed to the increase in revenues in this classification. The opening of the new<br />
Airside E in October 2002 contributed to increased concession revenues in FY2003 as did the elimination of the concession improvement<br />
trust. Payments to the trust of approximately $789,000 were recognized as revenues in FY2003 and future facility improvements will be<br />
paid directly by the concessionaires.<br />
The decrease in airside revenues in FY<strong>2004</strong> over the prior year is a result of the reimbursement of airside security costs from the Transportation<br />
Security Administration (TSA) and a decrease in the amount of investment service allocated to this cost center. The increase in airside revenues<br />
for FY2003 compared to FY2002 is due to the opening of Airside E (108,303 square feet larger than Airside C) and the closure of<br />
Airside C that resulted in additional space rental revenues of $2,712,200.<br />
The commercial landside classification consists primarily of car rental, parking and other concession revenues; all of these items were<br />
positively impacted by the increase in passenger enplanements in FY<strong>2004</strong>. Parking revenues increased $3.2 million in FY<strong>2004</strong>, indicating<br />
a continued increase in the use by those traveling as well as <strong>Airport</strong> patrons picking up passengers. Car rental concessions in FY<strong>2004</strong><br />
increased $3.2 million over the prior year as a result of increased activity and a settlement of a revenue audit that resulted in additional<br />
revenues of $1,582,500. Although passenger enplanements for FY2003 were only slightly above the prior year, parking revenues<br />
increased $1.6 million over FY2002, indicating an increase in the use of the parking facility by travelers.<br />
19
Cargo revenue increases in FY<strong>2004</strong> are due to higher occupancy in the cargo facilities. On March 1, 2003, the newly constructed Federal<br />
Express cargo sorting facility was opened, generating $597,400 additional revenues in the cargo complex in FY2003. Revenues generated<br />
from the general aviation operations in FY<strong>2004</strong> showed positive variances from the prior year and are higher than the FY<strong>2004</strong> budget by<br />
2.1%. Other revenues in FY<strong>2004</strong> increased over FY2003 due to additional rentals in the non-aviation areas of the <strong>Airport</strong>. In FY2003, this<br />
classification increased $528,200 over FY2002, due to additional rentals in the non-aviation area of the airport and a full year of revenues<br />
from the fuel farm. In mid-FY2002, improvements to the fuel farm were made by the Authority and the fees charged to the airlines were<br />
increased for the use of the facility.<br />
Operating Grants and Reimbursements<br />
From October 2002 through May 2003, the Authority recorded $664,400 in reimbursements from the Transportation Security Administration<br />
for providing law enforcement services on behalf of the TSA at the passenger security checkpoints. As of June 1, 2003, the agreement with<br />
the TSA was terminated. In FY<strong>2004</strong> the TSA reinstated the agreement and the Authority was reimbursed $1,241,772 (retro-active to June<br />
2003 through September <strong>2004</strong>) for providing the law enforcement services. The Authority has this agreement with the TSA for the next<br />
fiscal year and anticipates the TSA will continue with the reimbursement program. An annual grant in the amount of $120,500 from the<br />
TSA was received in each of the fiscal years presented to partially fund the three canine programs at the <strong>Airport</strong>. In FY<strong>2004</strong> $67,900 was<br />
received from the State of Florida for reimbursement of overtime expenses associated with security issues. In FY2003, the Authority<br />
received a $3,000,000 operating grant from the State of Florida under a program to provide economic assistance to public-use airports<br />
due to the economic impacts from the events of September 11, 2001.<br />
Operating Expenses<br />
Percent Percent<br />
Change Change<br />
Fiscal Year Fiscal Year Fiscal Year 2003 to 2002 to<br />
Expense Classification <strong>2004</strong> 2003 2002 <strong>2004</strong> 2003<br />
___________________ ___________________ ___________________ ______________ ______________<br />
Airfield $ 6,668,188 $ 7,118,577 $ 6,542,633 (6.3)% 8.8%<br />
Terminal Building 18,684,354 16,023,919 13,385,142 16.6% 19.7%<br />
Airside Buildings 14,558,486 14,228,730 12,301,327 2.3% 15.7%<br />
Commercial Landside 14,126,355 13,246,519 12,173,071 6.6% 8.8%<br />
Cargo 402,438 445,159 396,395 (9.6)% 12.3%<br />
Auxiliary <strong>Airport</strong>s 941,534 947,856 867,496 (0.7)% 9.3%<br />
General Aviation 438,260 413,634 473,086 0.6% (12.6)%<br />
Passenger Transfer System 2,776,560 2,710,074 2,255,462 2.5% 20.2%<br />
Roads and Grounds 5,378,920 5,442,293 4,279,061 (1.2)% 27.2%<br />
Other 1,688,938 1,461,778 1,270,687 15.5% 15.0%<br />
___________________ ___________________ ___________________ ______________ ______________<br />
$65,664,033 $62,038,539 $53,944,360 5.8% 15.0%<br />
___________________ ___________________ ___________________ ______________ ______________<br />
___________________ ___________________ ___________________ ______________ ______________<br />
The table above presents the major expense classifications for FY<strong>2004</strong>, FY2003 and FY2002. Total operating expenses for FY<strong>2004</strong> increased<br />
$3,625,500 (5.8%) over the prior fiscal year. The total actual expenses of $65,664,000 were within the budgeted amounts for the year<br />
(see “Highlights of the Fiscal Year <strong>2004</strong> Budget”). Total operating expenses for FY2003 increased $8,094,200 (15.0%) over the prior fiscal<br />
year. While this overall percentage increase compared to FY2002 is significant, it is important to note the FY2003 actual expenses were<br />
also within budgeted amounts and to also discuss the FY2002 results which were impacted by the cost containment program implemented<br />
after September 11, 2001 (see ”FY2003 Discussion of Operating Expenses”).<br />
20<br />
FY<strong>2004</strong> Discussion of Operating Expenses<br />
The airfield cost center expenses declined in FY<strong>2004</strong> over FY2003 as a result of the decrease in insurance expense for the <strong>Airport</strong> as well<br />
as less personnel costs being charged to this cost center. The increase in expenses in the terminal building cost center relate to the completion<br />
of the final phases of the outbound baggage handling system and security enhancement project. The Authority incurred approximately<br />
$1.35 million in additional operating expenses over the prior fiscal year to fully operate the new system. The system required the addition<br />
of 16 new personnel in FY<strong>2004</strong> and a significant increase in power consumption. Overall, the new system, of which several phases came<br />
on-line in FY2003, requires 39 personnel at a cost of $2.4 million and approximately $1 million in electricity to operate annually. This project<br />
is discussed in more detail in the “Capital Improvement Program” section of this MD&A. Other increases in operating expenses in the Terminal,<br />
Airside and Commercial Landside cost centers during FY<strong>2004</strong> reflect the continuation of the Authority to return to a normal level of customer<br />
service expected by the community and traveling public. Personnel expenses increased over the prior year due to the funding of additional<br />
positions, the cost of living adjustment in January <strong>2004</strong> and related benefit expenses. Increases in contractual maintenance, which include<br />
janitorial services, shuttle, elevator and escalator maintenance were $884,800 over the prior year. Due to a rate increase, the Authority<br />
incurred approximately $380,000 in additional electricity expenses for the year. Decreases in expenses occurred with the actual property<br />
and liability insurance for FY<strong>2004</strong> coming in $820,100 less than FY2003, and the elimination of inspection requirements at the short term<br />
parking garage entrance, which resulted in a decrease of $286,000.<br />
Other noted decreases in expenses occurred with the elimination of contractual law enforcement services provided by Hillsborough<br />
County, saving $412,200, the elimination of an outside towing service, saving $93,400, and reductions in the use of outside legal and<br />
engineering services, decreasing these expenses $163,800. These services and operational requirements are now provided by the Authority’s<br />
in-house personnel. It is important to note the Authority actively continues with cost containment efforts in controlling expenditures in all<br />
areas possible, including contracted services, contracted maintenance and other operating expenditures. This is evident by the cost per<br />
enplanement for the year of $4.21, compared to the budgeted amount of $4.70.<br />
FY2003 Discussion of Operating Expenses<br />
Significant changes during FY2003 resulted in considerable additional costs for the Authority. In mid-October 2002, new Airside E opened<br />
and Delta, United and Air Canada were relocated to this facility. Due to the requirements of the airlines, this airside was over 108,303<br />
square feet larger than Airside C, which was closed when the new airside commenced operations. The increased costs associated with<br />
operating the new Airside E and its passenger transfer system impacted FY2003 by approximately $1,195,600. The Authority incurred<br />
large increases in insurance costs and just the rise in property insurance premiums accounted for $1,624,400 in increased expenses. Also<br />
included in FY2003 were increases in operating expenditures due to additional security measures that were required by the TSA.<br />
After the events of September 11, 2001, the Authority adopted a FY2002 amended budget that significantly curtailed expenses. The cost<br />
containment measures in FY2002 reduced expenses by over $4 million over the original budget by reducing or cutting costs in all areas<br />
except those related to safety or security. As expected, this cost-cutting program, while certainly successful in controlling expenses,<br />
reduced the level of customer service and FY2003 marked the first step toward returning to a normal level of operations.<br />
With awareness of the foregoing, the following discusses specific variances within the operating expense area in FY2003 compared to<br />
FY2002. Salaries and wages increases of $2,625,900, along with associated increases in FICA and pension expenses were related to additional<br />
security requirements and the elimination of the hiring freeze. Overtime for FY2003 was reduced $351,700 over FY2002 with the<br />
implementation of twelve-hour shifts in the police and traffic departments and as new permanent positions fulfilled certain requirements<br />
that mandated the use of overtime in the prior fiscal year. Group health and workers’ compensation insurance increased $919,700 over<br />
the prior year as a result of increases in personnel and the rise in premiums. Janitorial costs, at $5,523,600 for FY2003, were $642,100 (a<br />
significant portion of this increase related to worker compensation insurance increases) over FY2002. Electricity expenses were $964,600<br />
over FY2002 with the additional energy requirements of Airside E, resumption of normal operating schedules for elevators, escalators and<br />
shuttle cars and the return of the terminal building to normal temperatures. As experienced in the past fiscal year, insurance costs continued<br />
to rise for the Authority, with FY2003 increasing $1,624,400 over the prior year. Even with the increases in expenses in FY2003, the<br />
Authority remained committed to providing quality services while maintaining a competitive cost structure for the airlines serving the airport.<br />
21
Summary of Changes in Net Assets<br />
The following is a summary of the statements of revenues, expenses and changes in net assets:<br />
Fiscal Year Fiscal Year Fiscal Year Change 2003 Change 2002<br />
<strong>2004</strong> 2003 2002 to <strong>2004</strong> to 2003<br />
___________________ ___________________ ___________________ ___________________ ___________________<br />
Operating Revenues<br />
Operating Grants and<br />
$137,385,122 $126,358,490 $116,876,030 $ 11,026,632 $ 9,482,460<br />
Reimbursements 1,430,182 3,787,348 1,989,150 (2,357,166) 1,798,198<br />
Operating Expenses<br />
Distribution of Airline<br />
65,664,033 62,038,539 53,944,315 3,625,494 8,094,224<br />
Revenue Sharing 6,906,692<br />
___________________<br />
5,254,849<br />
___________________<br />
5,388,897<br />
___________________<br />
1,651,843<br />
___________________<br />
(134,048)<br />
___________________<br />
Operating Income before<br />
Depreciation and<br />
Amortization<br />
Depreciation and<br />
66,244,579 62,852,450 59,531,968 3,392,129 3,320,482<br />
Amortization 59,996,075<br />
___________________<br />
41,617,751<br />
___________________<br />
45,974,034<br />
___________________<br />
18,378,324<br />
___________________<br />
(4,356,283)<br />
___________________<br />
Income from Operations<br />
Net Non-Operating<br />
6,248,504 21,234,699 13,557,934 (14,986,195) 7,676,765<br />
Expense 18,816,564 21,725,964 21,013,341 (2,909,400) 712,623<br />
Capital Contributions 54,581,033<br />
___________________<br />
57,552,837<br />
___________________<br />
44,536,925<br />
___________________<br />
(2,971,804)<br />
___________________<br />
13,015,912<br />
___________________<br />
Increase in Net Assets $ 42,012,973 $ 57,061,572 $ 37,081,518 $(15,048,599) $19,980,054<br />
___________________ ___________________ ___________________ ___________________ ___________________<br />
___________________ ___________________ ___________________ ___________________ ___________________<br />
Operating income before depreciation and amortization at $66,244,600 for FY<strong>2004</strong> is $3,392,100 higher than the previous year.<br />
Contributing to this positive variance is an increase in operating revenues of $11,026,600, offset by an increase in operating expenses of<br />
$3,625,500. In FY2003, operating income before depreciation and amortization was $3,320,500 over FY2002. Details of the operating<br />
revenues and expenses are more fully discussed in the previous section “<strong>Financial</strong> Highlights” of this MD&A.<br />
Depreciation and amortization expense, at $59,996,100 for the current year, was $18,378,300 higher than the FY2003 due to the<br />
impact of a full year of depreciation for assets that were capitalized at the end of FY2003. Another factor contributing to the additional<br />
depreciation relates to the completion of the new baggage handling system and the disposal of old system, which became obsolete for<br />
current requirements and needs. Depreciation and amortization expense of $41,617,800 in FY2003 was $4,356,300 lower than FY2002<br />
due to the accelerated depreciation of the Airside C building in FY2002. This airside was closed October 15, 2002, and the airlines were<br />
relocated to new Airside E. The Airside C Building has been demolished and reconstruction efforts are underway.<br />
Capital Contributions consists of Federal and State Grants and Passenger Facility Charges (PFCs), which are being received to fund various<br />
construction projects and the land acquisition program at the <strong>Airport</strong>. PFCs are collected at a $4.50 per passenger level by the airlines, of<br />
which $4.39 is remitted to the Authority. Due to the increase in enplaned passengers for FY<strong>2004</strong>, the collection of PFCs during FY<strong>2004</strong><br />
increased $3,583,000 (11.5%) over the prior year. This increase was offset by a decrease in state grants received in FY<strong>2004</strong> for the new<br />
outbound baggage system and federal and state grants that were received for the reconstruction of Airside C in FY2003. Capital contributions<br />
in FY2003 reflect a full year of receipt of PFCs at the $4.50 level (effective June 1, 2002, previously $3.00) with a total increase of<br />
$7,752,900 over FY2002. The balance of the variance for FY2003 is primarily due to the grants received for the new outbound baggage<br />
system and for the reconstruction of Airside C mentioned above.<br />
22<br />
Summary of Statements of Net Assets<br />
A summarized comparison of the Authority’s total assets, total liabilities and net assets at September 30, <strong>2004</strong>, 2003 and 2002 is as follows:<br />
Change 2003 Change 2002<br />
<strong>2004</strong> 2003 2002 to <strong>2004</strong> to 2003<br />
___________________ ___________________ ___________________ ___________________ ___________________<br />
Assets<br />
Current assets<br />
Current unrestricted<br />
assets<br />
Current restricted<br />
$ 25,907,831 $ 18,386,421 $ 52,326,592 $ 7,521,410 $ (33,940,171)<br />
assets<br />
Non-current assets<br />
165,188,124 256,249,616 104,637,671 (91,061,492) 151,611,945<br />
Capital assets, net<br />
Other non-current<br />
1,001,570,672 893,572,412 776,712,459 107,998,260 116,859,953<br />
assets 7,578,211<br />
___________________<br />
8,928,863<br />
___________________<br />
5,476,224<br />
___________________<br />
(1,350,652)<br />
___________________<br />
3,452,639<br />
___________________<br />
Total Assets $1,200,244,838 $1,177,137,312 $939,152,946 $ 23,107,526 $237,984,366<br />
___________________ ___________________ ___________________ ___________________ ___________________<br />
___________________ ___________________ ___________________ ___________________ ___________________<br />
Liabilities<br />
Current liabilities $ 64,722,642 $ 61,663,664 $ 63,592,428 $ 3,058,978 $ (1,928,764)<br />
Non-current liabilities 672,431,045<br />
___________________<br />
694,395,470<br />
___________________<br />
511,543,912<br />
___________________<br />
(21,964,425)<br />
___________________<br />
182,851,558<br />
___________________<br />
Total Liabilities 737,153,687 756,059,134 575,136,340 (18,905,447) 180,922,794<br />
___________________ ___________________ ___________________ ___________________ ___________________<br />
Net Assets<br />
Invested in capital<br />
assets, net of debt 369,044,731 339,523,551 306,240,304 29,521,180 33,283,247<br />
Restricted 70,632,151 63,633,500 16,686,541 6,998,651 46,946,959<br />
Unrestricted 23,414,269<br />
___________________<br />
17,921,127<br />
___________________<br />
41,089,761<br />
___________________<br />
5,493,142<br />
___________________<br />
(23,168,634)<br />
___________________<br />
Total Net Assets $ 463,091,151 $ 421,078,178 $364,016,606 $ 42,012,973 $ 57,061,572<br />
___________________ ___________________ ___________________ ___________________ ___________________<br />
___________________ ___________________ ___________________ ___________________ ___________________<br />
Current restricted assets decreased $91,061,500 in FY<strong>2004</strong>, primarily as a result of the use of construction bond funds in FY<strong>2004</strong> for the<br />
capital improvement program; the bonds were issued in FY2003. In FY2003, current assets increased $117,671,800 over FY2002, due to<br />
the bond funding received for the capital improvement program, offset by expenditures of construction funds in FY2003. Net capital assets<br />
increased $107,998,300 in FY<strong>2004</strong> over FY2003 and $116,860,000 in FY2003 over FY2002. Both years’ variances reflect the completion<br />
of major projects and the commencement of new capital spending under the capital improvement program.<br />
Current liabilities, with a balance of $64,722,600 at September 30, <strong>2004</strong>, were $3,059,000 higher than the balance at September 30,<br />
2003. The balance at September 30, 2003 of $61,633,664 was $1,928,000 less than the balance at September 30, 2002. The variances<br />
for each year are primarily due to the changes in the construction accounts payable. Non-current liabilities decreased $21,964,400 in<br />
FY<strong>2004</strong> over FY2003, primarily due to the principal payment of $19,395,000 on the revenue bonds and a $5,000,000 principal payment<br />
on the outstanding commercial paper program. Non-current liabilities in FY2003 increased $182,851,600 over FY2002, due to the issuance<br />
of new bond financing for the on-going capital program and refinancing of a portion of the commercial paper program, offset by a<br />
reduction of $18,440,000 of revenue bonds payable due to bond maturities.<br />
23
Total net assets in FY<strong>2004</strong> increased $42,013,000 over FY2003 reflecting grant and PFC contributions for capital projects totaling<br />
$54,581,0300, offset by a higher depreciation in the current year. In FY2003, total net assets increased $57,061,600 over the prior year<br />
reflecting capital contributions for capital projects totaling $57,552,800, offset by a net loss of $491,200 in FY2003.<br />
The FY2003 bond financing and the associated impact upon the capital program is discussed in more detail in subsequent sections of this<br />
MD&A (see “Capital Improvement Program”, “Capital Planning and Financing” and “Debt Management”).<br />
Capital Improvement Program<br />
The Authority’s approved FY<strong>2004</strong> Capital Budget, in the total amount of $72,010,000, continues an aggressive program to develop the<br />
necessary facilities and improvements to meet the demands of the aviation system for the <strong>Airport</strong>’s market area. Current year capital spending<br />
includes projects approved in prior years that are still under construction. During FY<strong>2004</strong>, the Authority expended $152,533,923 in its<br />
on-going capital improvement program.<br />
In early FY2003, Delta Airlines relocated from Airside C where they had operated for over 30 years, to a new Airside E facility with additional<br />
gates and operational space. The FY2003 Capital Budget included funds for the demolition and replacement of the Airside C building<br />
with a 12-gate facility ($119,731,800) to meet the growing needs of Southwest Airlines. The FY<strong>2004</strong> Capital Budget added funding of<br />
$15,072,200 to the Airside C project to increase the capacity of the planned facility to a 16-gate structure. The Authority will relocate airline<br />
tenants at Airside D to the space that will be vacated by Southwest Airlines at Airside A and to the additional gates in Airside C. Airside<br />
D, a 34-year-old structure, is the last of the original airsides at the <strong>Airport</strong> and will be closed upon the opening of new Airside C. The<br />
reconstruction of Airside C is scheduled for completion in the spring of 2005. Sources of funding for this project include grants, PFCs and<br />
revenue bonds.<br />
The outbound baggage system, a project originally approved in FY2003 at a cost of $107,235,000 was allocated additional funding of<br />
$19,587,900 in the FY<strong>2004</strong> Capital Budget. The outbound baggage system integrates in-line screening and eliminates the need for the<br />
passenger to transfer baggage from the airline ticket counter to the TSA screening point after checking in. The screening units on the<br />
ticket level were removed, increasing queuing and circulation space within the ticket level of the terminal. The new system, fully operational<br />
in FY<strong>2004</strong>, also converts the former manual load and transportation of baggage to a fully automated high-speed network with<br />
approximately four miles of conveyors, providing baggage tracking and sorting features. The Airside C related portion of this system will<br />
be brought on-line with the opening of the new airside. Major funding for the outbound baggage system is provided from state grants,<br />
PFCs and PFC backed revenue bonds. In addition, the Authority has requested a Letter of Intent from the TSA to assist in offsetting a portion<br />
of the costs of the new system.<br />
PFC Application #6, authorizing PFC collections in the amount of $298,115,400 was approved by the Federal Aviation Administration<br />
during FY2003, bringing the total collection authority for all PFC applications to $593,121,200. Through September 30, <strong>2004</strong>, $233,648,700<br />
revenue has been collected under these approved applications. Expenditures under the PFC applications through September 30, <strong>2004</strong><br />
total $440,029,000. Expenditures in excess of collections are funded from the issuance of PFC backed revenue bonds, commercial paper,<br />
or from Authority funds that will be reimbursed from PFCs.<br />
Capital Planning and Financing<br />
Typically, airports in the United States develop master plans that define the airports’ ultimate configuration at full development during<br />
20-year time spans, thereby establishing airport complex requirements. An update to the Authority’s last Master Plan is currently underway,<br />
with completion scheduled for late 2005. Master plans do not normally provide detailed information to determine funding strategies. The<br />
Authority periodically prepares (or updates) a Strategic Business Plan to provide a 10-year detailed funding analysis of operating expenses,<br />
revenues, and projected airline charges and establish development and financial goals along with measurement criteria. The plan’s overriding<br />
objective is to place the Authority in a healthy financial position without overburdening the air carriers, while maintaining competitive<br />
airline rates and charges. Funding strategies and recommendations will ensure airport facilities and improvements are brought on line<br />
when needed, based on established trigger points, are funded in a manner that preserves the Authority’s competitive cost structure, and<br />
maintains maximum flexibility under changing circumstances.<br />
The economic downturn and other events have resulted in negative impacts on the airline industry and forced major airlines to place<br />
significant emphasis on cost reductions and revenue improvement. Several air carriers have entered Chapter 11 bankruptcy proceedings,<br />
while others continue to search for ways to improve their operations. These events required the Authority to re-evaluate the last adopted<br />
business plan, update forecasts and determine the timing and scope of the Authority’s capital development program. The plan was updated<br />
and presented to the Authority’s Board at a workshop on January 23, 2003 and was subsequently adopted by the Board on February 5,<br />
24<br />
2003. The 2003 Strategic Business Plan, as approved, demonstrates the Authority’s ability to meet established goals while expanding<br />
<strong>Airport</strong> facilities to meet forecasted demand, sustain the <strong>Airport</strong>’s cost competitive rate structure and provide financial capacity for future<br />
development. An update to the Strategic Business Plan will be done in association with the Master Plan update.<br />
Debt Management<br />
At the end of the current fiscal year, the Authority had general airport revenue bonds outstanding in the total amount of $613,110,000.<br />
Of this total, $20,165,000 is current and will mature on October 1, 2005. All of the Authority’s long-term bonds were issued as insured debt.<br />
During FY<strong>2004</strong>, the Authority did not issue any new debt, although it is anticipated that in FY2005 an issuance of approximately<br />
$98,000,000 in revenue bonds will take place to provide funding for the car rental garages and counter relocation, and the economy<br />
public parking garage. These two projects were approved as part of the FY2005 Capital Budget.<br />
On February 19, 2003, the Authority issued the <strong>Tampa</strong> <strong>International</strong> <strong>Airport</strong> Revenue Bonds 2003 Series A and B, in the amounts of<br />
$195,290,000 and $43,735,000, respectively, to finance portions of the FY2003 capital program. The proceeds, along with other funds<br />
(federal grants, state grants, PFCs and Authority funds) were used to pay project costs, including the Airside C development program, the<br />
exterior dynamic sign package, the outbound baggage system and security enhancements, the service building expansion and the refunding<br />
of $50,000,000 of commercial paper notes. PFC collections will be used to pay principal and interest on the 2003 Series A bonds. In connection<br />
with these bond issues and prior to the sale of the bonds (during the month of January 2003), the Authority made presentations<br />
to and subsequently received ratings upgrades from each of the three rating agencies. Receiving upgrades from all three agencies at the<br />
same time is rare, and at the time, the Authority was one of only three airports to receive an upgrade since the events of September 11,<br />
2001. Specifically the rating actions were: Moody’s: A2 to A1, Standard & Poor’s: A to A+ and Fitch: A to A+. The all-inclusive interest average<br />
rate was 4.73% for the 2003 Series A and B revenue bonds. As part of the anticipated issuance of debt in FY2005, the Authority will again<br />
work with and make presentations to all rating agencies to ensure the Authority is rated at the highest level appropriate.<br />
In FY2003, with historically low interest rates, the Authority proceeded with the refunding of two existing bond issues. On July 8, 2003,<br />
the Authority issued $151,405,000 of <strong>Tampa</strong> <strong>International</strong> <strong>Airport</strong> Revenue Refunding Bonds, 2003 Series C and D. The Series C Bonds<br />
were issued to current refund the 1993 Series B refunded bonds maturing after October 1, 2003. This refunding resulted in a decrease in<br />
debt service over 17 years of $15,864,000 with a calculated net present value savings of $10,828,900. The Series D Bonds were issued<br />
to current refund the 1993 Series D bonds maturing after October 1, 2003. The refunding resulted in a decrease in debt service over 21<br />
years of $5,349,700 with a calculated net present value savings of $3,467,200. The all-inclusive interest cost (includes interest and all<br />
costs) for the 2003C Series bonds was 3.81% and for the 2003D series bonds was 4.53%. While all Authority issued bonds are exempt<br />
from income tax, the higher interest cost for the 2003D bonds is attributable to these bonds being subject to the Alternative Minimum Tax<br />
(AMT). The combined all-inclusive interest cost for these new issues was 4.07%. These interest costs were the lowest ever experienced by<br />
the Authority.<br />
On September 21, 2001, the Authority entered into a Reimbursement Agreement with Landesbank Baden-Württemberg, acting through<br />
its New York Branch (the “Bank”). Under this agreement, the Authority is allowed to issue an aggregate principal amount of not-to-exceed<br />
$105,000,000 outstanding at any one time of commercial paper notes. On February 19, 2003, the Authority refunded $50,000,000 of<br />
the outstanding Commercial Paper Notes with proceeds from the 2003 Series A <strong>Tampa</strong> <strong>International</strong> <strong>Airport</strong> Revenue Bonds. On March<br />
10, 2003, the Authority issued additional Series B Commercial Paper Notes in the amount of $14,276,000 to fund the repayment of a<br />
note with the State of Florida. During FY<strong>2004</strong>, the Authority made a principal payment of $5,000,000 on the outstanding balance. The<br />
current balance of the commercial paper notes at September 30, <strong>2004</strong> was $64,276,000. Proceeds from the initial issuance of the notes<br />
were used for authorized projects in the capital improvement program. It is the Authority’s intent to utilize PFC collections to repay both<br />
interest and principal on $64,276,000 of the current outstanding amounts.<br />
The Authority’s bond covenants require that revenues available to pay debt service, as defined in the Trust Agreement, exceed 1.25% of<br />
the annual debt service amount. The debt service coverage ratio for FY<strong>2004</strong> and FY2003 was 1.77 and 1.62, respectively.<br />
Request for Information<br />
This financial report is designed to provide a general overview of the Authority’s finances and to demonstrate the Authority’s accountability<br />
for the funds it receives and expends. Questions concerning this report or requests for additional information should be addressed to Ann<br />
Davis, Senior Director of Finance, Hillsborough County Aviation Authority, P.O. Box 22287, <strong>Tampa</strong>, FL 33622. Information of interest may<br />
also be obtained on Authority’s website at <strong>Tampa</strong><strong>Airport</strong>.com.<br />
25
STATEMENTS OF NET ASSETS<br />
SEPTEMBER 30, <strong>2004</strong> AND 2003<br />
26<br />
Hillsborough County<br />
Aviation Authority<br />
ASSETS <strong>2004</strong> 2003<br />
___________________ _ _ _ _ _ _ _ _ _ _ _ _ _ _<br />
CURRENT UNRESTRICTED:<br />
Cash and cash equivalents $ 29,701,556 $ 25,745,773<br />
Due to restricted funds<br />
Investment in direct financing lease–current<br />
(3,997,507) (7,735,757)<br />
and other current assets 203,782<br />
___________________<br />
376,405<br />
_ _ _ _ _ _ _ _ _ _ _ _ _ _<br />
Total current unrestricted assets 25,907,831 18,386,421<br />
___________________ _ _ _ _ _ _ _ _ _ _ _ _ _ _<br />
CURRENT RESTRICTED:<br />
Cash and cash equivalents 70,655,426 100,272,775<br />
Due from unrestricted funds 3,997,507 7,735,757<br />
Investments 76,613,820 129,551,236<br />
Accounts receivable–net 2,004,332 2,671,118<br />
Passenger facility charges contributions receivable 4,809,155 3,628,689<br />
Government grants receivable 5,236,333 10,621,039<br />
Accrued interest receivable 1,378,969 1,286,250<br />
Supplies inventory and other current assets 492,582<br />
___________________<br />
482,752<br />
_ _ _ _ _ _ _ _ _ _ _ _ _ _<br />
Total current restricted assets 165,188,124 256,249,616<br />
___________________ _ _ _ _ _ _ _ _ _ _ _ _ _ _<br />
Total current assets 191,095,955 274,636,037<br />
___________________ _ _ _ _ _ _ _ _ _ _ _ _ _ _<br />
CAPITAL ASSETS:<br />
Land 135,828,604 125,676,159<br />
Construction in progress 121,225,802 120,128,533<br />
Building, equipment, and improvements 1,196,166,379<br />
___________________<br />
1,052,501,935<br />
_ _ _ _ _ _ _ _ _ _ _ _ _ _<br />
1,453,220,785 1,298,306,627<br />
Less accumulated depreciation (451,650,113) (404,734,215)<br />
___________________ _ _ _ _ _ _ _ _ _ _ _ _ _ _<br />
Total capital assets–net 1,001,570,672 893,572,412<br />
___________________ _ _ _ _ _ _ _ _ _ _ _ _ _ _<br />
DEBT ISSUE COSTS (net of accumulated amortization<br />
of $2,986,958 and $2,020,079, respectively) 7,369,498 8,502,101<br />
NOTES AND OTHER RECEIVABLES 208,713 222,961<br />
INVESTMENT IN DIRECT FINANCING LEASE –<br />
___________________<br />
203,801<br />
_ _ _ _ _ _ _ _ _ _ _ _ _ _<br />
TOTAL ASSETS $1,200,244,838 $1,177,137,312<br />
___________________ _ _ _ _ _ _ _ _ _ _ _ _ _ _<br />
___________________ _ _ _ _ _ _ _ _ _ _ _ _ _ _<br />
(Continued)<br />
Hillsborough County<br />
Aviation Authority<br />
STATEMENTS OF NET ASSETS<br />
SEPTEMBER 30, <strong>2004</strong> AND 2003<br />
LIABILITIES AND EQUITY <strong>2004</strong> 2003<br />
___________________ _ _ _ _ _ _ _ _ _ _ _ _ _ _<br />
PAYABLE FROM UNRESTRICTED ASSETS:<br />
Accounts payable–construction $ 2,493,562<br />
___________________<br />
$ 669,096<br />
_ _ _ _ _ _ _ _ _ _ _ _ _ _<br />
CURRENT LIABILITIES PAYABLE FROM<br />
RESTRICTED ASSETS:<br />
Accounts payable–construction 23,586,249 19,919,550<br />
Accounts payable–trade 2,563,387 2,145,670<br />
Accrued expenses 13,065,998 11,827,538<br />
Accrued interest payable 124,102 106,674<br />
Current maturities of revenue bonds payable 20,165,000 19,395,000<br />
Current maturities of commercial paper notes – 5,000,000<br />
Deferred revenue and other liabilities 2,724,344<br />
___________________<br />
2,600,136<br />
_ _ _ _ _ _ _ _ _ _ _ _ _ _<br />
Total restricted liabilities 62,229,080 60,994,568<br />
___________________ _ _ _ _ _ _ _ _ _ _ _ _ _ _<br />
Total current liabilities 64,722,642 61,663,664<br />
___________________ _ _ _ _ _ _ _ _ _ _ _ _ _ _<br />
NONCURRENT LIABILITIES:<br />
Revenue bonds payable, less current maturities<br />
(net of deferred loss and bond premium of $14,771,617 in <strong>2004</strong><br />
and $16,498,453 in 2003, respectively) 607,716,617 629,608,459<br />
Commercial paper notes payable, less current maturities 64,276,000 64,276,000<br />
Other liabilities 438,428<br />
___________________<br />
511,011<br />
_ _ _ _ _ _ _ _ _ _ _ _ _ _<br />
Total noncurrent liabilities 672,431,045 694,395,470<br />
___________________ _ _ _ _ _ _ _ _ _ _ _ _ _ _<br />
Total liabilities 737,153,687 756,059,134<br />
___________________ _ _ _ _ _ _ _ _ _ _ _ _ _ _<br />
COMMITMENTS AND CONTINGENCIES (Notes 10 and 11)<br />
NET ASSETS:<br />
Invested in capital assets–net of related debt<br />
Restricted for acquisition of property, equipment, and<br />
369,044,731 339,523,551<br />
construction projects–net of related payables and debt 32,609,286 14,975,916<br />
Restricted for other uses 38,022,865 48,657,584<br />
Unrestricted 23,414,269<br />
___________________<br />
17,921,127<br />
_ _ _ _ _ _ _ _ _ _ _ _ _ _<br />
TOTAL NET ASSETS 463,091,151 421,078,178<br />
___________________ _ _ _ _ _ _ _ _ _ _ _ _ _ _<br />
TOTAL LIABILITIES AND NET ASSETS $1,200,244,838 $1,177,137,312<br />
___________________ _ _ _ _ _ _ _ _ _ _ _ _ _ _<br />
___________________ _ _ _ _ _ _ _ _ _ _ _ _ _ _<br />
See accompanying Notes to <strong>Financial</strong> Statements.<br />
(Concluded)<br />
27
STATEMENTS OF REVENUES, EXPENSES, AND CHANGES IN NET ASSETS<br />
FOR THE YEARS ENDED SEPTEMBER 30, <strong>2004</strong> AND 2003<br />
28<br />
OPERATING REVENUES:<br />
Hillsborough County<br />
Aviation Authority<br />
<strong>2004</strong> 2003<br />
___________________ _ _ _ _ _ _ _ _ _ _ _ _ _ _<br />
Airfield $ 9,957,737 $ 9,057,481<br />
Terminal building 30,499,660 26,655,750<br />
Airside buildings 16,009,562 16,681,825<br />
Commercial landside 71,068,176 64,791,477<br />
Cargo 1,935,081 1,681,681<br />
Auxiliary airports 594,772 563,695<br />
General aviation 841,999 778,138<br />
Other 6,478,135 6,148,443<br />
___________________ _ _ _ _ _ _ _ _ _ _ _ _ _ _<br />
Total operating revenues 137,385,122 126,358,490<br />
___________________ _ _ _ _ _ _ _ _ _ _ _ _ _ _<br />
OPERATING GRANTS AND REIMBURSEMENTS 1,430,182 3,787,348<br />
___________________ _ _ _ _ _ _ _ _ _ _ _ _ _ _<br />
OPERATING EXPENSES:<br />
Airfield 6,668,188 7,118,577<br />
Terminal building 18,684,354 16,023,919<br />
Airside buildings 14,558,486 14,228,730<br />
Commercial landside 14,126,355 13,246,519<br />
Cargo 402,438 445,159<br />
Auxiliary airports 941,534 947,856<br />
General avaition 438,260 413,634<br />
Passenger transfer system 2,776,560 2,710,074<br />
Roads and grounds 5,378,920 5,442,293<br />
Other 1,688,938 1,461,778<br />
___________________ _ _ _ _ _ _ _ _ _ _ _ _ _ _<br />
Total operating expenses before signatory airline<br />
net revenue sharing 65,664,033 62,038,539<br />
___________________ _ _ _ _ _ _ _ _ _ _ _ _ _ _<br />
SIGNATORY AIRLINE NET REVENUE SHARING 6,906,692 5,254,849<br />
___________________ _ _ _ _ _ _ _ _ _ _ _ _ _ _<br />
OPERATING INCOME BEFORE DEPRECIATION<br />
AND AMORTIZATION 66,244,579 62,852,450<br />
DEPRECIATION AND AMORTIZATION 59,996,075<br />
___________________<br />
41,617,751<br />
_ _ _ _ _ _ _ _ _ _ _ _ _ _<br />
INCOME FROM OPERATIONS<br />
NONOPERATING REVENUES AND EXPENSES:<br />
6,248,504 21,234,699<br />
Interest income 3,784,447 3,413,763<br />
Bonds and commercial paper interest expense (22,601,011)<br />
___________________<br />
(25,139,727)<br />
_ _ _ _ _ _ _ _ _ _ _ _ _ _<br />
Total nonoperating expenses–net (18,816,564) (21,725,964)<br />
___________________ _ _ _ _ _ _ _ _ _ _ _ _ _ _<br />
LOSS BEFORE CONTRIBUTIONS $(12,568,060) $ (491,265)<br />
___________________ _ _ _ _ _ _ _ _ _ _ _ _ _ _<br />
(Continued)<br />
Hillsborough County<br />
Aviation Authority<br />
STATEMENTS OF REVENUES, EXPENSES, AND CHANGES IN NET ASSETS<br />
FOR THE YEARS ENDED SEPTEMBER 30, <strong>2004</strong> AND 2003<br />
<strong>2004</strong> 2003<br />
___________________ _ _ _ _ _ _ _ _ _ _ _ _ _ _<br />
CONTRIBUTIONS FOR CAPITAL PROJECTS:<br />
Passenger facility charges $ 34,765,028 $ 31,182,018<br />
Federal and state grants 19,816,005<br />
___________________<br />
26,370,819<br />
_ _ _ _ _ _ _ _ _ _ _ _ _ _<br />
Total contributions for capital projects 54,581,033 57,552,837<br />
___________________ _ _ _ _ _ _ _ _ _ _ _ _ _ _<br />
INCREASE IN NET ASSETS 42,012,973 57,061,572<br />
TOTAL NET ASSETS–Beginning of year 421,078,178<br />
___________________<br />
364,016,606<br />
_ _ _ _ _ _ _ _ _ _ _ _ _ _<br />
TOTAL NET ASSETS–End of year $463,091,151 $421,078,178<br />
___________________ _ _ _ _ _ _ _ _ _ _ _ _ _ _<br />
___________________ _ _ _ _ _ _ _ _ _ _ _ _ _ _<br />
See accompanying Notes to <strong>Financial</strong> Statements.<br />
(Concluded)<br />
29
STATEMENTS OF CASH FLOWS<br />
FOR THE YEARS ENDED SEPTEMBER 30, <strong>2004</strong> AND 2003<br />
30<br />
Hillsborough County<br />
Aviation Authority<br />
<strong>2004</strong> 2003<br />
___________________ _ _ _ _ _ _ _ _ _ _ _ _ _ _<br />
CASH FLOWS FROM OPERATING ACTIVITIES:<br />
Operating cash receipts from customers $138,093,703 $126,894,696<br />
Operating grants received 1,430,182 3,787,348<br />
Cash payments to suppliers for goods and services (47,609,626) (44,498,368)<br />
Cash payments to employees for services (23,139,200)<br />
___________________<br />
(21,695,769)<br />
_ _ _ _ _ _ _ _ _ _ _ _ _ _<br />
Net cash provided by operating activities 68,775,059 64,487,907<br />
___________________ _ _ _ _ _ _ _ _ _ _ _ _ _ _<br />
CASH FLOWS FROM CAPITAL AND RELATED<br />
FINANCING ACTIVITIES:<br />
Proceeds from the issuance of revenue bonds–net of<br />
bond issue costs and premiums<br />
Proceeds from sale of revenue refunding bonds–net of<br />
– 248,945,827<br />
bond issue costs and discounts – 163,744,760<br />
Principal and premium paid on revenue bond refundings (164,807,229)<br />
Repayment of note payable to State of Florida – (14,257,667)<br />
Acquisition and construction of capital assets–net (152,533,927) (156,906,584)<br />
Principal paid on revenue bond maturities and notes (24,395,000) (68,440,000)<br />
Proceeds from commercial paper notes–net of issue costs – 14,257,161<br />
Interest paid on revenue bonds and bond anticipation notes (33,970,335) (31,626,174)<br />
Net proceeds from direct financing lease and other current assets 390,672 367,198<br />
Federal and state grants 25,200,711 21,671,508<br />
Passenger Facility Charges 33,584,562<br />
___________________<br />
30,265,281<br />
_ _ _ _ _ _ _ _ _ _ _ _ _ _<br />
Net cash (used in) provided by capital and related<br />
financing activities (151,723,317) 43,214,081<br />
___________________ _ _ _ _ _ _ _ _ _ _ _ _ _ _<br />
CASH FLOWS FROM INVESTING ACTIVITIES:<br />
Purchases of investment securities (76,613,820) (129,551,236)<br />
Proceeds from maturities of investment securities 129,551,236 41,024,495<br />
Interest income received on investments 4,349,276<br />
___________________<br />
4,116,860<br />
_ _ _ _ _ _ _ _ _ _ _ _ _ _<br />
Net cash provided by (used in) investing activities 57,286,692 (84,409,881)<br />
___________________ _ _ _ _ _ _ _ _ _ _ _ _ _ _<br />
NET (DECREASE) INCREASE IN CASH AND CASH EQUIVALENTS (25,661,566) 23,292,107<br />
CASH AND CASH EQUIVALENTS–Beginning of year 126,018,548<br />
___________________<br />
102,726,441<br />
_ _ _ _ _ _ _ _ _ _ _ _ _ _<br />
CASH AND CASH EQUIVALENTS–End of year $100,356,982 $126,018,548<br />
___________________ _ _ _ _ _ _ _ _ _ _ _ _ _ _<br />
(Continued)<br />
Hillsborough County<br />
Aviation Authority<br />
STATEMENTS OF CASH FLOWS<br />
FOR THE YEARS ENDED SEPTEMBER 30, <strong>2004</strong> AND 2003<br />
<strong>2004</strong> 2003<br />
___________________ _ _ _ _ _ _ _ _ _ _ _ _ _ _<br />
RECONCILIATION OF OPERATING INCOME TO NET<br />
CASH PROVIDED BY OPERATING ACTIVITIES:<br />
Income from operations<br />
Adjustments to reconcile operating income to net cash<br />
provided by operating activities:<br />
$ 6,248,504 $21,234,699<br />
Depreciation and amortization 59,996,075 41,617,751<br />
Decrease in accounts receivable 666,786 56,633<br />
(Increase) in supplies inventory and other (9,830) (85,856)<br />
Increase (decrease) in accounts payable–trade 417,717 (218,746)<br />
Increase in accrued expenses 1,404,182 1,317,997<br />
Increase in deferred revenue 51,625<br />
___________________<br />
565,429<br />
_ _ _ _ _ _ _ _ _ _ _ _ _ _<br />
Net cash provided by operating activities $68,775,059 $64,487,907<br />
___________________ _ _ _ _ _ _ _ _ _ _ _ _ _ _<br />
___________________ _ _ _ _ _ _ _ _ _ _ _ _ _ _<br />
See accompanying Notes to <strong>Financial</strong> Statements.<br />
(Concluded)<br />
31
NOTES TO FINANCIAL STATEMENTS<br />
SEPTEMBER 30, <strong>2004</strong> AND 2003<br />
1. GENERAL<br />
Description The Hillsborough County Aviation Authority (the “Authority”) was created in 1945 as an independent special district governed<br />
by the Hillsborough County Aviation Authority Act, Chapter 2003-370, Laws of Florida (the “Act”). The Act provides that the Authority has<br />
exclusive jurisdiction, control, supervision and management over all public airports within Hillsborough County. As such, the Authority is<br />
authorized to issue revenue bonds to finance the construction of aviation-related projects. Revenue bonds issued by the Authority are<br />
payable solely from revenues of the Authority and are not obligations of the City of <strong>Tampa</strong>, Hillsborough County, or the State of Florida.<br />
Pursuant to the general laws of Florida, the Authority owns and operates <strong>Tampa</strong> <strong>International</strong> <strong>Airport</strong> (the “<strong>Airport</strong>”) and three general<br />
aviation airports (collectively the “<strong>Airport</strong> System”).<br />
In connection with the Authority’s issuance and sale of $67,000,000 principal amount of Revenue Bonds dated October 1, 1968, the<br />
Authority entered into the 1968 Trust Agreement. Since the date of its execution, the Authority has, concurrently with each revenue bond<br />
issue beginning in 1981, made various amendments and modifications to the terms of the original 1968 Trust Agreement. Many of these<br />
amendments were contingent upon the receipt of the requisite consent of the bondholders. Some amendments were prepared in “conceptual”<br />
form, awaiting definitive language to be prepared at the discretion of the Authority. During fiscal year 1999, the Authority received<br />
the requisite bondholder consent for all the definitive amendments, and the 1968 Trust Agreement, as amended was codified and<br />
restated (the “Trust Agreement”).<br />
Pursuant to the provisions of the Trust Agreement, the Authority entered into lease agreements with certain airlines (the “Signatory Airlines”)<br />
serving the <strong>Airport</strong>. These lease agreements provide the basis of determining airline facility rentals and landing fees on an annual basis.<br />
The agreements, in effect since 1970, with the Signatory Airlines serving <strong>Tampa</strong> <strong>International</strong> <strong>Airport</strong> (the “Prior Agreements”) expired on<br />
September 30, 1999. Effective October 1, 1999, the Authority executed new Airline-<strong>Airport</strong> Use and Lease Agreements with the Signatory<br />
Airlines (the “Agreements”), which have terms of seven years and expire on September 30, 2006. (See Note 3—Rate Making Policy)<br />
Basis of Presentation The Authority operates the <strong>Airport</strong> System as a single enterprise fund with multiple cost centers to account for the<br />
costs of services. Costs are recovered in the form of charges to users for such services.<br />
2. SUMMARY OF SIGNIFICANT ACCOUNTING POLICIES<br />
Basis of Accounting The Authority’s financial statements are presented in accordance with generally accepted accounting principles. The<br />
Authority applies all applicable pronouncements of the <strong>Financial</strong> Accounting Standards Board issued on or before November 30, 1989,<br />
and all applicable pronouncements required by the Governmental Accounting Standards Board (“GASB”). The Authority’s significant financial<br />
and accounting policies utilized in formulating these financial statements are as follows:<br />
Cash and Cash Equivalents For purposes of the Statements of Cash Flows, the Authority classifies investments in short-term repurchase<br />
agreements and investments with original maturities less than three months from the date of purchase as cash equivalents.<br />
Interfund Advances The Authority uses its unrestricted current assets to pre-fund or provide funding for certain projects in the <strong>Airport</strong><br />
System. These amounts are shown as “Due (to) from Restricted Funds” and “Due from (to) Unrestricted Funds” in the accompanying<br />
Statements of Net Assets. Such advances typically are not interest bearing.<br />
Investments The Authority invests in overnight repurchase agreements and short-term direct treasuries which are recorded at cost. Since<br />
the term of the instruments is of such short duration the Authority believes cost represents their market as well as fair values. Investments<br />
are also held in collateralized time deposits, which are restricted in their use and may only be liquidated based on their face values. These<br />
deposits are collateralized by U.S. government obligations at 102% of their face values, and the collateral is marked to market at least<br />
weekly. The deposits are recorded at their face values, which are their market and fair values.<br />
Accounts Receivable The Authority provides an allowance for doubtful accounts based on the expected collectibility of outstanding balances.<br />
32<br />
Hillsborough County<br />
Aviation Authority<br />
Grants Grants received from federal and state governmental agencies which are restricted for the acquisition or construction of capital<br />
assets are recorded as contributions for capital projects when earned. Grants are earned when costs relating to such capital assets, which<br />
are reimbursable under the terms of the grants, have been incurred. Depreciation on assets acquired or constructed with government<br />
grant monies is included in “Depreciation and Amortization” in the accompanying Statements of Revenues, Expenses, and Changes in Net<br />
Assets. Operating grants received from the Federal Aviation Administration (“FAA”), the Transportation Security Administration, and Florida<br />
Department of Transportation that are used to partially offset security costs for the implementation of federally mandated security requirements<br />
and other related operating and maintenance costs are recorded separately from capital grants and are included as Operating Grants and<br />
Reimbursements in the Statements of Revenues, Expenses, and Changes in Net Assets.<br />
Passenger Facility Charges (“PFCs”) PFCs are imposed at $4.50 per enplaned passenger and are restricted for use on pre-approved<br />
projects. PFCs are recorded as contributions for capital projects in the accompanying Statements of Revenues, Expenses, and Changes in<br />
Net Assets.<br />
Supplies Inventory Inventory consists of supplies and materials used in maintenance of the <strong>Airport</strong> System and is valued at lower of<br />
average cost or market. The purchase of supplies inventory is from a restricted operations and maintenance fund.<br />
Debt Issue Costs and Bond Discounts and Premiums Debt issue costs and bond discounts and premiums are deferred in the year of<br />
issuance and amortized using the effective interest method over the life of the issue. Losses on bond refundings are deferred and amortized<br />
over the shorter of the remaining life of the original issue or the life of the new issue.<br />
Interest Costs Interest costs incurred during periods of construction are capitalized as a component of the assets to which these costs<br />
relate for all projects except those funded through the rate making process, grants and PFCs (see Note 3). In situations involving qualifying<br />
assets financed with the proceeds of tax-exempt debt, the amount of interest capitalized is reduced by any interest income earned on the<br />
temporary investment of such monies. Interest is capitalized throughout the construction period and is amortized on a straight-line basis<br />
over the estimated useful life of the respective asset after the project is substantially completed.<br />
Capital Assets Capital assets are recorded at cost and are depreciated using the straight-line method over their estimated useful lives<br />
as follows:<br />
Structures and improvements 10-40 Years<br />
Runways, taxiways and aprons 10-30 Years<br />
Equipment, furniture and fixtures 3-15 Years<br />
On an annual basis, the Authority evaluates the useful lives of capital assets and writes off net capitalized costs of assets with no future<br />
value. Net capitalized costs written off are included with the financial statement line item “Depreciation and Amortization”.<br />
Use of Estimates The preparation of financial statements in conformity with generally accepted accounting principles requires management<br />
to make estimates and assumptions that affect the reported amounts of assets and liabilities and disclosure of contingent assets and<br />
liabilities at the date of the financial statements and the reported amounts of contributions and expenses during the reporting period.<br />
Actual results could differ from those estimated.<br />
Revenue Classifications The components of the major operating revenue classifications are as follows:<br />
Airfield Fees for landing of cargo and passenger aircraft.<br />
Terminal Building Airline space rentals in passenger terminal building, privilege fees for the operation of terminal complex concessions<br />
of food and beverage, general merchandise and duty-free store, and other miscellaneous fees in terminal building.<br />
Airside Buildings Rentals of facilities space at airsides and other miscellaneous fees at the airside buildings.<br />
Commercial Landside Automobile parking fees, rent-a-car privilege fees and space rental, privilege fees for the operation of the hotel<br />
and permit fees of off-airport rental cars and limousine/cab.<br />
Cargo Cargo space rentals, apron rentals, fuel flowage fees, and other grounds rental.<br />
Auxiliary <strong>Airport</strong>s Fees from services at all airports operated by the Authority, other than <strong>Tampa</strong> <strong>International</strong> <strong>Airport</strong>.<br />
General Aviation Fees from services for general aviation activities at <strong>Tampa</strong> <strong>International</strong> <strong>Airport</strong>.<br />
Other Fees from aviation supporting facilities provided to tenants, rentals from nonaviation properties, reimbursement for utilities, and<br />
other miscellaneous income.<br />
33
Reclassifications Certain amounts in the 2003 financial statements have been reclassified to conform to the presentation of the <strong>2004</strong><br />
financial statements.<br />
Recent Accounting Pronouncements In March 2003, the GASB issued Statement No. 40, Deposit and Investment Risk Disclosures, which<br />
amends the disclosures required by Statement No. 3, Deposits with <strong>Financial</strong> Institutions, Investments (including Repurchase Agreements), and<br />
Reverse Repurchase Agreements. Portions of that Statement are modified or eliminated. Accordingly, management believes that the implementation<br />
of this Statement will only impact the Authority’s financial statement presentation. The provisions of this Statement are effective<br />
for financial statements for periods beginning after June 15, <strong>2004</strong>.<br />
In November 2003, the GASB issued Statements No. 42, Accounting and <strong>Financial</strong> <strong>Report</strong>ing for Impairment of Capital Assets and for<br />
Insurance Recoveries. This statement is effective for the Authority beginning in fiscal year 2005. Management believes that the adoption of<br />
this statement will have no effect on its financial position or results of operations; however, there will be improvements in financial reporting.<br />
Users of financial statements will better understand when impairments have occurred and what their impact is on the Authority.<br />
3. RATE MAKING POLICY<br />
The Trust Agreement states the Authority, not taking into consideration any money received from federal and state grants, PFCs, ad valorem<br />
taxes, and certain other monies, will fix and establish or revise, as needed, rental rates and other charges for use of the services and facilities<br />
of the <strong>Airport</strong> System, which will be sufficient in each fiscal year to make payments and deposits, as required under the Trust Agreement.<br />
Currently, all bonds and outstanding debt of the Authority are issued under the Trust Agreement, and these covenants are reiterated in<br />
each Official Statement of bonds issued.<br />
The Agreements incorporate the lease and use of the Terminal Building, Airsides A, C, D, E, F, any future Airside Buildings, and the Airfield<br />
at the <strong>Tampa</strong> <strong>International</strong> <strong>Airport</strong>. The Agreements establish a “compensatory” rate-making methodology where the airlines pay the<br />
Authority fees and charges based on the Authority’s cost of providing facilities and services. The costs to be allocated to the Signatory Airlines<br />
include operating and maintenance expenditures, debt service, debt service coverage of 25%, Trust Fund minimum deposit requirements,<br />
and a return on investment for Authority funds used for capital projects. The new Agreements incorporate all of the covenants contained in<br />
the Trust Agreement governing the issuance of <strong>Airport</strong> Revenue Bonds. They also provide the Signatory Airlines with a net revenue sharing<br />
provision. The amounts returned to the Signatory Airlines under this provision for the years ended September 30, <strong>2004</strong> and 2003, were<br />
$6,906,692 and $5,254,849, respectively. These amounts are included in accrued expenses in the accompanying Statements of Net<br />
Assets. The amounts are also presented as a separate item after Operating Expenses on the Statements of Revenues, Expenses, and<br />
Changes in Net Assets. The financial statement line item “Depreciation and Amortization” is excluded from the rate-making process.<br />
4. CASH AND INVESTMENTS<br />
At September 30, <strong>2004</strong>, the bank balance of the Authority’s deposits and investments was $214,266,923, and the book balance was<br />
$176,970,802. At September 30, 2003, the bank balance of the Authority’s deposits and investments was $256,408,696, and the book<br />
balance was $255,569,784. The difference between the Authority’s book amount and the bank amount is due to outstanding checks and<br />
transfers, and deposits in transit in its demand accounts. Of the September 30, <strong>2004</strong> bank balance, $100,000 was covered by federal<br />
depository insurance and $44,310,932 was collateralized by the State of Florida collateral pool. Of the September 30, 2003 bank balance,<br />
$100,000 was covered by federal depository insurance and $40,318,604 was collateralized by the State of Florida collateral pool.<br />
The State of Florida collateral pool is a multiple financial institution pool with the ability to assess its members for collateral shortfalls if a<br />
member institution fails. Required collateral is defined under Chapter 280 of the Florida Statutes, Security for Public Deposits. As of<br />
September 30, <strong>2004</strong> and 2003, funds of $55,642,115 and $37,993,449 was invested in the State Board of Administration (“SBA”)<br />
accounts, respectively. There were no current or prior year losses, which were attributable to default by counterparties to deposit or<br />
investment transactions.<br />
The Trust Agreement allows the Authority to invest its restricted funds in direct obligations of the United States of America or obligations<br />
which are unconditionally guaranteed by the United States of America. Unrestricted funds may be invested at the discretion of the<br />
Authority in accordance with State law.<br />
Cash and cash equivalents and investments held at September 30, <strong>2004</strong> and 2003, are categorized in the following table to give an<br />
indication of the level of risk assumed by the Authority at year-end. Category 1 includes cash and cash equivalents and investments that<br />
are insured or registered or for which the securities are held by the Authority or its agent in the Authority’s name. The Authority’s Category<br />
1 includes cash and cash equivalents held in banks that are members of the State of Florida collateral pool, certificates of deposits and<br />
34<br />
U.S. Government Securities held in the name of the Authority and time deposits that are collateralized with securities held by the bank’s<br />
trust department in the Authority’s name. Category 2 includes uninsured and unregistered investments for which the securities are held by<br />
the bank’s trust department or agent in the Authority’s name. The Authority had no Category 2 investments at September 30, <strong>2004</strong> or<br />
2003. Category 3 includes uninsured and unregistered investments for which the securities are held by the broker or dealer, or by its trust<br />
department or agent, but not in the Authority’s name. The Authority’s Category 3 cash, cash equivalents and investments consist of U.S.<br />
Government Securities held by the bank’s trust department, but not in the name of the Authority, cash deposits held for payment of debt<br />
service and short-term repurchase agreements, generally executed for no longer than one month. All repurchase agreements outstanding<br />
at September 30, <strong>2004</strong> were liquidated by the Authority during October <strong>2004</strong>.<br />
September 30, <strong>2004</strong><br />
Category Category Balance on Fair<br />
1<br />
___________________<br />
3<br />
___________________<br />
Deposit<br />
___________________<br />
Value<br />
___________________<br />
Unrestricted<br />
Cash and Cash Equivalents $ 68,414<br />
___________________<br />
$29,633,142<br />
___________________ $ 29,701,556<br />
___________________ $ 29,701,556<br />
___________________<br />
Restricted<br />
Repurchase Agreements $ – $21,361,063 $ 21,361,063 $ 21,361,063<br />
Time Deposits 22,030,063 – 22,030,063 22,030,063<br />
U.S. Government Securities 55,482,698 – 55,482,698 55,482,698<br />
Cash and Cash Equivalents 13,042,872 72,648,671 85,691,543 85,691,543<br />
___________________ ___________________ ___________________ ___________________<br />
$ 90,555,633 $94,009,734 $184,565,367 $184,565,367<br />
___________________ ___________________ ___________________ ___________________<br />
___________________ ___________________ ___________________ ___________________<br />
September 30, 2003<br />
Category Category Balance on Fair<br />
1<br />
___________________<br />
3<br />
___________________<br />
Deposit<br />
___________________<br />
Value<br />
___________________<br />
Unrestricted<br />
Repurchase Agreements $ – $ 5,390,432 $ 5,390,432 $ 5,390,432<br />
Cash and Cash Equivalents 97,245 20,258,096 20,355,341 20,355,341<br />
___________________ ___________________ ___________________ ___________________<br />
$ 97,245 $25,648,528 $ 25,745,773 $ 25,745,773<br />
___________________ ___________________ ___________________ ___________________<br />
___________________ ___________________ ___________________ ___________________<br />
Restricted<br />
Repurchase Agreements $ – $20,443,874 $ 20,443,874 $ 20,443,874<br />
Time Deposits 39,793,063 – 39,793,063 39,793,063<br />
U.S. Government Securities 136,057,580 – 136,057,580 136,057,580<br />
Cash and Cash Equivalents 14,452,739 19,915,667 34,368,406 34,368,406<br />
___________________ ___________________ ___________________ ___________________<br />
$190,303,382 $40,359,541 $230,662,923 $230,662,923<br />
___________________ ___________________ ___________________ ___________________<br />
___________________ ___________________ ___________________ ___________________<br />
35
5. RESTRICTED ASSETS<br />
The Trust Agreement, among other things, requires all airport revenues, excluding PFCs, grants, bond proceeds and their earnings, and<br />
revenues from certain nontrust funded projects, be deposited in the Revenue Fund, the establishment of certain trust accounts, and<br />
defines the priority and flow of cash receipts. Certain of these trust accounts require specified balances and are restricted as to use. Bond<br />
proceeds issued for construction are held by a trustee appointed by the Authority per the bond agreement. Debt Service and Debt<br />
Reserve accounts are held by a trustee designated by the Trust Agreement and are pledged as collateral for debt service. A summary of<br />
the balances in these accounts as of September 30, <strong>2004</strong> and 2003, is as follows:<br />
36<br />
Trust Account Name <strong>2004</strong> 2003<br />
___________________ _ _ _ _ _ _ _ _ _ _ _ _ _ _<br />
Restricted for debt service:<br />
Bond Principal, Interest and Redemption Sinking Fund $ 896,284 $ 2,143,612<br />
Bond Reserve Fund<br />
Restricted to acquisition of property and equipment:<br />
62,543,376 62,689,814<br />
Equipment Fund 483,244 340,958<br />
Construction Funds<br />
Restricted to operating expenses:<br />
53,491,991 135,294,759<br />
Operating Reserve Account 11,175,245 10,473,444<br />
Operation and Maintenance 6,209,415<br />
___________________<br />
5,002,909<br />
_ _ _ _ _ _ _ _ _ _ _ _ _ _<br />
134,799,555 215,945,496<br />
___________________ _ _ _ _ _ _ _ _ _ _ _ _ _ _<br />
Other restricted funds:<br />
Revenue Funds 15,128,425 17,148,856<br />
Escrow and Forfeiture Deposits 724,567 687,027<br />
Capital Acquisition 10,045,488 14,249,728<br />
Supplies Inventory and Other Current Assets 492,582 482,752<br />
___________________ _ _ _ _ _ _ _ _ _ _ _ _ _ _<br />
26,391,062 32,568,363<br />
___________________ _ _ _ _ _ _ _ _ _ _ _ _ _ _<br />
Due from unrestricted assets 3,997,507 7,735,757<br />
___________________ _ _ _ _ _ _ _ _ _ _ _ _ _ _<br />
Total current restricted assets $165,188,124 $256,249,616<br />
___________________ _ _ _ _ _ _ _ _ _ _ _ _ _ _<br />
___________________ _ _ _ _ _ _ _ _ _ _ _ _ _ _<br />
6. LEASES<br />
The Authority is the lessor of various properties at <strong>Tampa</strong> <strong>International</strong> <strong>Airport</strong>. Among these properties are the concession areas, restaurants<br />
and lounges, airsides and rental car areas. All leases are cancelable. In 1981, the Authority constructed an airline reservation center.<br />
The facility is under a direct financing lease with Continental Airlines, Inc. In connection with the lease agreement, the Authority received<br />
$429,000 annually in year <strong>2004</strong> and will receive $222,000 in year 2005 under the agreement. The components of the lease agreement<br />
at September 30, <strong>2004</strong> and 2003 are as follows:<br />
<strong>2004</strong> 2003<br />
___________________ _ _ _ _ _ _ _ _ _ _ _ _ _ _<br />
Net minimum lease payments receivable $222,143 $650,707<br />
Less unearned income (18,342)<br />
___________________<br />
(70,556)<br />
_ _ _ _ _ _ _ _ _ _ _ _ _ _<br />
Net investment in direct financing lease 203,801 580,151<br />
Less current portion (203,801)<br />
___________________<br />
(376,350)<br />
_ _ _ _ _ _ _ _ _ _ _ _ _ _<br />
Net long-term investment in direct financing lease $ – $203,801<br />
___________________ _ _ _ _ _ _ _ _ _ _ _ _ _ _<br />
___________________ _ _ _ _ _ _ _ _ _ _ _ _ _ _<br />
7. CAPITAL ASSETS<br />
Capital asset activity for the years ended September 30, <strong>2004</strong> and 2003 is summarized as follows:<br />
Balance Additions Deletions Balance<br />
October 1, and and September 30,<br />
2003 Reclasses Reclasses <strong>2004</strong><br />
___________________ ___________________ ___________________ ___________________<br />
Land $125,676,159 $ 9,819,458 $ 332,987 $ 135,828,604<br />
Construction in progress 120,128,533 150,515,918 (149,418,649) 121,225,802<br />
Equipment 14,633,559 733,216 (474,116) 14,892,659<br />
Buildings and improvements 1,037,868,376 146,302,751 (2,897,407) 1,181,273,720<br />
___________________ ___________________ ___________________ ___________________<br />
1,298,306,627 307,371,343 (152,457,185) 1,453,220,785<br />
Less accumulated depreciation (404,734,215)<br />
___________________<br />
(55,268,382)<br />
___________________<br />
8,352,484<br />
___________________<br />
(451,650,113)<br />
___________________<br />
Total capital assets—net $893,572,412 $252,102,961 $(144,104,701) $1,001,570,672<br />
___________________ ___________________ ___________________ ___________________<br />
___________________ ___________________ ___________________ ___________________<br />
37
Balance Additions Deletions Balance<br />
October 1, and and September 30,<br />
2002 Reclasses Reclasses 2003<br />
___________________ ___________________ ___________________ ___________________<br />
Land $125,065,011 $ 455,349 $ 155,799 $125,676,159<br />
Construction in progress 138,977,656 156,396,099 (175,245,222) 120,128,533<br />
Equipment 14,711,972 1,775,792 (1,854,205) 14,633,559<br />
Buildings and improvements 873,767,824 176,095,766 (11,995,214) 1,037,868,376<br />
___________________ ___________________ ___________________ ___________________<br />
1,152,522,463 334,723,006 (188,938,842) 1,298,306,627<br />
Less accumulated depreciation (375,810,004)<br />
___________________<br />
(40,643,235)<br />
___________________<br />
11,719,024<br />
___________________<br />
(404,734,215)<br />
___________________<br />
Total capital assets–net $776,712,459 $294,079,771 $(177,219,818) $893,572,412<br />
___________________ ___________________ ___________________ ___________________<br />
___________________ ___________________ ___________________ ___________________<br />
Depreciation expense and amortization of capitalized interest during the years ended September 30, <strong>2004</strong> and 2003, were $55,623,082<br />
and $40,643,235, respectively. These amounts are included in Depreciation and Amortization in the accompanying Statements of<br />
Revenues, Expenses, and Changes in Net Assets.<br />
Net capitalized costs written off for assets that were disposed of during the years ended September 30, <strong>2004</strong> and 2003, were $3,406,112<br />
and $222,716, respectively. These amounts are included in Depreciation and Amortization in the accompanying Statements of Revenues,<br />
Expenses, and Changes in Net Assets.<br />
8. NOTES PAYABLE AND DEBT<br />
Revenue Bonds All revenue bonds issued by the Authority are parity bonds and have been issued under the terms of the Trust<br />
Agreement and supplements thereto. The bonds are payable solely from revenues, as defined in the Trust Agreement, after the payment<br />
of the cost of operation and maintenance expenses.<br />
During the years ended September 30, <strong>2004</strong> and 2003, the Authority redeemed serial revenue bonds in the amounts of $19,395,000<br />
and $18,440,000, respectively. Total interest cost incurred on outstanding bonds during the years ended September 30, <strong>2004</strong> and 2003,<br />
was $32,818,000 and 29,935,200, respectively. Of these interest amounts, $9,002,362 and $5,066,443 were capitalized, respectively.<br />
Amortization of bond issue costs was $885,897 and $673,204 in fiscal years <strong>2004</strong> and 2003, respectively.<br />
On February 19, 2003, the Authority issued the <strong>Tampa</strong> <strong>International</strong> <strong>Airport</strong> Revenue Bonds 2003 Series A and B, in the amounts of<br />
$195,290,000 and $43,735,000, respectively. The Series A Bonds were issued with a premium of $13,177,466, at rates of 5.00% to<br />
5.50% and maturities from 2007 to 2018. The Series B Bonds were issued with a premium of $335,617, at rates of 4.25% to 5.25% and<br />
maturities from 2012 to 2020. The proceeds of the 2003 Series A and B Bonds are being be used to pay a portion of the 2003 Project<br />
costs, which include the Airside C development program, the exterior dynamic sign package, the outbound baggage system and security<br />
enhancements, the service building expansion and the refunding of $50,000,000 of commercial paper notes.<br />
On July 8, 2003, the Authority issued $151,405,000 of <strong>Tampa</strong> <strong>International</strong> <strong>Airport</strong> Revenue Refunding Bonds, 2003 Series C and D. The<br />
Series C Bonds were issued at a par amount of $94,375,000 with a premium of $10,164,074 and interest rates from 2.00% to 5.25%, to<br />
currently refund the 1993 Series B Bonds maturing on or after October 1, <strong>2004</strong>, outstanding in the principal amount of $100,675,000.<br />
Debt service payments through June 2003 of $1,383,574, a reduction in the debt service reserve funds of $969,654, less issuance costs<br />
and insurance premium of $1,695,621, and the issue proceeds were used to purchase U.S. Government securities that were placed in an<br />
irrevocable trust to pay all interest, principal and call premium on the 1993 Series B bonds maturing on or after October 1, <strong>2004</strong> until<br />
their call date of October 1, 2003. The final maturity of the refunding bonds was the same as the refunded bonds, and the refunding<br />
resulted in a decrease in debt service over 17 years of $15,863,957 with a calculated net present value savings of $10,828,882, discounted<br />
at an effective interest rate of 3.74%.<br />
The 2003 Series D Bonds were issued at a par amount of $57,030,000 and a premium of $4,958,499, with interest rates from 3.00% to<br />
5.50%, to currently refund the 1993 Series D Bonds maturing on or after October 1, <strong>2004</strong>, outstanding in the principal amount of<br />
$59,340,000. Debt service payments through June 2003 of $788,795, a reduction in the debt service reserve funds of $261,778, less<br />
issuance costs and insurance premium of $1,087,191, and the issue proceeds were used to purchase U.S. Government securities which<br />
38<br />
were placed in an irrevocable trust to pay all interest, principal and call premium on the 1993 Series D bonds maturing on or after<br />
October 1, <strong>2004</strong> until their call date of October 1, 2003. The final maturity of the refunding bonds was the same as the refunded bonds,<br />
and the refunding resulted in a decrease in debt service over 21 years of $5,349,693 with a calculated net present value savings of<br />
$3,467,243, discounted at an effective interest rate of 3.74%.<br />
The total principal maturities and debt service requirements for all revenue bonds through the year 2023, as of September 30, <strong>2004</strong>, are<br />
as follows:<br />
Total<br />
Principal Interest Debt Service<br />
___________________ ___________________ ___________________<br />
2005 $ 20,165,000 $ 32,047,488 $ 52,212,488<br />
2006 21,065,000 31,148,943 52,213,943<br />
2007 34,200,000 30,143,098 64,343,098<br />
2008 35,885,000 28,461,584 64,346,584<br />
2009 37,700,000 26,637,221 64,337,221<br />
2010 to 2023 464,095,000 153,847,234 617,942,234<br />
___________________ ___________________ ___________________<br />
$613,110,000 $302,285,568 $915,395,568<br />
___________________ ___________________ ___________________<br />
___________________ ___________________ ___________________<br />
Revenue bond information and activity as of and for the years ended September 30, <strong>2004</strong> and 2003, is presented below. All principal<br />
payments are due October 1, while interest is due semi-annually on April 1 and October 1. Since all debt service payments required<br />
under the Trust Agreement are deposited with the Trustee as of September 1, <strong>2004</strong> and 2003, it is the Authority’s policy to record the<br />
October 1 principal and interest payments as of the close of business on September 30.<br />
<strong>2004</strong> 2003<br />
Amounts Due Amounts Due<br />
Balance Within One Balance Within One<br />
Outstanding<br />
___________________<br />
Year<br />
___________________<br />
Outstanding<br />
___________________<br />
Year<br />
___________________<br />
Revenue and Revenue Refunding Bonds:<br />
1996A Series, 5.0% to 6.0% $ 23,490,000 $ 715,000 $ 24,170,000 $ 680,000<br />
1996B Series, 4.9% to 6.0% 51,060,000 1,565,000 52,550,000 1,490,000<br />
1997A Series, 5.0% to 5.75% 51,880,000 5,515,000 57,120,000 5,240,000<br />
1997B Series, 5.125% 26,900,000 – 26,900,000 –<br />
1999A Series, 4.0% to 5.25% 17,610,000 2,180,000 19,695,000 2,085,000<br />
2001A Series, 4.0% to 5.5% 57,690,000 4,105,000 61,640,000 3,950,000<br />
2003A Series, 5.0% to 5.5% 195,290,000 – 195,290,000 –<br />
2003B Series, 4.25% to 5.25% 43,735,000 – 43,735,000 –<br />
2003C Series, 2.0% to 5.25% 90,170,000 4,290,000 94,375,000 4,205,000<br />
2003D Series, 3.0% to 5.5% 55,285,000 1,795,000 57,030,000 1,745,000<br />
___________________ ___________________ ___________________ ___________________<br />
613,110,000 $20,165,000 632,505,000 $19,395,000<br />
___________________ ___________________<br />
___________________ ___________________<br />
Unamortized deferred loss on bond refunding (11,245,784) (12,890,126)<br />
Unamortized bond premium—net 26,017,401 29,388,585<br />
___________________ ___________________<br />
Total revenue bonds payable $627,881,617 $649,003,459<br />
___________________ ___________________<br />
___________________ ___________________<br />
39
Balance Balance<br />
September 30, September 30,<br />
2003 Additions Refunding Paydowns <strong>2004</strong><br />
________________ ________________ ________________ ________________ ________________<br />
1996A Revenue Bonds $ 24,170,000 $ – $ – $ (680,000) $ 23,490,000<br />
1996B Revenue Bonds 52,550,000 – – (1,490,000) 51,060,000<br />
1997A Revenue Bonds 57,120,000 – – (5,240,000) 51,880,000<br />
1997B Revenue Bonds 26,900,000 – – – 26,900,000<br />
1999A Revenue Bonds 19,695,000 – – (2,085,000) 17,610,000<br />
2001A Revenue Refunding Bonds 61,640,000 – – (3,950,000) 57,690,000<br />
2003A Revenue Bonds 195,290,000 – – – 195,290,000<br />
2003B Revenue Bonds 43,735,000 – – – 43,735,000<br />
2003C Revenue Refunding Bonds 94,375,000 – – (4,205,000) 90,170,000<br />
2003D Revenue Refunding Bonds 57,030,000 – – (1,745,000) 55,285,000<br />
________________ ________________ ________________ ________________ ________________<br />
$632,505,000 $ – $ – $(19,395,000) $613,110,000<br />
________________ ________________ ________________ ________________ ________________<br />
________________ ________________ ________________ ________________ ________________<br />
Balance Balance<br />
September 30, September 30,<br />
2003 Additions Refunding Paydowns <strong>2004</strong><br />
________________ ________________ ________________ ________________ ________________<br />
1993B Refunding Bonds $104,600,000 $ – $(100,675,000) $ (3,925,000) $ –<br />
1993D Revenue Bonds 61,015,000 – (59,340,000) (1,675,000) –<br />
1996A Revenue Bonds 24,815,000 – – (645,000) 24,170,000<br />
1996B Revenue Bonds 53,970,000 – – (1,420,000) 52,550,000<br />
1997A Revenue Bonds 62,100,000 – – (4,980,000) 57,120,000<br />
1997B Revenue Bonds 26,900,000 – – – 26,900,000<br />
1999A Revenue Bonds 21,700,000 – – (2,005,000) 19,695,000<br />
2001A Revenue Refunding Bonds 65,430,000 – – (3,790,000) 61,640,000<br />
2003A Revenue Bonds – 195,290,000 – – 195,290,000<br />
2003B Revenue Bonds – 43,735,000 – – 43,735,000<br />
2003C Revenue Refunding Bonds – 94,375,000 – – 94,375,000<br />
2003D Revenue Refunding Bonds – 57,030,000 – – 57,030,000<br />
________________ ________________ ________________ ________________ ________________<br />
$420,530,000 $390,430,000 $(160,015,000) $(18,440,000) $632,505,000<br />
________________ ________________ ________________ ________________ ________________<br />
________________ ________________ ________________ ________________ ________________<br />
Tax Exempt Subordinated Commercial Paper Notes (“Commercial Paper Notes”) On September 21, 2001, the Authority entered<br />
into a Reimbursement Agreement with Landesbank Baden-Württemberg, acting through its New York Branch (the “Bank”). Under this<br />
agreement, the Authority is allowed to issue an aggregate principal amount, not-to-exceed $105,000,000 outstanding at any one time, of<br />
Commercial Paper Notes collateralized by the Bank’s credit. The Commercial Paper Notes may be renewed until 2006 in up to 180-day<br />
increments and are subordinated to the Authority’s general revenue bonds.<br />
At September 30, <strong>2004</strong>, there was $64,276,000 of Commercial Paper Notes outstanding with interest rates from 1.17% to 1.43%. At<br />
September 30, 2003, there was $69,276,000 of Commercial Paper Notes outstanding with interest rates from .85% to 1.00%. Total interest<br />
costs incurred on outstanding Commercial Paper Notes during the years ended September 30, <strong>2004</strong> and 2003, were $1,169,721 and<br />
$1,505,553, respectively. Amortization of Commercial Paper Notes issue costs in fiscal years <strong>2004</strong> and 2003, were $80,982 and $78,594,<br />
respectively.<br />
On February 19, 2003, the Authority refunded $50,000,000 of the outstanding Commercial Paper Notes with proceeds from the 2003<br />
Series A and B <strong>Tampa</strong> <strong>International</strong> <strong>Airport</strong> Revenue Bonds. On March 10, 2003, the Authority issued additional Series B Commercial<br />
40<br />
Paper Notes in the amount of $14,276,000 with an interest rate of 1.05% to fund the repayment of the note payable to the State of<br />
Florida (see Payable to the State of Florida).<br />
Payable to the State of Florida At September 30, 2002, the Authority had an unsecured note, with no state interest rate, payable to<br />
the State of Florida in connection with Joint Participation Agreements for the Drew Park Land Acquisition Program and the Runway 9-27<br />
Clear Zone Land Acquisition in the amount of $14,257,667. On March 10, 2003 the Authority repaid the note in full with proceeds from<br />
the issuance of Commercial Paper Notes.<br />
Special Purpose Revenue Bonds Under provisions of the Trust Agreement, Special Purpose Revenue Bonds may be issued by the<br />
Authority for the purpose of construction and acquisition of special purpose facilities. Special Purpose Revenue Bonds are not an obligation<br />
of the Authority, and are issued on the credit of the facility user. Special Purpose Revenue Bonds were issued in prior years by Delta<br />
Airlines and US Airways for the construction of aircraft maintenance facilities and by the fixed base operator of the general aviation facility<br />
at the <strong>Airport</strong> for the construction of an aircraft hangar, maintenance and storage facility. On January 16, 2003, US Airways rejected the<br />
ground lease portion of the maintenance facility they occupied and subsequently vacated the facility. Under the terms of the documents<br />
associated with the agreement, the Authority must use its best efforts for a two-year period to re-let the facility. Semi-annual interest payments<br />
due on the bonds (principal outstanding in the amount of $27,620,000) since January 15, 2003 have not been made by US<br />
Airways and the bonds are in default. At September 30, <strong>2004</strong> and 2003, a total of $55,944,039 of Special Purpose Revenue Bonds is outstanding.<br />
The Special Purpose Revenue Bonds have been excluded from the accompanying financial statements.<br />
9. CONTRIBUTIONS<br />
The Authority has received capital contributions by means of federal and state grants and Passenger Facility Charges as follows:<br />
<strong>2004</strong> 2003<br />
___________________ _ _ _ _ _ _ _ _ _ _ _ _ _ _<br />
Passenger facility charges $34,765,028 $31,182,018<br />
Federal 7,801,042 14,217,389<br />
State 12,014,963 12,153,430<br />
___________________ _ _ _ _ _ _ _ _ _ _ _ _ _ _<br />
Total contributions for capital projects $54,581,033 $57,552,837<br />
___________________ _ _ _ _ _ _ _ _ _ _ _ _ _ _<br />
___________________ _ _ _ _ _ _ _ _ _ _ _ _ _ _<br />
10. COMMITMENTS<br />
Construction and Maintenance Contracts In connection with the Authority’s ongoing capital and maintenance programs, certain construction<br />
and long-term maintenance contracts have been executed for services which are incomplete. These contracts are typically cancelable<br />
by either party with a 30 days’ advance notice.<br />
Defined Benefit Pension Plan All Authority full-time employees are required to participate in the Florida Retirement System (the “FRS”), a<br />
multiple-employer cost-sharing retirement system administered by the Division of Retirement, Department of Management Services of the<br />
State of Florida. The FRS is a defined benefit pension plan, qualified under Section 401 (a) of the Internal Revenue Code. Benefits and<br />
contributions are established by Chapter 121, Florida Statutes, and may only be amended by an act of the Florida Legislature.<br />
The FRS Annual <strong>Report</strong> provides financial statements and required supplementary information for the FRS. The report is compiled by and is<br />
available from the State of Florida, Division of Retirement, 2639-C North Monroe Street, Tallahassee, Florida 32399-1560.<br />
FRS provides retirement, disability and death benefits and an annual cost-of-living adjustment to plan members. Regular participants who<br />
retire at or after age 62, with ten years of service (or six years of service on or after July 1, 2002) or after thirty years of service, regardless<br />
of age, are entitled to a retirement benefit, payable monthly for life, equal to their years of service times a percentage value (ranging from<br />
1.6% to 1.68%) multiplied by their average final compensation. Special risk participants who retire after age 55, with ten years of service<br />
(or six years of services on or after July 1, 2002), or after twenty-five years of service, regardless of age, receive a similar benefit (ranging<br />
from 2.00% to 3.00%). Senior Management Service Class (“SMSC”) participants, who retire at or after age 62, with seven years of SMSC<br />
service; or with ten years of service (or six years of services on or after July 1, 2002) and age 62; or with thirty years of service regardless<br />
of age, receive a similar benefit (2.0%) multiplied by their average final compensation. Alternatively, SMSC participants may elect to<br />
41
participate in a local annuity plan. Average final compensation is the employee’s average salary over their highest five fiscal years’ earnings.<br />
Vested employees may retire after vesting, but before normal retirement, and receive reduced retirement benefits.<br />
FRS members are required to contribute monthly amounts on behalf of their employees at actuarially determined rates expressed as percentages<br />
of covered payroll. For FRS fiscal years <strong>2004</strong> and 2003, which ended on June 30th, the contribution percentage of payroll was<br />
7.39% for regular participants, 18.53% for special risk participants, and 9.11% for DROP participants. Total contributions for FRS fiscal years<br />
<strong>2004</strong> and 2003 were $1,950,839 and $1,495,049, which equaled 8.61%, and 7.07% of payroll, respectively. The Authority’s contributions<br />
represented less than one percent of total contributions required of all participating members. The total contributions for fiscal years <strong>2004</strong><br />
and 2003 were 100% of the required amount.<br />
Effective July 1, 1998, the Florida Legislature established a Deferred Retirement Option Program (“DROP”). This program allows eligible<br />
employees to defer receipt of monthly retirement benefit payments while continuing employment with a Florida Retirement System employer<br />
for a period not to exceed sixty months after electing to participate. Deferred monthly benefits are held in the Florida Retirement System<br />
Trust Fund and accrue interest.<br />
Defined Contribution Plan Beginning December 1, 2002, the FRS offered a second retirement plan option, the FRS Investment Plan.<br />
Under this plan the employer pays all contributions, which are a percentage of salary based on the FRS Membership Class. The employer<br />
contributes to an account in the employee’s name. The employee makes investment elections within the investment funds chosen by the<br />
State Board of Administration. The retirement benefit is based on the account balance, and the benefit is vested after one year of service.<br />
If an employee leaves the job, he or she can keep the benefit in the FRS, or transfer his or her account to another retirement plan. The<br />
employee can also elect to cash out the benefit when leaving, but the distribution is subject to tax penalties for taking early withdrawal.<br />
The employee in this plan is not eligible for DROP. All employees in the FRS pension plan were given a choice of switching from the FRS<br />
pension plan to the FRS Investment Plan within a designated time period.<br />
Compensated Absences The Authority provides for compensated absences to its employees through employee benefit programs. Under<br />
the programs, employees are provided compensated absences for sick and vacation time, as well as related retirement amounts. Amounts<br />
owed under the programs were $2,875,177 and $2,624,773 at September 30, <strong>2004</strong> and 2003, respectively. These amounts are<br />
recorded as accrued expenses in the Statements of Net Assets.<br />
11. CONTINGENCIES<br />
The Authority is involved in litigation and claims as defendant or plaintiff arising in the ordinary course of operations. In the opinion of<br />
management, the range of potential recoveries or liabilities will not materially affect the financial position of the Authority.<br />
42<br />
George J. Bean<br />
October 4, 1924 – June 8, <strong>2004</strong><br />
With great sadness we saw the passing of George J. Bean,<br />
executive director of <strong>Tampa</strong> <strong>International</strong> <strong>Airport</strong> from<br />
1965 through July 1996.<br />
The <strong>Tampa</strong> Bay community is forever grateful for the<br />
significant professional and personal contributions<br />
Mr. Bean made not only to <strong>Tampa</strong>, but to the<br />
worldwide progress of civil air transportation.<br />
Thanks to his leadership, intelligence and<br />
guidance, the Aviation Authority underwent<br />
tremendous change during his tenure as<br />
CEO of <strong>Tampa</strong> <strong>International</strong> <strong>Airport</strong>.<br />
We will all continue to hold him in the<br />
greatest affection and respect.<br />
In Memory
Passenger<br />
Airlines<br />
Air Canada<br />
AirTran Airways<br />
AirTran JetConnect<br />
America West<br />
American<br />
British Airways<br />
Cayman Airways<br />
Continental<br />
Continental Express<br />
Delta<br />
Delta Connection/ASA<br />
Delta Connection/Chautauqua<br />
Delta Connection/Comair<br />
Frontier<br />
Independence Air<br />
JetBlue<br />
L.B. Limited<br />
Midwest<br />
Northwest<br />
Southwest<br />
Song<br />
Spirit<br />
Sun Country<br />
Ted<br />
United<br />
USA 3000<br />
US Airways<br />
WestJet<br />
Regionals/<br />
Commuters<br />
American Eagle<br />
Cape Air<br />
Gulfstream <strong>International</strong><br />
US Airways Express/Air Midwest<br />
All-Cargo<br />
Airlines<br />
ABX, Inc. Airborne Express<br />
ASTAR Air Cargo, Inc.<br />
Bankair, Inc.<br />
Federal Express Corporation<br />
Flight Express, Inc.<br />
U.S. Check<br />
Design – The HLA Group<br />
Photography – David Lawrence<br />
Publisher – Brenda S. Geoghagan<br />
P.O. Box 22287 ■ <strong>Tampa</strong>, Florida 33622 USA<br />
813-870-8700 ■ fax 813-875-6670<br />
www.<strong>Tampa</strong><strong>Airport</strong>.com<br />
Hillsborough County Aviation Authority<br />
Peter O. Knight <strong>Airport</strong> ■ Plant City <strong>Airport</strong> ■ Vandenberg <strong>Airport</strong>