PDF, 538 KB - Munich Re
PDF, 538 KB - Munich Re
PDF, 538 KB - Munich Re
Create successful ePaper yourself
Turn your PDF publications into a flip-book with our unique Google optimized e-Paper software.
RELIABLE CONTINUITY<br />
IN TIMES OF UNCERTAINTY<br />
BALANCE SHEET PRESS CONFERENCE 2012<br />
13 March 2012
Agenda<br />
<strong>Munich</strong> <strong>Re</strong><br />
<strong>Re</strong>liable continuity in times of uncertainty Nikolaus von Bomhard 2<br />
Financial highlights 2011 Jörg Schneider 8<br />
Primary insurance Torsten Oletzky 18<br />
<strong>Re</strong>insurance Torsten Jeworrek 29<br />
Summary and Outlook Nikolaus von Bomhard 41<br />
In 2011 <strong>Munich</strong> <strong>Re</strong> coped well with historically high<br />
nat cat claims and severe capital market disruption<br />
Balance sheet press conference 2012<br />
10-year German Bund yield 1 Credit spreads 1,2 EURO STOXX 50 1<br />
–113 bps +145 bps<br />
–17%<br />
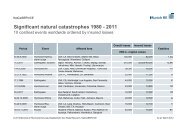
Natural catastrophes 3 – Economic losses of US$ 380bn, thereof US$ 105bn insured<br />
Severe weather, tornados<br />
USA, 20–27 May / 22–28 April<br />
Wildfires<br />
Canada, 14–22 May<br />
Floods<br />
USA, April–May<br />
Hurricane Irene<br />
USA, Caribbean 22 Aug.–2 Sep.<br />
Major loss events Geophysical events Hydrological events Climatological events Meteorological events<br />
1 Change between 31.12.2010 and 31.12.2011. 2 IBOXX EURO Corporate vs. BofAML German Government 7–10 years.<br />
3 Source: Geo Risks <strong>Re</strong>search, NatCatSERVICE.<br />
Earthquake, tsunami<br />
Japan, 11 March<br />
Floods<br />
Thailand, Aug.–Nov.<br />
Floods, flash floods<br />
Australia, Dec. 2010–Jan. 2011<br />
Earthquakes<br />
New Zealand, 22 Feb. / 13 June<br />
In a year of extremes, <strong>Munich</strong> <strong>Re</strong> achieved an annual result of €712m and<br />
maintained a stable dividend of €6.25 per share<br />
Balance sheet press conference 2012<br />
2<br />
3
<strong>Munich</strong> <strong>Re</strong>'s long-term shareholder return remains<br />
attractive<br />
Years of volatile macroeconomic environment<br />
2007<br />
Subprime crisis<br />
Impact<br />
2008<br />
Credit crisis<br />
Austerity measures and quantitative easing<br />
leading to ongoing low interest rates while<br />
macroeconomic uncertainty remains<br />
Earnings pressure<br />
Gradual reduction of<br />
investment income<br />
Higher volatility<br />
<strong>Re</strong>turns becoming<br />
less predictable<br />
<strong>Munich</strong> <strong>Re</strong> focusing on liability side as main<br />
source of value creation<br />
2009<br />
Global recession<br />
1 Annualised total shareholder return defined as price performance plus dividend yield over the period from<br />
1.1.2005 until 29.2.2012; based on Datastream total return indices in local currency; volatility calculation with<br />
250 trading days per year. Peers: Allianz, Axa, Generali, Hannover <strong>Re</strong>, Swiss <strong>Re</strong>, Zurich Financial Services.<br />
2010/2011<br />
Sovereign crisis<br />
Risk/return profile 1<br />
Total shareholder return (p.a.)<br />
Peer 1<br />
Peer 2<br />
Peer 4<br />
<strong>Munich</strong> <strong>Re</strong><br />
Ongoing<br />
uncertainty<br />
Peer 3<br />
Peer 6<br />
Peer 5<br />
–10<br />
20 30 40 50<br />
Volatility of total shareholder return (p.a.)<br />
Stringent risk management and high level of portfolio diversification – in core<br />
insurance business and investments<br />
Capital strength facilitates reliable shareholder<br />
participation<br />
Sustainable book value …<br />
88.0<br />
BV/share (plus dividend/share buy-back)<br />
BV/share<br />
CAGR: 8.5%<br />
CAGR: 5.7%<br />
155.4<br />
129.9<br />
2005 2011<br />
1 Dividend divided by year-end share price.<br />
2 1969 was the only year since 1952 with a decreased dividend per share.<br />
10<br />
5<br />
0<br />
–5<br />
Balance sheet press conference 2012<br />
€ … and dividend growth<br />
€<br />
CAGR: 12.4%<br />
Sustainable dividend growth for decades 2 – Providing attractive dividend yield even<br />
in challenging times<br />
3.10<br />
2.7<br />
3.5<br />
4.1<br />
5.0<br />
5.3<br />
5.5<br />
6.25<br />
6.6<br />
2005 2011<br />
Dividend yield1 (%)<br />
Balance sheet press conference 2012<br />
%<br />
4<br />
5
Business portfolio of complementary profiles<br />
performing in any market environment<br />
Sensitivity to macroeconomic changes<br />
Lower Higher<br />
ILLUSTRATIVE<br />
Primary non-life<br />
Quite robust to macroeconomic<br />
changes<br />
delivering stable earnings<br />
<strong>Re</strong>insurance non-life<br />
Nat cat and some other<br />
businesses hardly<br />
correlated with<br />
macroeconomic cycle<br />
Primary life<br />
In particular, products with<br />
investment component<br />
dependent on interest rate<br />
development<br />
Primary health<br />
Yearly price adjustments to<br />
reflect medical inflation<br />
in addition to high client<br />
retention<br />
<strong>Munich</strong> <strong>Re</strong><br />
ERGO International<br />
Cautious business expansion<br />
in CEE and Asia in a<br />
macroeconomic-sensitive<br />
environment<br />
<strong>Munich</strong> Health<br />
Managing political risks and<br />
portfolio consolidation while<br />
long-term growth<br />
opportunities persist<br />
<strong>Re</strong>insurance life<br />
Potentially more client<br />
demand for capital relief in<br />
addition to further business<br />
expansion in Asia<br />
Capital generation Business development<br />
Balancing long-term growth opportunities and capital generation – <strong>Re</strong>latively low<br />
gearing to economic cycle<br />
<strong>Munich</strong> <strong>Re</strong> geared to sustainable value generation<br />
Good track record of dealing with challenging economic conditions<br />
Balance sheet press conference 2012<br />
We remain a strong partner for clients and reliable for shareholders in times of uncertainty<br />
Integrated business model safeguarding sustainable value generation<br />
Focus on insurance risks – Limited correlation to economic cycles and capital markets<br />
Rigorous approach to risk management – High level of investment diversification<br />
Able to cope with all kinds of scenarios – Actively managing the low-yield environment<br />
Strong capital position providing flexibility<br />
Facilitating dividend continuity and allowing us to seize opportunities for profitable growth<br />
Balance sheet press conference 2012<br />
6<br />
7
Agenda<br />
<strong>Re</strong>liable continuity in times of uncertainty Nikolaus von Bomhard<br />
Financial highlights 2011 Jörg Schneider<br />
Primary insurance Torsten Oletzky<br />
<strong>Re</strong>insurance Torsten Jeworrek<br />
Summary and Outlook Nikolaus von Bomhard<br />
Overview – Financial highlights 2011<br />
Sound underlying performance in turbulent times<br />
<strong>Munich</strong> <strong>Re</strong> (Group)<br />
NET PROFIT<br />
€712m (€632m in Q4)<br />
Impact from nat cat claims and<br />
capital market disruption<br />
mitigated by sound underlying<br />
performance – Positive tax<br />
contribution<br />
<strong>Re</strong>insurance Primary insurance <strong>Munich</strong> Health<br />
COMBINED RATIO<br />
113.6% (101.8% in Q4)<br />
Exceptionally high nat cat ratio<br />
of 28.8%; 4.0%-points of prioryear<br />
reserve releases –<br />
Favourable development in life<br />
SHAREHOLDERS' EQUITY<br />
€23.3bn (+4.9% vs. Q3)<br />
1 Subject to approval of AGM.<br />
2 Adjusted for impact on insurance risk transfer to the capital markets: RoI 3.3%.<br />
Strong capital position allows<br />
us to maintain a stable<br />
dividend of €6.25 per share 1<br />
and to seize profitable growth<br />
opportunities<br />
CONSOLIDATED ERGO RESULT<br />
€349m (€89m in Q4)<br />
<strong>Re</strong>sult impacted by several<br />
countervailing non-recurring<br />
items – Achievement of a<br />
consolidated result at prioryear's<br />
level<br />
<strong>Munich</strong> <strong>Re</strong><br />
Balance sheet press conference 2012<br />
INVESTMENT RESULT<br />
RoI of 3.4% 2 (3.8% in Q4)<br />
Portfolio diversification and<br />
active duration management<br />
proves beneficial – Disposal<br />
gains partially offsetting high<br />
write-downs<br />
COMBINED RATIO<br />
99.4% (100.4% in Q4)<br />
Substantial premium growth<br />
due to large-volume deals –<br />
Improved operating result<br />
while net result distorted by<br />
negative currency effects<br />
Balance sheet press conference 2012<br />
8<br />
9
<strong>Munich</strong> <strong>Re</strong> (Group) – Key figures<br />
High nat cat claims and volatile capital markets<br />
putting pressure on results<br />
Net result<br />
485<br />
709 761<br />
Q1 Q2 Q3 Q4 Q1 Q2 Q3 Q4<br />
Technical result<br />
1,965<br />
475<br />
2010 2011<br />
286<br />
2010 2011<br />
Severe large nat cat claims<br />
–948<br />
738<br />
€m Investment result<br />
€m Other2 Capital market turmoil leaving<br />
its mark<br />
1 Segments do not add up to total amount; difference relates to consolidation and the segment "asset management".<br />
2 Other non-operating result, goodwill impairments, finance costs, taxes.<br />
290<br />
8,642<br />
<strong>Munich</strong> <strong>Re</strong> (Group) – Capitalisation<br />
Capital position remains solid –<br />
Increase of IFRS equity in Q4<br />
632<br />
2011<br />
<strong>Munich</strong> <strong>Re</strong><br />
Balance sheet press conference 2012<br />
2010<br />
Total 1 712 2,430<br />
<strong>Re</strong>insurance 774 2,099<br />
Primary insurance 762 656<br />
<strong>Munich</strong> Health 45 63<br />
6,756<br />
2010 2011<br />
€m 2011 Change Q4<br />
Equity 31.12.2010 23,028<br />
Consolidated result 712 632<br />
Changes<br />
Dividend –1,110 –<br />
Unrealised gains/losses 750 164<br />
Exchange rates 390 459<br />
Share buy-backs –323 –<br />
Other –138 –161<br />
Equity 31.12.2011 23,309 1,094<br />
Capitalisation<br />
0.5<br />
4.9<br />
17.7%<br />
0.5 0.5 0.6 0.5<br />
5.0 4.8 4.8 4.7<br />
20.8%<br />
19.2% 19.0% 18.3%<br />
25.3 21.1 22.3 23.0 23.3<br />
2007 2008 2009 2010 2011<br />
1 Other debt includes bank borrowings of <strong>Munich</strong> <strong>Re</strong> and other strategic debt.<br />
2 Strategic debt (senior, subordinated and other debt) divided by total capital (= sum of strategic debt + shareholders' equity).<br />
–1,548<br />
–468<br />
2010 2011<br />
€m<br />
€m<br />
Tax revenue overcompensating<br />
burden from weaker euro<br />
2011: UNREALISED GAINS/LOSSES<br />
Afs fixed-interest securities:<br />
+€1,572m<br />
Afs non-fixed-interest<br />
securities: –€805m<br />
2011: EXCHANGE RATES<br />
Positive FX development<br />
mainly driven by US$<br />
1<br />
Senior and other debt<br />
Subordinated debt<br />
Group equity<br />
Debt leverage 2 (%)<br />
Balance sheet press conference 2012<br />
€bn<br />
10<br />
11
<strong>Munich</strong> <strong>Re</strong> (Group) – Investment portfolio<br />
Active asset management on the basis of a<br />
well-diversified investment portfolio<br />
Investment portfolio 1<br />
Land and buildings<br />
2.6 (2.9)<br />
Shares, equity funds and<br />
participating interests 2<br />
3.2 (4.0)<br />
Miscellaneous 3<br />
10.5 (9.7)<br />
Loans<br />
27.5 (25.7)<br />
Shift from weaker to<br />
high-quality government<br />
bonds, esp. Germany<br />
and western Europe<br />
TOTAL<br />
€207bn<br />
1 Fair values as at 31.12.2011 (31.12.2010). 2 Net of hedges: 2.0% (4.4%).<br />
3 Deposits retained on assumed reinsurance, unit-linked investments, deposits with banks, investment funds (excl. equities),<br />
derivatives and investments in renewable energies. Economic view – not fully comparable with IFRS figures.<br />
%<br />
Fixed-interest<br />
securities<br />
56.2 (57.7)<br />
Stronger focus<br />
on emerging<br />
market debt<br />
Fixed-income portfolio 1<br />
Loans to policyholders/<br />
Mortgage loans<br />
3 (3)<br />
Structured products<br />
3 (4)<br />
Corporates<br />
10 (9)<br />
Banks<br />
8 (9)<br />
Thereof<br />
40% cash<br />
Significant<br />
reduction of<br />
bank bonds<br />
Pfandbriefe/<br />
Covered bonds<br />
28 (28)<br />
<strong>Munich</strong> <strong>Re</strong> (Group) – Investment result<br />
Stable regular income despite low yields –<br />
Write-down of Greek government bonds<br />
Investment result<br />
TOTAL<br />
€178bn<br />
Further cautious<br />
increase of<br />
corporate bonds<br />
<strong>Munich</strong> <strong>Re</strong><br />
Balance sheet press conference 2012<br />
%<br />
Government/<br />
Semi-government<br />
48 (47)<br />
Thereof 7%<br />
inflation-linked bonds<br />
<strong>Re</strong>duction of<br />
equity exposure<br />
to 2.0% after<br />
hedges<br />
<strong>Re</strong>gular income Write-ups/write-downs €m Disposal gains/losses €m<br />
Higher dividend<br />
income<br />
Increase in deposits<br />
retained on assumed<br />
reinsurance (due to<br />
large-volume deals)<br />
Average reinvestment<br />
yield ~3.0% in second<br />
half of 2011<br />
1 <strong>Re</strong>turn on quarterly weighted investments (market values) in % p.a.<br />
2 Negative impact from unit-linked business included.<br />
2011 <strong>Re</strong>turn 1 2010 <strong>Re</strong>turn 1<br />
<strong>Re</strong>gular income 8,039 4.0% 7,749 4.0%<br />
Write-ups/<br />
write-downs<br />
–1,625 –0.8% –403 –0.2%<br />
Disposal gains/losses 1,244 0.6% 1,649 0.9%<br />
Other income/expenses –902 –0.4% 2 –353 –0.2%<br />
Investment result 6,756 3.4% 8,642 4.5%<br />
Major effects<br />
2011<br />
Q4<br />
2011<br />
Greek bonds –1,178 –245<br />
Equities –542 –85<br />
Swaptions 368 93<br />
Insurance risk transfer<br />
to the capital markets<br />
211 –<br />
€m Q4 2011<br />
€m<br />
Major effects<br />
<strong>Re</strong>al estate<br />
Singapore<br />
Q4 2011 <strong>Re</strong>turn 1<br />
1,975 3.9%<br />
15 0.0%<br />
48 0.1%<br />
–97 –0.2%<br />
1,941 3.8%<br />
2011<br />
Balance sheet press conference 2012<br />
Q4<br />
2011<br />
257 –<br />
Equities 535 74<br />
Fixed-income 748 365<br />
12<br />
13
<strong>Munich</strong> <strong>Re</strong> (Group) – Investments<br />
Alternative investments in an environment of low<br />
interest rates – <strong>Re</strong>newable energy and infrastructure<br />
<strong>Re</strong>newable energy New: Infrastructure<br />
Investment programme RENT (<strong>Re</strong>newable<br />
Energy and New Technologies) is on track;<br />
~€0.5bn invested so far; target volume<br />
continues to be €2.5bn<br />
Investment is focusing on onshore wind,<br />
photovoltaics and power grids<br />
Attractive risk-return profile; diversification<br />
advantage has positive impact<br />
<strong>Munich</strong> <strong>Re</strong><br />
Additional infrastructure investment<br />
programme with a planned volume of €1.5bn<br />
in the medium term<br />
Possible segments: transportation, utilities,<br />
communications worldwide<br />
Use of know-how from core business<br />
Advantages: long-term cash flows, inflation<br />
protection, diversification of overall portfolio<br />
Higher investments may be possible – But only if there are clear political<br />
parameters and appropriate recognition under Solvency II<br />
<strong>Munich</strong> Health – Premium development<br />
Significant premium growth<br />
Gross premiums written €m<br />
2010 5,140<br />
Foreign-exchange effects –84<br />
Divestment/Investment 325<br />
Organic change 752<br />
2011 6,133<br />
1 Gross premiums written. Unconsolidated.<br />
Segmental breakdown 1<br />
Balance sheet press conference 2012<br />
Gross premiums written €m<br />
2010 5,140<br />
<strong>Re</strong>insurance 950<br />
Primary insurance 43<br />
2011 6,133<br />
<strong>Re</strong>insurance<br />
4,165 (67.9%)<br />
(▲ 29.5%)<br />
Balance sheet press conference 2012<br />
€m<br />
Primary insurance<br />
1,968 (32.1%)<br />
(▲ 2.2%)<br />
<strong>Re</strong>insurance<br />
Ongoing organic growth due to large-volume<br />
deals<br />
Primary insurance<br />
Acquisition of Windsor Health Group<br />
Decline of US private-fee-for-services business<br />
14<br />
15
<strong>Munich</strong> Health – Key figures<br />
<strong>Munich</strong> Health<br />
Net result<br />
27<br />
41<br />
Technical result €m Investment result<br />
€m Other1 69 66<br />
2010 2011<br />
Increase in reinsurance while<br />
US primary business declining<br />
1 Other non-operating result, goodwill impairments, finance costs, taxes.<br />
6<br />
21 15<br />
–11<br />
–5<br />
Q1 Q2 Q3 Q4 Q1 Q2 Q3 Q4<br />
2010 2011<br />
142<br />
164<br />
2010 2011<br />
Improvement due to increased<br />
asset base<br />
Q1–4 Q1–4<br />
2010 2011<br />
–68<br />
Negative FX effects<br />
Key takeaways<br />
Solid financial result 2011 in a challenging environment<br />
<strong>Re</strong>silient earnings in 2011 based on prudent financial management<br />
Well-diversified investment portfolio mitigates capital market disruption<br />
Sound capital base maintained – Dividend remains well financed<br />
14<br />
63<br />
<strong>Munich</strong> <strong>Re</strong><br />
45<br />
–120<br />
2010 2011<br />
Balance sheet press conference 2012<br />
Balance sheet press conference 2012<br />
€m<br />
€m<br />
16<br />
17
Agenda<br />
<strong>Re</strong>liable continuity in times of uncertainty Nikolaus von Bomhard<br />
Financial highlights 2011 Jörg Schneider<br />
Primary insurance Torsten Oletzky<br />
<strong>Re</strong>insurance Torsten Jeworrek<br />
Summary and Outlook Nikolaus von Bomhard<br />
Primary insurance – Key figures<br />
Net result ERGO stable<br />
<strong>Munich</strong> <strong>Re</strong><br />
Balance sheet press conference 2012<br />
Net result <strong>Munich</strong> <strong>Re</strong> primary insurance €m Net result ERGO €m<br />
2011<br />
2010<br />
Total 762 656<br />
Life 113 172<br />
Health 244 165<br />
Property-casualty 405 319<br />
Net result <strong>Munich</strong> <strong>Re</strong> includes<br />
transactions between primary<br />
insurance segments<br />
Net result ERGO after<br />
consolidation of inter-segment<br />
transactions<br />
355 349<br />
2010 2011<br />
<strong>Munich</strong> <strong>Re</strong> and ERGO results<br />
influenced by positive and<br />
negative one-off effects from<br />
investments<br />
Balance sheet press conference 2012<br />
18<br />
19
Primary insurance – Key figures<br />
Investment result with many one-off effects<br />
Investment result<br />
5,575<br />
4,588<br />
2010 2011<br />
Life €m<br />
3,485<br />
2,576<br />
2010 2011<br />
Primary insurance – Premium development<br />
Overall stable premium income<br />
Gross premiums written €m<br />
2010 17,481<br />
Foreign-exchange effects –82<br />
Divestment/Investment 0<br />
Organic change 218<br />
2011 17,617<br />
1 Gross premiums written. Unconsolidated.<br />
<strong>Munich</strong> <strong>Re</strong><br />
Impairment of Greek bonds amounting to €1.13bn – Mainly in life<br />
and health segments (net effect: €207m)<br />
Life segment: Hedging instruments against low interest rates gain<br />
in value – Write-ups of €368m (net effect: €84m)<br />
Lower balance of unrealised gains/losses in unit-linked life<br />
insurance: Change of –€534m vs. 2010<br />
Internal transfer of international health insurers to <strong>Munich</strong> Health –<br />
Profit of €198m (net effect: €116m)<br />
<strong>Re</strong>al estate sale in Singapore – Profit of €257m (net effect: €156m)<br />
Health €m Property-casualty €m<br />
1,317 1,301<br />
2010 2011<br />
Segmental breakdown 1<br />
Property-casualty<br />
5,637 (32.0%)<br />
(▲ 2.5%)<br />
773 711<br />
2010 2011<br />
Balance sheet press conference 2012<br />
Balance sheet press conference 2012<br />
€m<br />
Life<br />
6,263 (35.6%)<br />
(▲ –3.4%)<br />
Health<br />
5,717 (32.5%)<br />
(▲ 4.0%)<br />
Gross premiums written €m<br />
2010 17,481<br />
Life –221<br />
Health 218<br />
Property-casualty 139<br />
2011 17,617<br />
Life: Decline of regular and single premiums,<br />
especially annuity insurance<br />
Health: Growth in health, travel and direct<br />
insurance<br />
Property-casualty: Organic growth, partially<br />
compensated by FX effects<br />
20<br />
€m<br />
21
Primary insurance – Key figures<br />
Similar growth trends in German and international<br />
business<br />
<strong>Munich</strong> <strong>Re</strong><br />
Total premiums life €m<br />
Germany International<br />
6,032 5,893<br />
4,860 4,606<br />
2010 2011<br />
thereof GWP<br />
Lower single<br />
premiums in<br />
Germany and<br />
Austria – Good<br />
growth in Belgium<br />
Premiums property-casualty €m<br />
Germany International<br />
3,173 3,250<br />
2010 2011<br />
Primary insurance – Life – New business<br />
Total APE1 <strong>Re</strong>gular Single<br />
premiums premiums<br />
2010 2,920 511 2,409 752<br />
2011 2,741 533 2,208 754<br />
Δ –6.1% 4.3% –8.3% 0.3%<br />
2,126 2,000<br />
1,624 1,657<br />
2010 2011<br />
2,325 2,387<br />
2010 2011<br />
Comments<br />
thereof GWP<br />
Primary life – New business (statutory premiums)<br />
Total<br />
€m<br />
1 Annual premium equivalent (APE = regular premiums +10% single premiums).<br />
Moderate growth<br />
in Germany and<br />
international –<br />
Negative FX<br />
effects<br />
Balance sheet press conference 2012<br />
Germany<br />
Growth in regular premiums<br />
Single-premium business down – for whole market<br />
Good growth in corporate pension business<br />
International<br />
Growth in Belgium (APE 21.4%) and<br />
Poland (APE 6.7%)<br />
Austria (APE –23.0%): Lower premiums due to<br />
change in tax legislation<br />
Germany €m International<br />
€m<br />
Total APE1 <strong>Re</strong>gular Single<br />
premiums premiums<br />
2010 1,940 331 1,609 492<br />
2011 1,806 351 1,455<br />
497<br />
Δ –6.9% 6.0% –9.6% 1.0%<br />
Total APE1 <strong>Re</strong>gular Single<br />
premiums premiums<br />
2010 980 180 800<br />
260<br />
2011 935 182 753<br />
257<br />
Δ –4.6% 1.1% –5.9% –1.2%<br />
Balance sheet press conference 2012<br />
22<br />
23
Primary insurance – Health<br />
Health – Extensive action programme<br />
New business total 1<br />
299<br />
139<br />
160<br />
276<br />
165<br />
111<br />
2010 2011<br />
Comprehensive<br />
Comprehensive<br />
Supplementary<br />
Growth of 18.4% spurred by abolition of<br />
3-year-waiting period as of 1 January 2011<br />
Supplementary<br />
Last year's figures positively influenced by one<br />
single large contract amounting to >€60m 2 ;<br />
adjusted for that, growth in supplementary<br />
business would have been ~13% compared to<br />
–30.6% actual<br />
1 Without travel business, which is short-term business only.<br />
2 Change in disclosure: last year, this contract was shown as comprehensive business.<br />
€m Highlights<br />
Primary insurance – Property-casualty – Combined ratio<br />
Higher combined ratio in Germany – Improving<br />
international business<br />
<strong>Munich</strong> <strong>Re</strong><br />
Clearer focus on high-quality business –<br />
Abolition of low-price tariffs in comprehensive<br />
business<br />
Start of internet-based service initiative<br />
myDKV<br />
Introduction of supplementary business<br />
calculated according to p-c criteria<br />
Successful introduction of innovative afterthe-event-product<br />
"instant dental cover" in<br />
April 2011 at ERGO Direct<br />
Claims development broadly in line with<br />
expectations – Somewhat higher claims<br />
at inception<br />
Close control of portfolio development:<br />
17,000 policies sold<br />
Balance sheet press conference 2012<br />
Combined ratio % Germany<br />
%<br />
96.3<br />
93.3<br />
93.3<br />
Q1 Q2 Q3 Q4 Q1 Q2 Q3 Q4 Q1 Q2 Q3 Q4<br />
Expense ratio<br />
Loss ratio<br />
90.3<br />
98.7<br />
94.5 93.6<br />
100.4<br />
98.2<br />
94.7<br />
93.2 96.8 97.8<br />
32.9 33.7 34.1<br />
60.3 63.1 63.7<br />
2009 2010 2011<br />
100.9<br />
97.5<br />
87.9 89.8 93.1<br />
2009 2010 2011<br />
2011 burdened by weather-related losses<br />
and higher claims in liability<br />
International<br />
102.5 107.8 105.0<br />
2009 2010 2011<br />
Still high claims and costs in motor<br />
business<br />
Balance sheet press conference 2012<br />
%<br />
24<br />
25
Primary insurance – Property-casualty<br />
German business well-diversified and profitable<br />
Gross premiums written 1 €m<br />
Other<br />
360<br />
Legal<br />
protection<br />
421<br />
Liability<br />
492<br />
Combined ratio 1<br />
76.6<br />
TOTAL<br />
€3,250m<br />
Personal accident<br />
751<br />
1 As at 31.12.2011. IFRS figures.<br />
2 Including among others homeowners and household insurance.<br />
Motor<br />
639<br />
Fire/Property 2<br />
587<br />
112.0 101.9 88.5 96.5 78.8 93.1<br />
Personal Motor Fire/ Liability Legal<br />
accident Property protect<br />
Other Total<br />
Highlights<br />
Personal accident<br />
Stable business and high profitability<br />
<strong>Munich</strong> <strong>Re</strong><br />
Motor<br />
Market-wide better rates in 2011 – But higher<br />
claims frequency due to weather-related<br />
incidents<br />
Fire/Property<br />
Growth mainly from profitable commercial/<br />
industrial business – Combined ratio of<br />
homeowners' insurance market-wide not<br />
sufficient<br />
Liability<br />
Overall excellent business<br />
Legal protection<br />
Market leading position via D.A.S.<br />
Combined ratios in Germany have been well below overall target of 95% for years<br />
Primary insurance – Property-casualty<br />
International business shows signs of recovery<br />
Gross premiums written 1 €m<br />
Other<br />
913<br />
South Korea<br />
168<br />
Combined ratio 1<br />
99.6<br />
133.7<br />
1 As at 31.12.2011. IFRS figures.<br />
TOTAL<br />
€2,387m<br />
90.3<br />
Poland Turkey Nether-<br />
lands<br />
%<br />
Poland<br />
797<br />
Turkey<br />
300<br />
Netherlands<br />
209<br />
118.3 103.7 105.0<br />
South<br />
Korea<br />
Other Total<br />
%<br />
Highlights<br />
Balance sheet press conference 2012<br />
Poland<br />
Business returns to underwriting profit<br />
Turkey<br />
Business still challenging but first signs of<br />
turnaround<br />
Netherlands<br />
Legal protection business only – Market leading<br />
position with consistently low combined ratio<br />
South Korea<br />
Motor market and own operations not<br />
satisfactory – <strong>Re</strong>view of strategic options<br />
Portugal<br />
Activities sold in 2011 – Subcritical size,<br />
P&L deconsolidation as at 30 September 2011<br />
Ambition: Combined ratio of ~100% in 2013 – Strict focus on improvement of profitability<br />
and consistent implementation of turnaround measures show positive impact<br />
Balance sheet press conference 2012<br />
26<br />
27
Primary insurance – Summary<br />
Key takeaways<br />
IFRS result satisfactory under given market conditions<br />
Economic earnings development indicates further challenges<br />
Life and health insurance – Safeguard existing portfolio<br />
and adapt new business to changing environment<br />
Property-casualty insurance – Continue international turnaround<br />
to return to overall combined ratio target level of below 95%<br />
Agenda<br />
<strong>Re</strong>liable continuity in times of uncertainty Nikolaus von Bomhard<br />
Financial highlights 2011 Jörg Schneider<br />
Primary insurance Torsten Oletzky<br />
<strong>Re</strong>insurance Torsten Jeworrek<br />
Summary and Outlook Nikolaus von Bomhard<br />
<strong>Munich</strong> <strong>Re</strong><br />
Balance sheet press conference 2012<br />
Balance sheet press conference 2012<br />
28<br />
29
<strong>Re</strong>insurance – Premium development<br />
Strong increase driven by organic growth<br />
Gross premiums written €m<br />
2010 23,602<br />
Foreign-exchange effects –499<br />
Divestment/Investment 0<br />
Organic change 3,402<br />
2011 26,505<br />
2010 23,602<br />
Life 1,701<br />
Property-casualty 1,202<br />
2011 26,505<br />
1 Gross premiums written. Unconsolidated.<br />
Segmental breakdown 1<br />
Property-casualty<br />
16,903 (63.8%)<br />
(▲ 7.7%)<br />
<strong>Munich</strong> <strong>Re</strong><br />
Life<br />
9,602 (36.2%)<br />
(▲ 21.5%)<br />
Gross premiums written €m<br />
<strong>Re</strong>insurance – Key figures<br />
<strong>Re</strong>insurance property-casualty<br />
Net result<br />
222<br />
Q1 Q2 Q3 Q4<br />
–942<br />
Q1 Q2 Q3 Q4<br />
Technical result €m Investment result<br />
€m Other1 1,223<br />
526 555 503<br />
2010 2011<br />
–841<br />
2010 2011<br />
Historical high nat cat claims;<br />
prior-year reserve releases<br />
1 Other non-operating result, goodwill impairments, finance costs, taxes.<br />
2,563<br />
487 357 469<br />
Lower result on fixed-interest<br />
securities and derivatives<br />
Life<br />
Substantial organic growth due to expansion in<br />
Asia and large-volume capital relief deals<br />
Property-casualty<br />
Good organic growth, especially in nat cat and<br />
motor business, as well as large solvency-<br />
related deals<br />
2,157<br />
2010 2011<br />
Balance sheet press conference 2012<br />
1,806<br />
Q1–4 Q1–4<br />
2010 2011<br />
–703<br />
371<br />
369<br />
2010 2011<br />
Balance sheet press conference 2012<br />
€m<br />
€m<br />
€m<br />
Tax revenue overcompensating<br />
burden from weaker euro<br />
30<br />
31
<strong>Re</strong>insurance – Property-casualty – Combined ratio<br />
Combined ratio reflects severe nat cat losses …<br />
%<br />
2009 95.3<br />
2010 100.5<br />
2011 1 113.6<br />
Q4 2011 101.8<br />
Major losses 2011<br />
2011 5,126<br />
5-year<br />
average<br />
2,225<br />
1,554<br />
Natural catastrophes<br />
1 Before insurance risk transfer to the capital markets.<br />
Basic losses Nat cat losses Man-made losses<br />
4,544<br />
671<br />
43.2<br />
57.5<br />
53.6<br />
50.8<br />
<strong>Re</strong>serve releases: More than €600m (4.0%-pts.) in 2011 – About €400m (10.3%-pts.) in Q4 2011<br />
582<br />
€m<br />
Man-made<br />
Major losses Q4 2011<br />
Q4<br />
2011<br />
1.4 6.9<br />
22.7<br />
11.0<br />
5-year<br />
average<br />
28.8<br />
<strong>Re</strong>insurance – Property-casualty – Combined ratio<br />
… while underlying development remains sound<br />
Combined ratio vs. basic losses<br />
Combined ratio 1 Basic loss ratio<br />
97.3 98.4 93.1 92.3<br />
59.9<br />
1,126<br />
Q1 Q2 Q3 Q4 Q1 Q2 Q3 Q4 Q1 2 Q2 Q3 Q4<br />
2009 2010 2011<br />
Nat cat vs. man-made<br />
5.6<br />
62.0<br />
Nat cat ratio Man-made ratio<br />
9.8 5.2<br />
1 Including overhead costs.<br />
2 Before insurance risk transfer to the capital markets.<br />
109.2 103.8 93.8 96.0<br />
55.5 52.5 58.2 55.2 55.6<br />
9.2<br />
20.8<br />
11.2<br />
Q1 Q2 Q3 Q4 Q1 Q2 Q3 Q4 Q12 3.0 1.5 0.8 -2.1 2.0<br />
5.4<br />
1.5 3.9 2.5 5.5 2.9 4.0<br />
Q2 Q3 Q4<br />
2009 2010 2011<br />
45.8<br />
6.8 11.7<br />
58.3<br />
164.8<br />
74.6<br />
4.7<br />
4.0<br />
504<br />
29.5<br />
3.7<br />
31.2<br />
264<br />
31.9<br />
955<br />
Natural catastrophes<br />
%<br />
99.6 89.0 101.8<br />
51.4 51.1<br />
12.2 5.8<br />
43.2<br />
%<br />
22.7<br />
<strong>Munich</strong> <strong>Re</strong><br />
240<br />
Expense ratio<br />
30.3<br />
Man-made<br />
Balance sheet press conference 2012<br />
Major losses<br />
2011<br />
Earthquake<br />
Japan<br />
Earthquakes<br />
New<br />
Zealand<br />
Flood<br />
Thailand<br />
Flood<br />
Queensland<br />
Hurricane<br />
Irene, USA<br />
Balance sheet press conference 2012<br />
€m<br />
171<br />
€bn<br />
~1.5<br />
~1.5<br />
~0.5<br />
~0.2<br />
~0.1<br />
32<br />
33
<strong>Re</strong>insurance – Settlement of mega losses<br />
Example of Chile 2010: Consultancy and swift<br />
settlement reduce loss amount<br />
Prevention<br />
Seminars and earthquake simulation workshops for cedants<br />
Intensive advice improves emergency planning and thus reaction capability in the event of a loss<br />
After the 2010 quake<br />
Mass damage to residential buildings Large losses<br />
Immediate talks with primary insurers and swift<br />
advance payments facilitate reconstruction<br />
<strong>Munich</strong> <strong>Re</strong><br />
Engineers quickly inspect the largest industrial<br />
losses. Aim: quick repairs and short business<br />
interruption<br />
Support for cedants and efficient claims handling on the spot brings benefits<br />
for all parties – Savings in the high double-digit million range<br />
<strong>Re</strong>insurance – Property-casualty – Nat cat business<br />
Nat cat remains a key profitability contributor for<br />
p-c reinsurance business<br />
Attractive risk-return profile<br />
Premiums<br />
Losses<br />
Expenses<br />
Cost of capital<br />
Economic profit<br />
Sustainable profitability in the past …<br />
1 Accumulated economic profit 1995–2011.<br />
1<br />
Risk analysis capabilities, local presence,<br />
and in-house nat cat and geological<br />
expertise ensure best practice pricing<br />
Stringent management of risk limitation<br />
Even including exceptional years like 2005<br />
and 2011, <strong>Munich</strong> <strong>Re</strong>'s nat cat business<br />
has been profitable for more than 15 years<br />
… expected to be maintained in the future<br />
Balance sheet press conference 2012<br />
<strong>Munich</strong> <strong>Re</strong>'s nat cat exposure continuously<br />
trending higher<br />
Increased expected losses based on model<br />
adjustments (e.g. RMS11)<br />
Inclusion of so far differently allocated losses<br />
(e.g. non-modelled scenarios)<br />
Increase of nat cat share in combined ratio to<br />
8.5%-pts. within a large loss assumption of 12%-pts.<br />
Higher combined ratio reflects nat cat impact observed over recent years<br />
Illustrative<br />
Balance sheet press conference 2012<br />
34<br />
35
<strong>Re</strong>insurance – Property-casualty – <strong>Re</strong>newal outlook<br />
Ongoing price increases expected in upcoming<br />
renewals<br />
January April<br />
July<br />
Worldwide<br />
North<br />
America<br />
TOTAL<br />
€8.5bn<br />
Asia/Pacific/Africa<br />
Latin<br />
America Europe<br />
<strong>Re</strong>newal focus on Europe –<br />
showing flat price development<br />
Nat cat portion only 11% –<br />
with significant price<br />
increases<br />
Casualty portion quite high<br />
Worldwide<br />
Japan/<br />
Korea<br />
TOTAL<br />
€1.1bn<br />
<strong>Re</strong>st of<br />
Asia/Pacific/Africa<br />
Continuation of portfolio improvement expected<br />
<strong>Re</strong>insurance – Property-casualty<br />
Key takeaways<br />
Europe<br />
Latin<br />
America<br />
North<br />
America<br />
Worldwide<br />
Australia/<br />
New<br />
Zealand<br />
North<br />
America<br />
Nat cat portion ~30% – More impact at April/July renewals<br />
<strong>Munich</strong> <strong>Re</strong><br />
TOTAL<br />
€1.8bn<br />
Significant price increases for nat cat expected, as especially<br />
loss-affected regions will be renewed<br />
Trend of nat cat price increases expected to continue<br />
Property-casualty segment continues to show organic growth<br />
based on a strong underlying combined ratio<br />
<strong>Re</strong>st of<br />
Asia/Pacific/Africa<br />
Balance sheet press conference 2012<br />
Europe<br />
Latin<br />
America<br />
<strong>Re</strong>newal focus on Japan/Korea <strong>Re</strong>newal focus on USA, Latin<br />
America and Australia<br />
Even after extraordinary high losses from natural catastrophes in 2011<br />
<strong>Munich</strong> <strong>Re</strong>'s nat cat business remains an important profit contributor<br />
Pleasing development in the January renewals based on strict bottom-line orientation in<br />
tandem with profitable strategic and opportunistic growth – improving pricing prospects<br />
for coming renewals during 2012<br />
Balance sheet press conference 2012<br />
36<br />
37
<strong>Re</strong>insurance – Key figures<br />
Life reinsurance<br />
Net result<br />
202<br />
Q1 Q2 Q3 Q4 Q1 Q2 Q3 Q4<br />
Technical result €m Investment result<br />
€m Other1 79<br />
Despite reserve strengthening<br />
in Australia almost on target<br />
1 Other non-operating result, goodwill impairments, finance costs, taxes.<br />
Life reinsurance<br />
107<br />
47<br />
2010 2011<br />
367<br />
2010 2011<br />
–63<br />
259<br />
873<br />
64<br />
–117<br />
980<br />
2010 2011<br />
Increased regular income due<br />
to large-volume deals<br />
Life reinsurance essential and increasingly<br />
important pillar within <strong>Munich</strong> <strong>Re</strong><br />
Share of life business<br />
within reinsurance segment 1<br />
100<br />
78<br />
22<br />
+ 64%<br />
100<br />
64<br />
36<br />
2000 2011<br />
Life share increased by another<br />
3%-pts. in 2011<br />
% of<br />
GWP<br />
P-C<br />
Life<br />
1 Segmental share of gross written premium (health reinsurance excluded).<br />
277<br />
2007<br />
EEV<br />
197<br />
356<br />
2008<br />
EEV<br />
293<br />
Q1–4 Q1–4<br />
2010 2011<br />
–141<br />
Negative FX effects<br />
Gross written premium (GWP)<br />
5,953<br />
5,284<br />
<strong>Munich</strong> <strong>Re</strong><br />
403<br />
–309<br />
2010 2011<br />
Balance sheet press conference 2012<br />
6,796<br />
Value of new business (VNB)<br />
562<br />
2009<br />
MCEV<br />
New record year 2011<br />
7,901<br />
475<br />
2010<br />
MCEV<br />
9,602<br />
2007 2008 2009 2010 2011<br />
643<br />
Balance sheet press conference 2012<br />
€m<br />
€m<br />
€m<br />
€m<br />
2011<br />
MCEV<br />
38<br />
39
Life reinsurance – Strategic initiatives<br />
Growth fostered by business initiatives<br />
Financially motivated reinsurance<br />
Highly effective response to peak capital<br />
demand in financially distressed situations<br />
Ongoing demand for structures for<br />
financial steering purposes<br />
Extension of core competences<br />
Of high importance for capital relief<br />
in Solvency II regimes<br />
Crucial to offer Variable Annuity<br />
coverage<br />
Asset protection<br />
STRATEGIC<br />
INITIATIVES<br />
Market development Asia<br />
<strong>Munich</strong> <strong>Re</strong><br />
Growth enabler through consultative reinsurance<br />
Longevity<br />
Providing automated underwriting<br />
solutions<br />
High in local presence<br />
Process under development<br />
to define our risk appetite<br />
Pricing of longevity trend challenging<br />
Sustainable growth through consistent execution of business initiatives<br />
Agenda<br />
<strong>Re</strong>liable continuity in times of uncertainty Nikolaus von Bomhard<br />
Financial highlights 2011 Jörg Schneider<br />
Primary insurance Torsten Oletzky<br />
<strong>Re</strong>insurance Torsten Jeworrek<br />
Summary and Outlook Nikolaus von Bomhard<br />
Balance sheet press conference 2012<br />
Balance sheet press conference 2012<br />
40<br />
41
Outlook 2012 – Back to normal<br />
<strong>Munich</strong> <strong>Re</strong> (Group)<br />
GROSS PREMIUMS WRITTEN<br />
€48–50bn<br />
<strong>Re</strong>insurance €25–27bn<br />
Primary insurance €17–18bn<br />
<strong>Munich</strong> Health<br />
<strong>Re</strong>insurance Primary insurance <strong>Munich</strong> Health<br />
Combined ratio<br />
~96% over the cycle<br />
Net result<br />
€1.9–2.1bn<br />
Disclaimer<br />
slightly<br />
above €6bn<br />
RETURN ON INVESTMENT<br />
~3.5%<br />
Ongoing low interest rate<br />
environment gradually<br />
reducing running yield to<br />
slightly below 4%<br />
Combined ratio<br />


